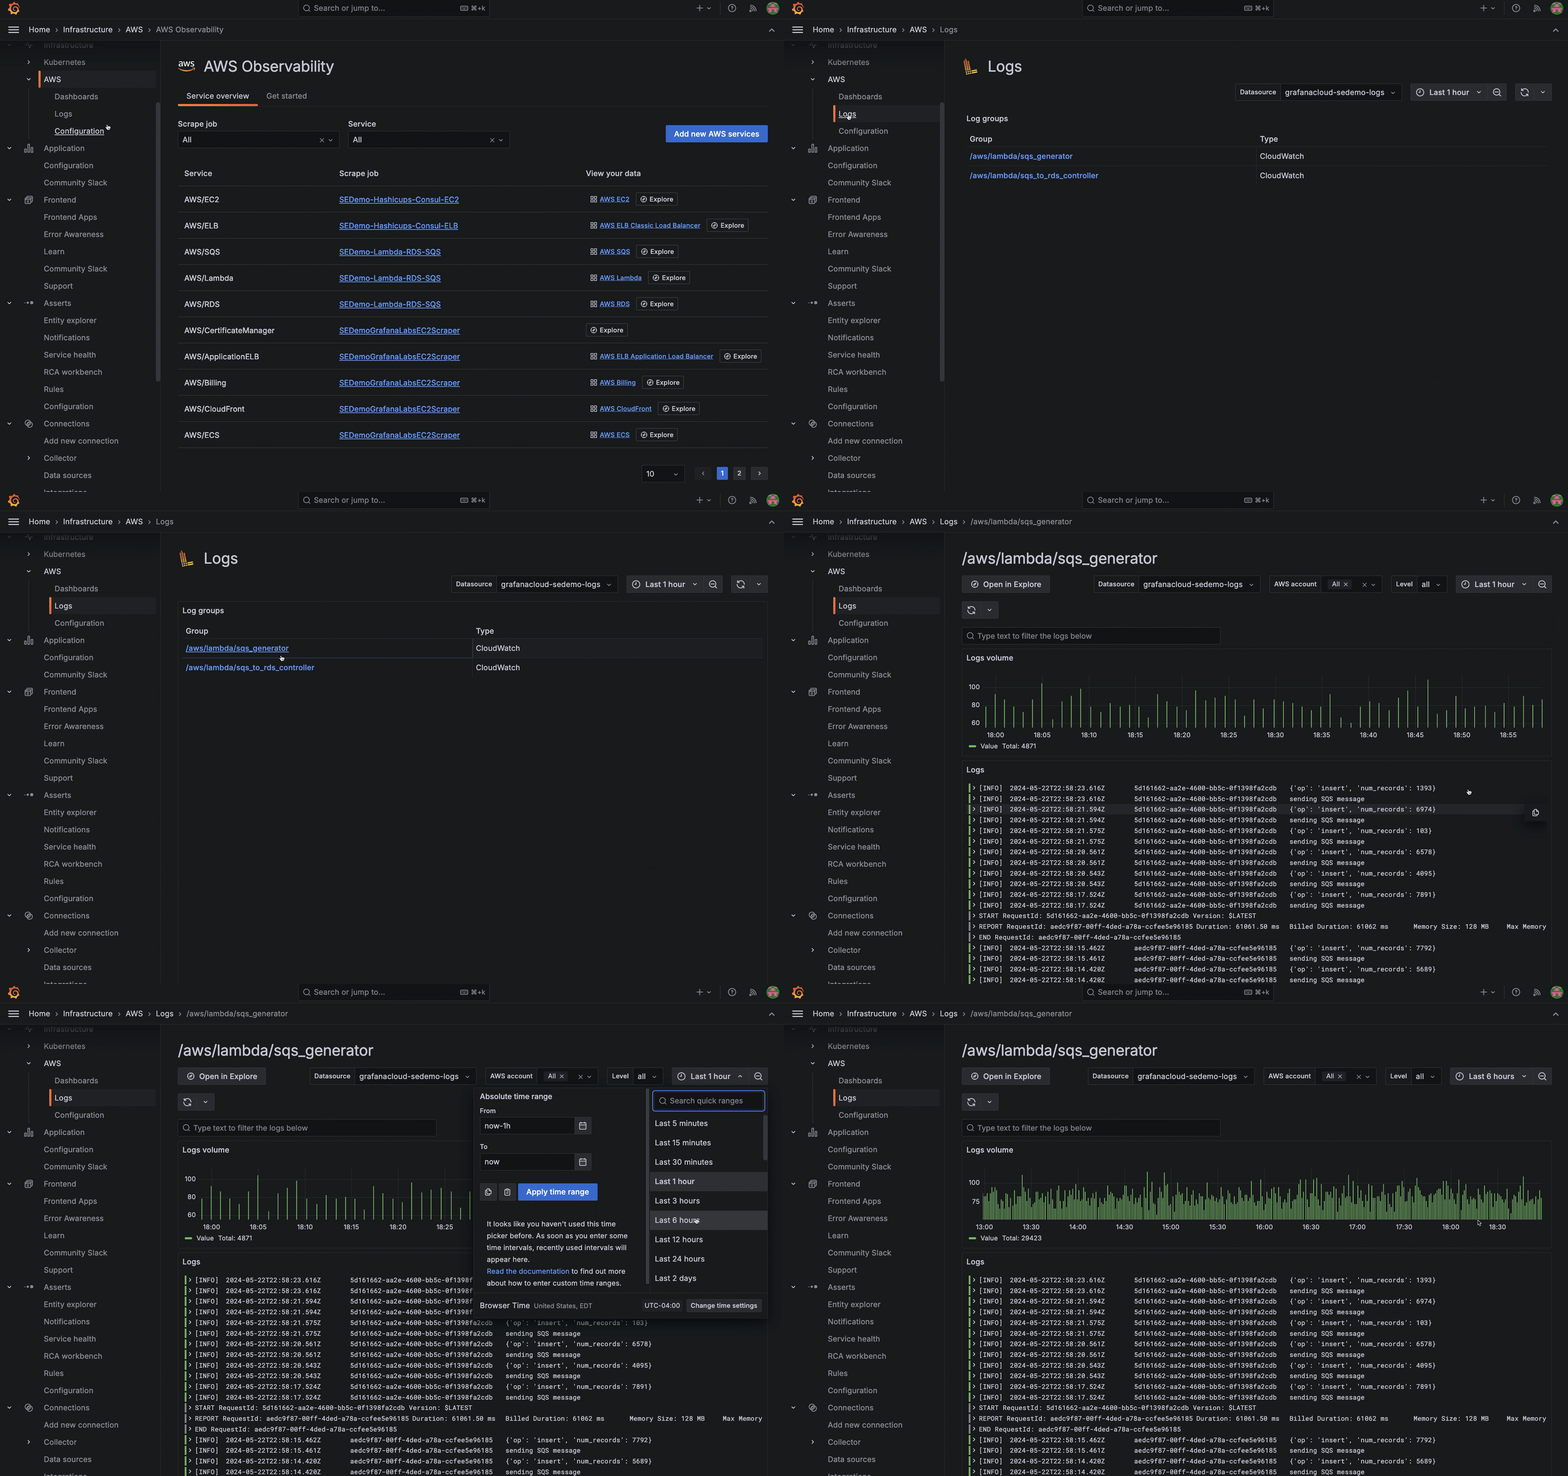
Monitor AWS logs
Within AWS Observability, you can view and drill down into log groups available in Grafana Cloud Logs. To view the Logs page, click Logs on the main menu. To search and analyze your log data easily:
- Click the group you want to view.
- Change the time range selector to the time range you want to view.
- Filter the logs you want to view by search text, AWS account, and log level.

Methods for sending logs
You can use these methods to send AWS logs to Grafana Cloud:
- Lambda-compatible agent for logs: Send logs stored in an S3 bucket to Grafana Cloud by deploying a Lambda-compatible agent for logs (lambda-promtail) into your AWS infrastructure.
- Amazon Data Firehose: Use Data Firehose to batch and send ingested data to Grafana Cloud.
To help you consider which method is best for you, review the type of log recommended for each method.
Lambda method recommendation
The Lambda-compatible agent works best for the following types of logs:
Streaming method recommendation
With the Data Firehose method, you don’t have to deploy new infrastructure, agents, or local configurations. Instead, you configure a Data Firehose stream from your AWS infrastructure to batch and send ingested records to Grafana Cloud Logs.
Data Firehose streaming works best for the following types of logs:
| Log type | Log delivery in AWS |
|---|---|
| Amazon CloudWatch logs | Use Subscription Filters to send the logs to Data Firehose |
| Amazon RDS instance logs | Through CloudWatch logs |
| VPC flow logs | Through Data Firehose |


