AWS S3
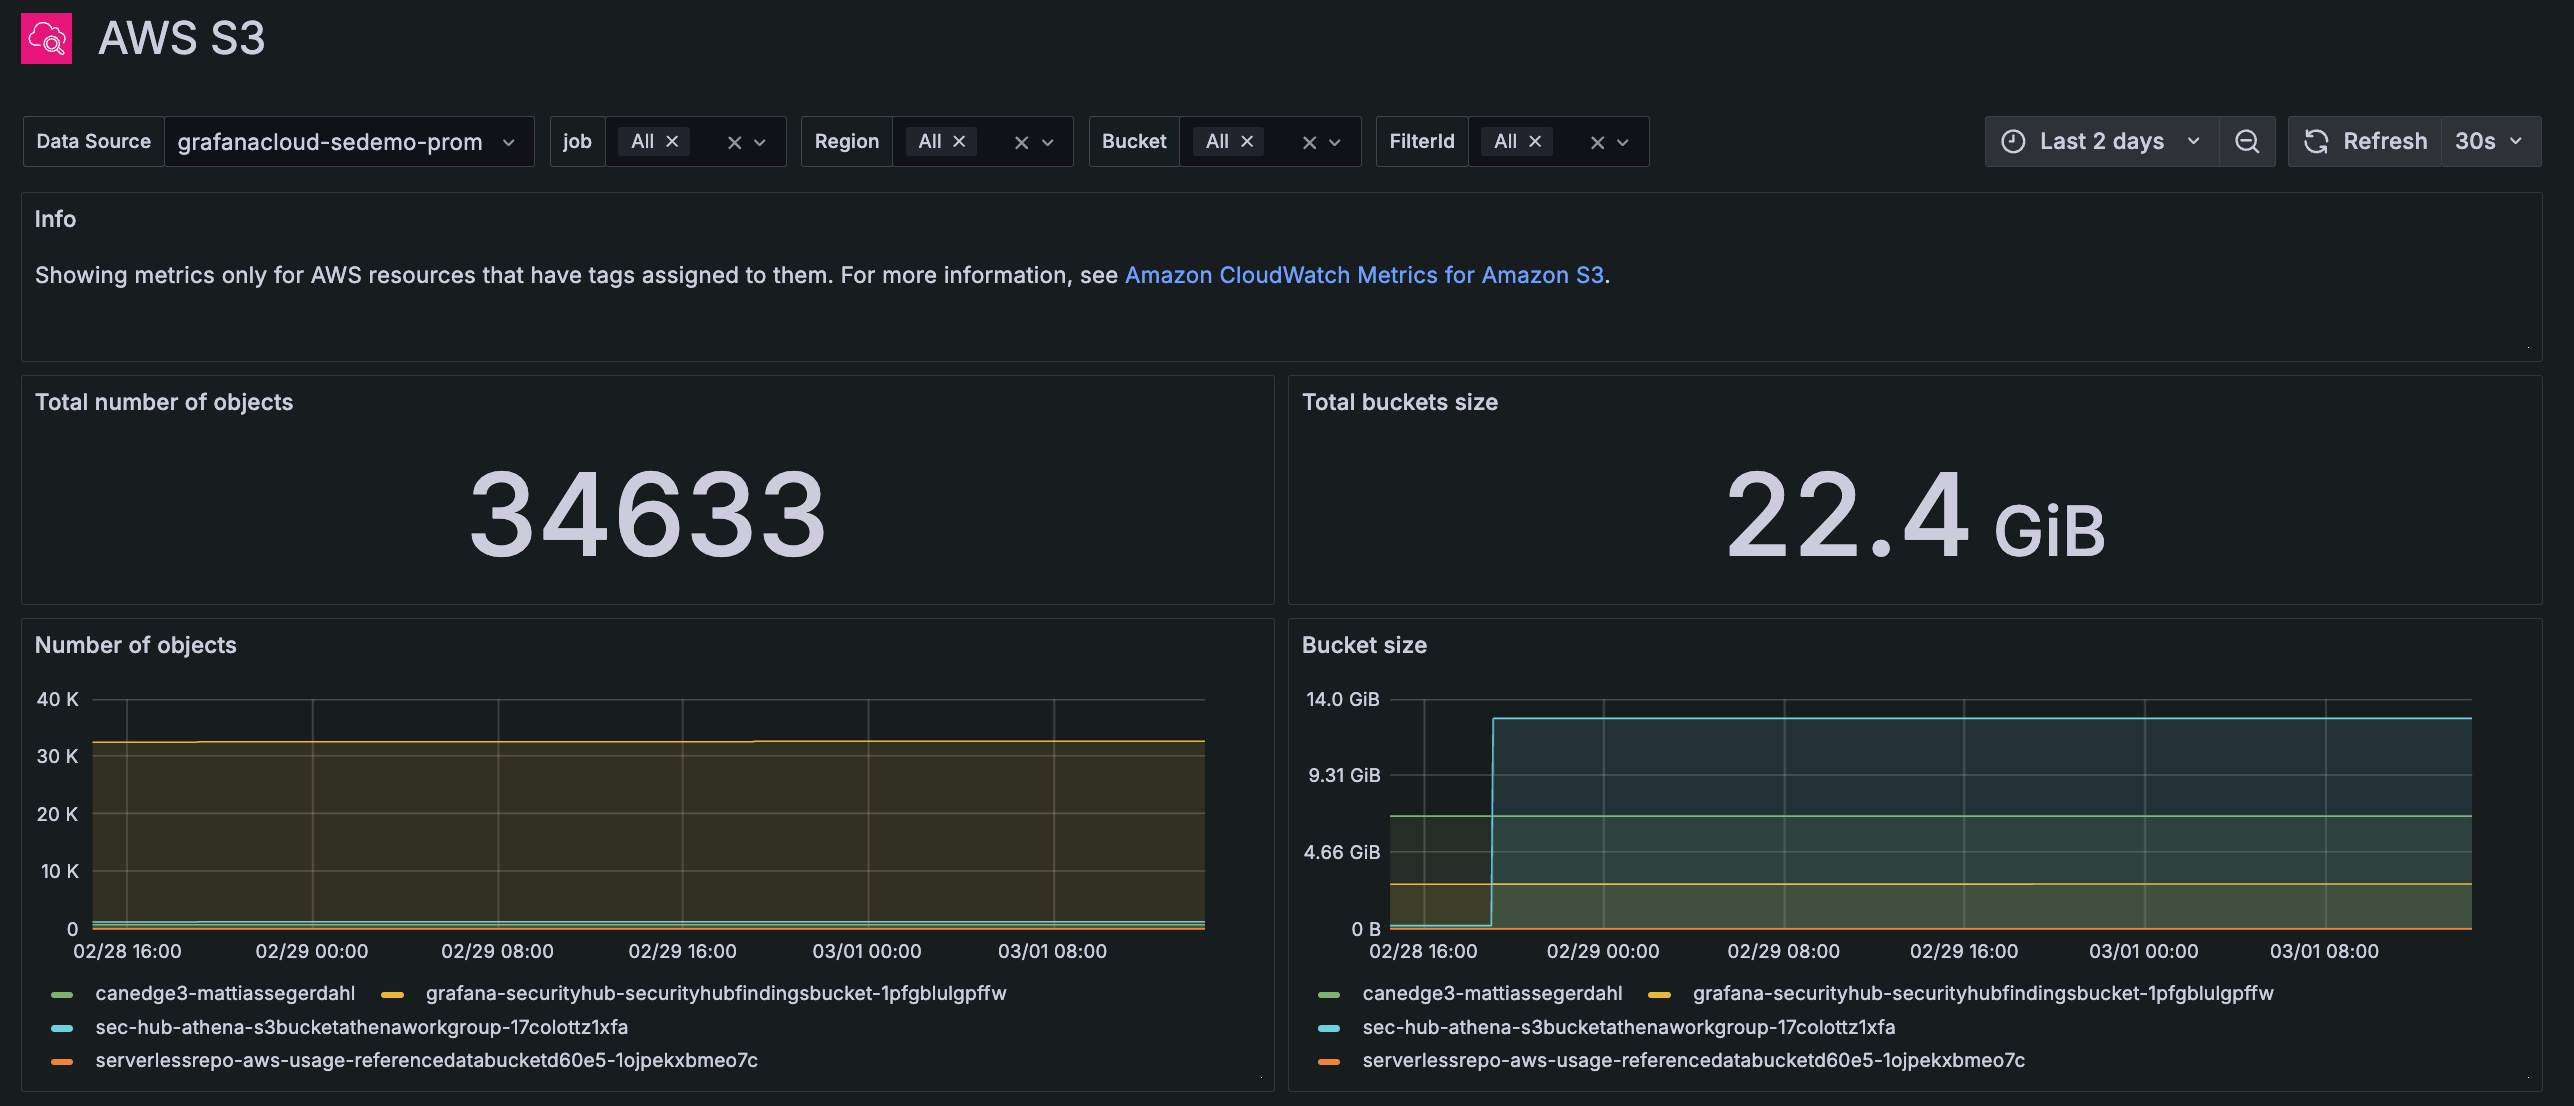
The AWS S3 dashboard allows you to monitor your Amazon Simple Storage Service S3 object buckets and keep track of their size, volume of data, and number of objects. You also have access to view request metrics, such as latency and error rate.
Products
LGTM+ Stack
Key Capabilities
Observability Solutions
Deploy The Stack
Open Source
Community resources
Dashboard templates
Try out and share prebuilt visualizations
Prometheus exporters
Get your metrics into Prometheus quickly
end-to-end solutions
Opinionated solutions that help you get there easier and faster
monitor infrastructure
Out-of-the-box KPIs, dashboards, and alerts for observability
visualize any data
Instantly connect all your data sources to Grafana
Learn
Stay up to date
Technical learning
Docs
Get started
Get started with Grafana
Build your first dashboard
Get started with Grafana Cloud
What's new / Release notes
Help build the future of open source observability software Open positions
Check out the open source projects we support Downloads
Deploy The Stack
end-to-end solutions
Opinionated solutions that help you get there easier and faster
visualize any data
Instantly connect all your data sources to Grafana
The AWS S3 dashboard allows you to monitor your Amazon Simple Storage Service S3 object buckets and keep track of their size, volume of data, and number of objects. You also have access to view request metrics, such as latency and error rate.