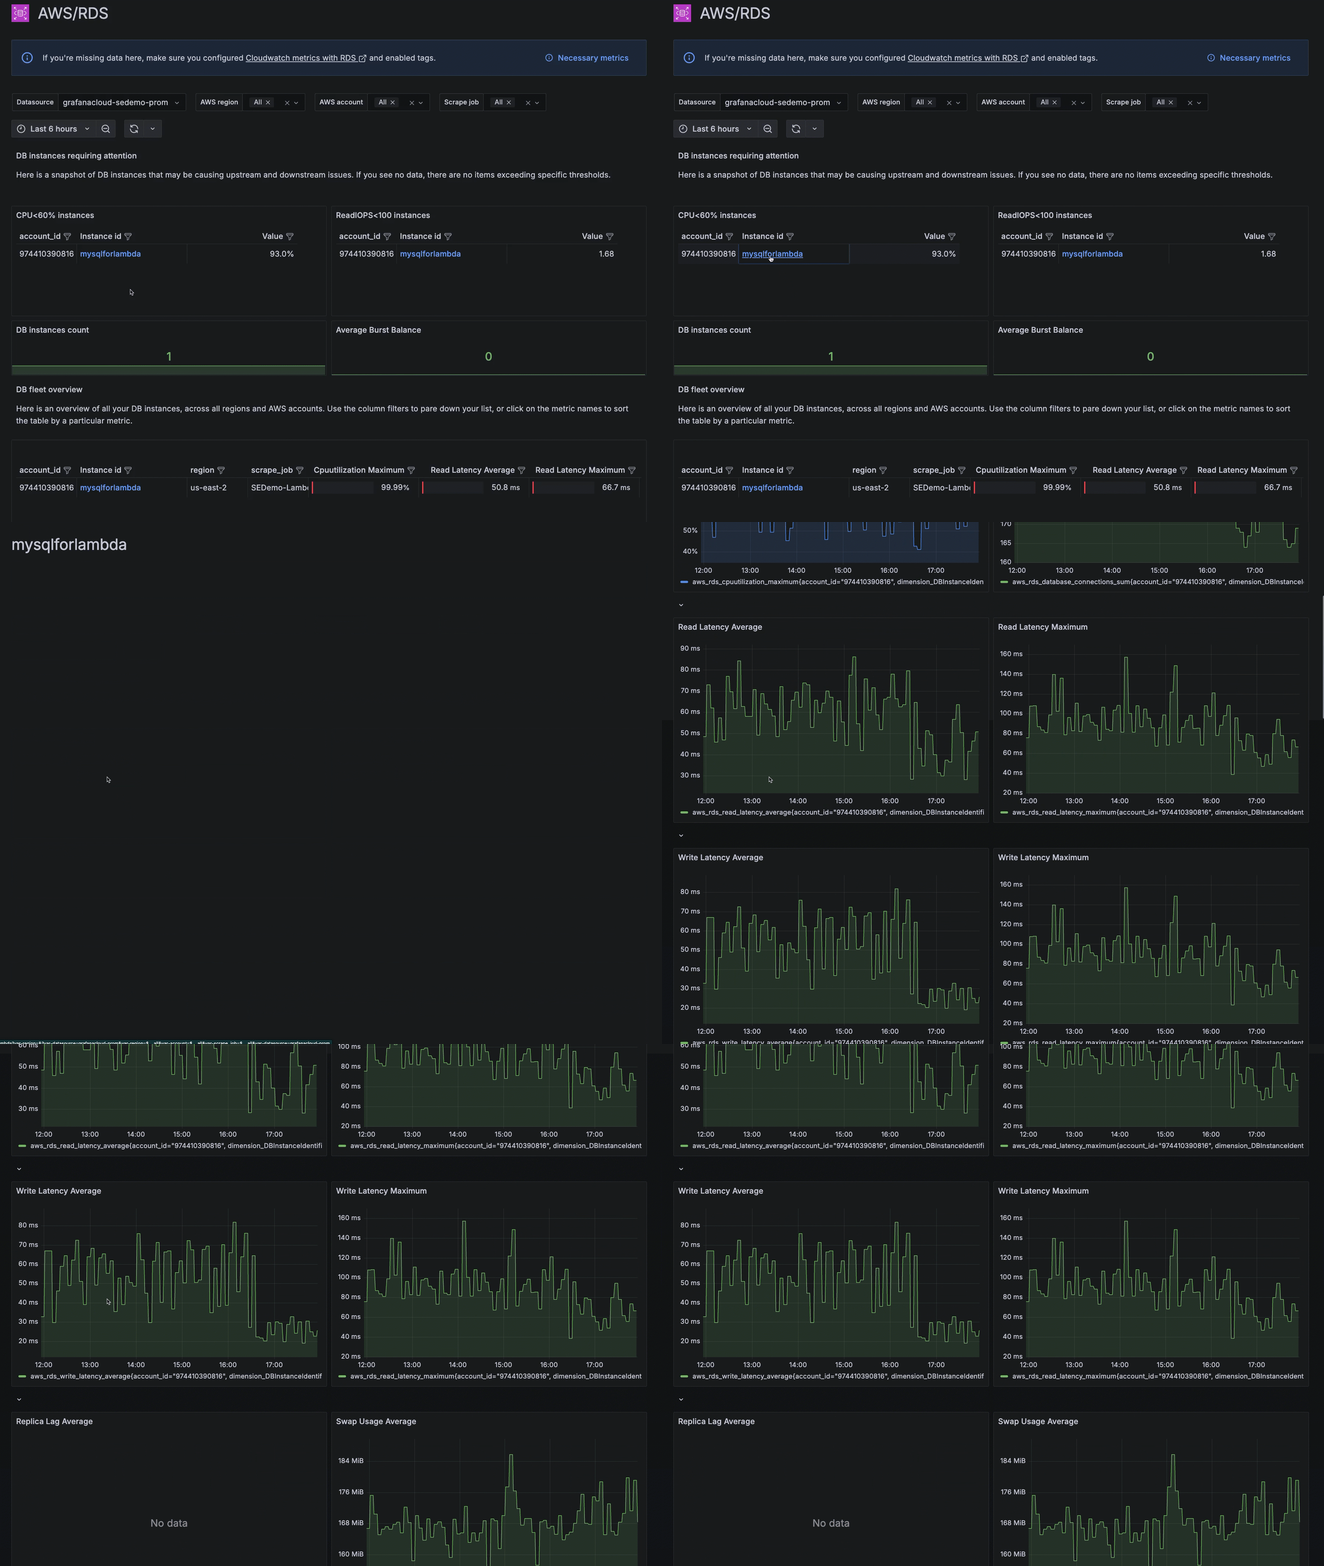
AWS RDS dashboard
Monitor your Amazon Relational Database Service (RDS) instances within AWS Observability, and troubleshoot common issues like CPU and memory provisioning.
The RDS dashboard shows metrics that include CPU utilization, database connection count, disk throughput, IOPS, and availability.
Analyze RDS instances
At the RDS Dashboard, you can:
- Change the time range selector
- Filter by region, account, and scrape job
- Sort and filter any column for these metrics in the list of instances:
- CPU utilization maximum
- Read and write latency average
- Read IOPS and Write IOPS average
- Swap usage average
- Aurora replica lag average
- Filter the list of instances by clicking the instance counts for CPU<60% and ReadIOPS<100.
- Click an instance in the list to view graphs for that instance.
![Viewing the graphs for an RDS instance in the AWS RDS dashboard Viewing the graphs for an RDS instance in the AWS RDS dashboard]()
Viewing the graphs for an RDS instance in the AWS RDS dashboard


