Preconfigured dashboards
CloudWatch metrics installs the following preconfigured dashboards in your Grafana Cloud instance. These dashboards are embedded in and accessible in the AWS Observability app.
Go to an AWS dashboard
- To see any dashboard, configure CloudWatch metrics and create your scrape job. You’ll see the job in the list of scrape jobs on the CloudWatch metrics page.
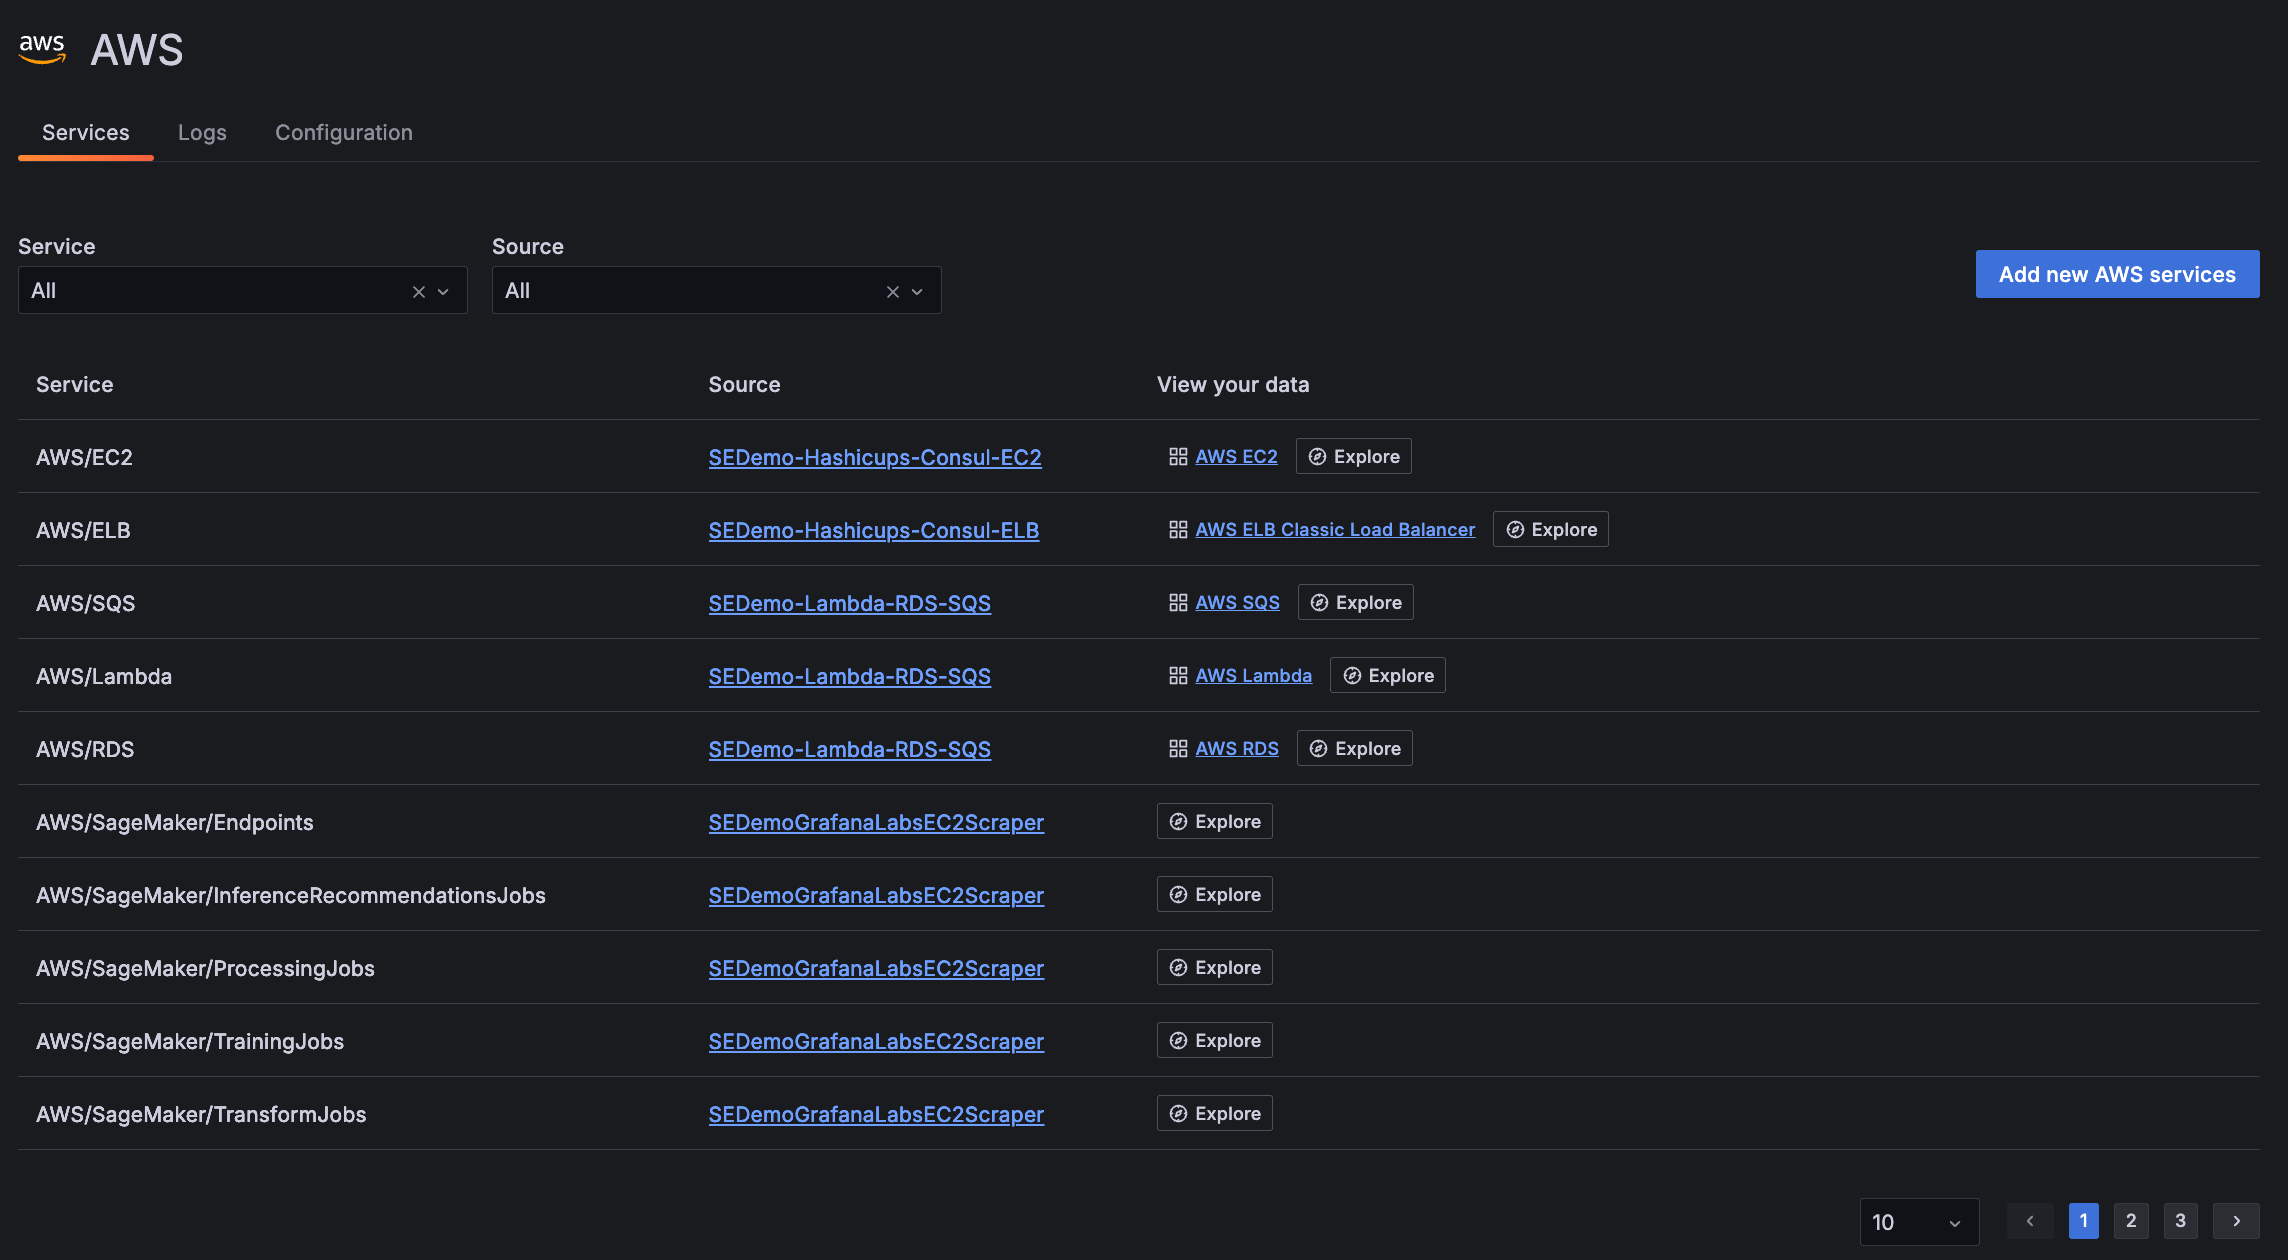
- In the main menu, click AWS to open the Services tab.
![List of available services on **Services** tab List of available services on **Services** tab]()
List of available services on Services tab - Locate the specific service in the list, and click the dashboard in the View your data column of the table.
Refine dashboard data
You can use the filters on dashboards to refine your data by:
- Data source
- Job
- Resource group
- Subscription name
- Resource name

Additionally, use the time range selector to change time period of your data.

Dashboards out of the box
The following dashboards are available:


