Configure CloudWatch metrics
When you configure CloudWatch metrics, you can choose to configure automatically or manually in the AWS Management Console. With automatic configuration, you can use either CloudFormation or Terraform. Choose the one that fits with your setup. Either of these options not only automate the process, but allows you to keep track of the resources created.
The connection and configuration process for CloudFormation and Terraform includes these major processes:
- Connecting to your AWS account
- Configuring the connection between Grafana Cloud and your AWS account
- Choosing the service to monitor and configuring its settings
Note
For AWS to ingest metrics from CloudWatch into Grafana Cloud, you must set at least one tag on a resource in AWS.
Navigate to CloudWatch metrics
- Navigate to your Grafana Cloud portal.
- In your Grafana Cloud stack, expand Cloud Provider in the main menu.
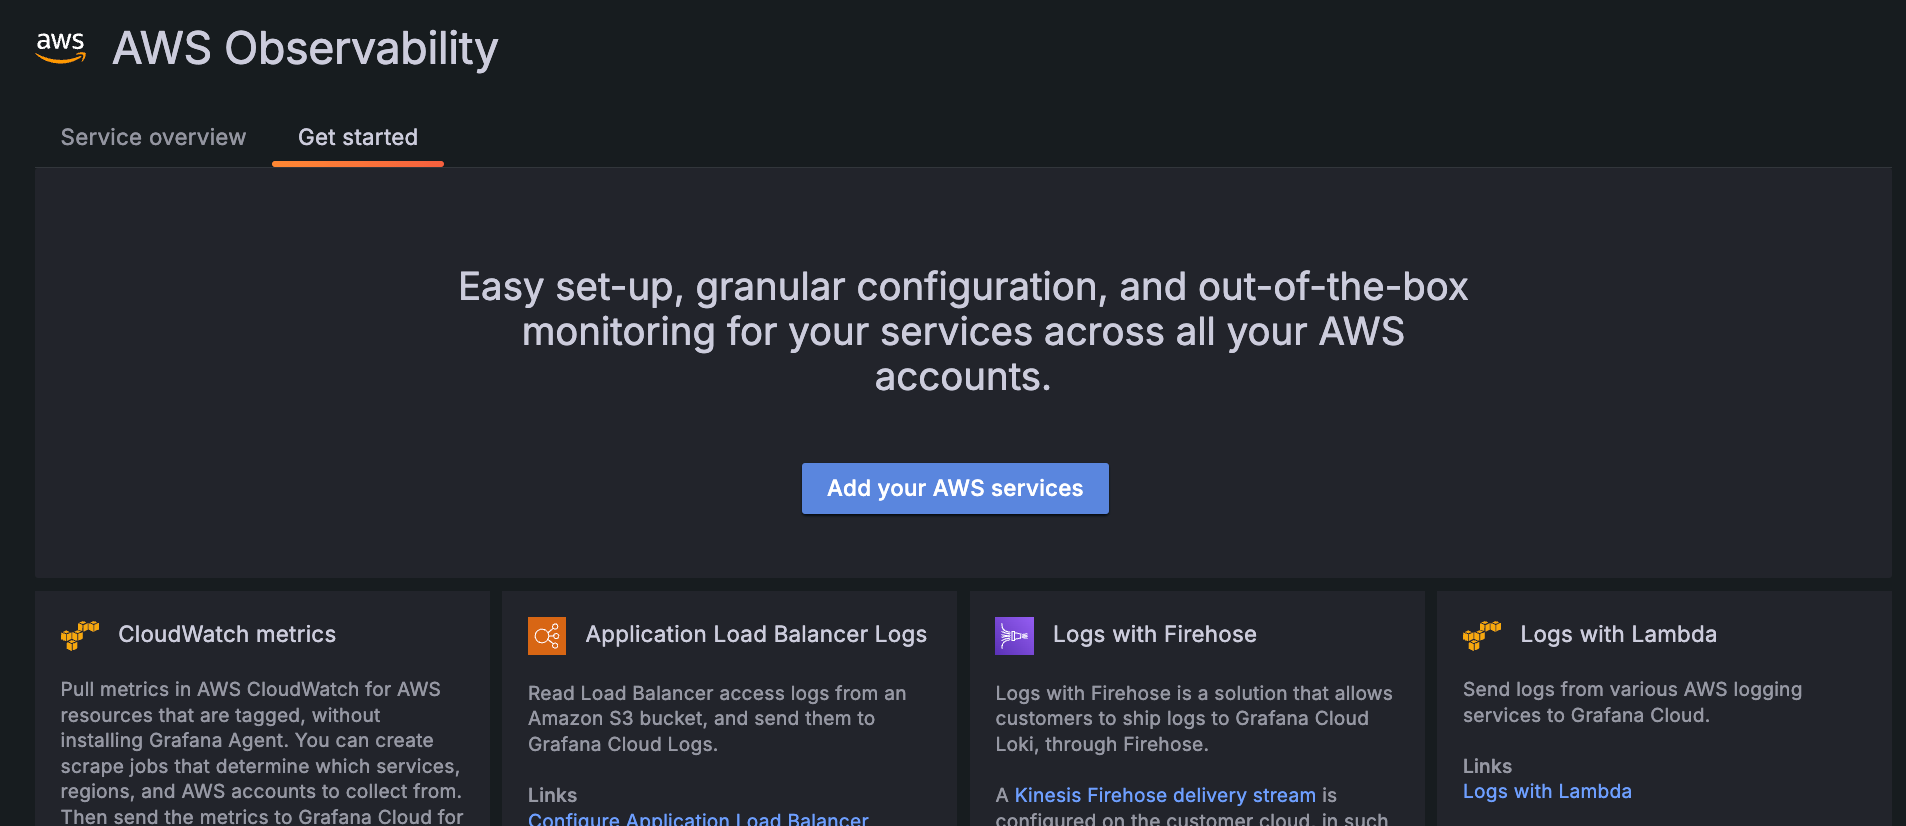
- Click AWS, then click Add your AWS services.
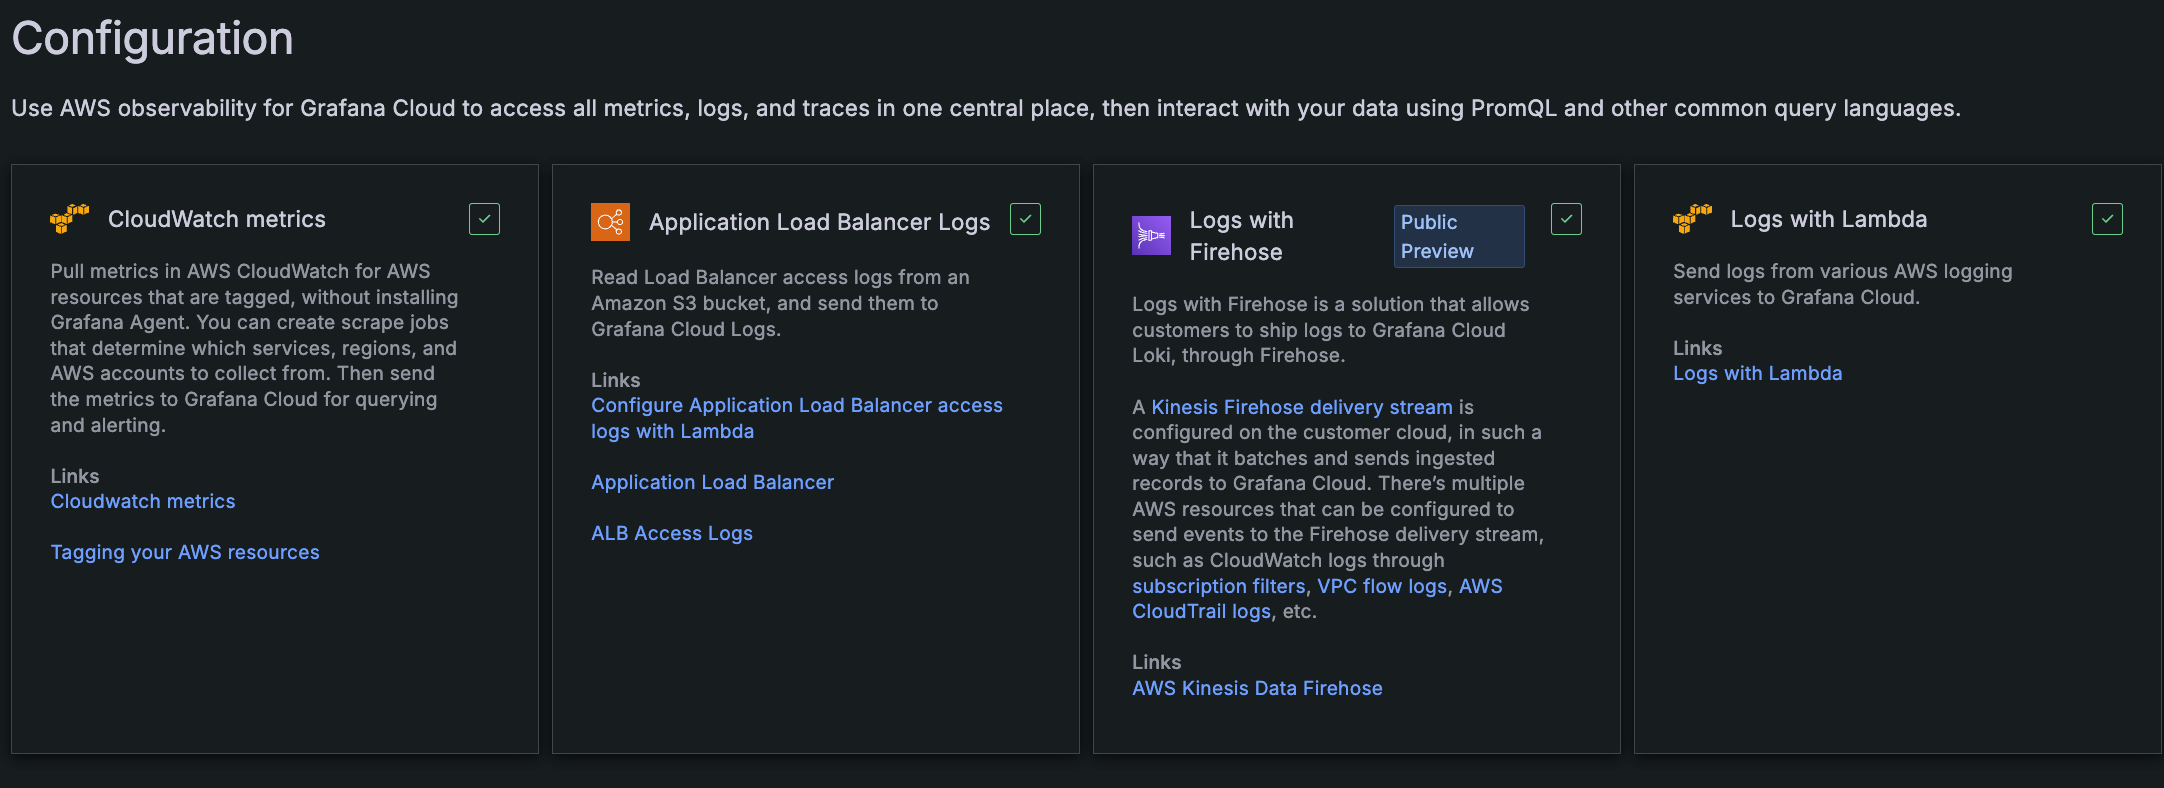
At the Configuration page, find and click the CloudWatch metrics tile.
![Configuration choices Configuration choices]()
Configuration choices At the CloudWatch metrics page, click Add new scrape job. The Create new scrape job configuration page appears.
Perform subsequent steps to configure:
- Automatically with Cloud Formation
- Automatically with Terraform
- Manually starting at the AWS Management Console
Configure automatically with Cloud Formation
Complete the following process to configure with Cloud Formation.
Create a new AWS role
Create an AWS role so that Grafana can then assume a role that has access only to your CloudWatch data, with no need to share access and secret keys.
- At the Create new scrape job configuration page, select Automatically to create a new role in the AWS IAM console.
- Click Use CloudFormation.
- Click Launch stack.
- Follow the steps to create the IAM role in AWS CloudFormation.
- Return to the CloudWatch metrics Create new scrape job page.
Connect to AWS account
- At the CloudWatch metrics page in the Scrape job name box, enter the name of your scrape job.
Give your scrape job a unique name that contains only alphanumeric characters, dashes, and underscores. - In the ARN box, paste the ARN you copied from your AWS IAM role you created.
- From the AWS Regions drop-down menu, select the regions where you have services you want to monitor.
- Include your AWS resource tags is selected by default. For more information, refer to Query tag data. Ensure your tags adhere to AWS best practices, such as not containing personally identifiable information or other confidential or sensitive information.
Note
Including tags increases the total number of active series, which can impact your Grafana Cloud costs.
- Click Configure AWS Account to ensure the connection is working.
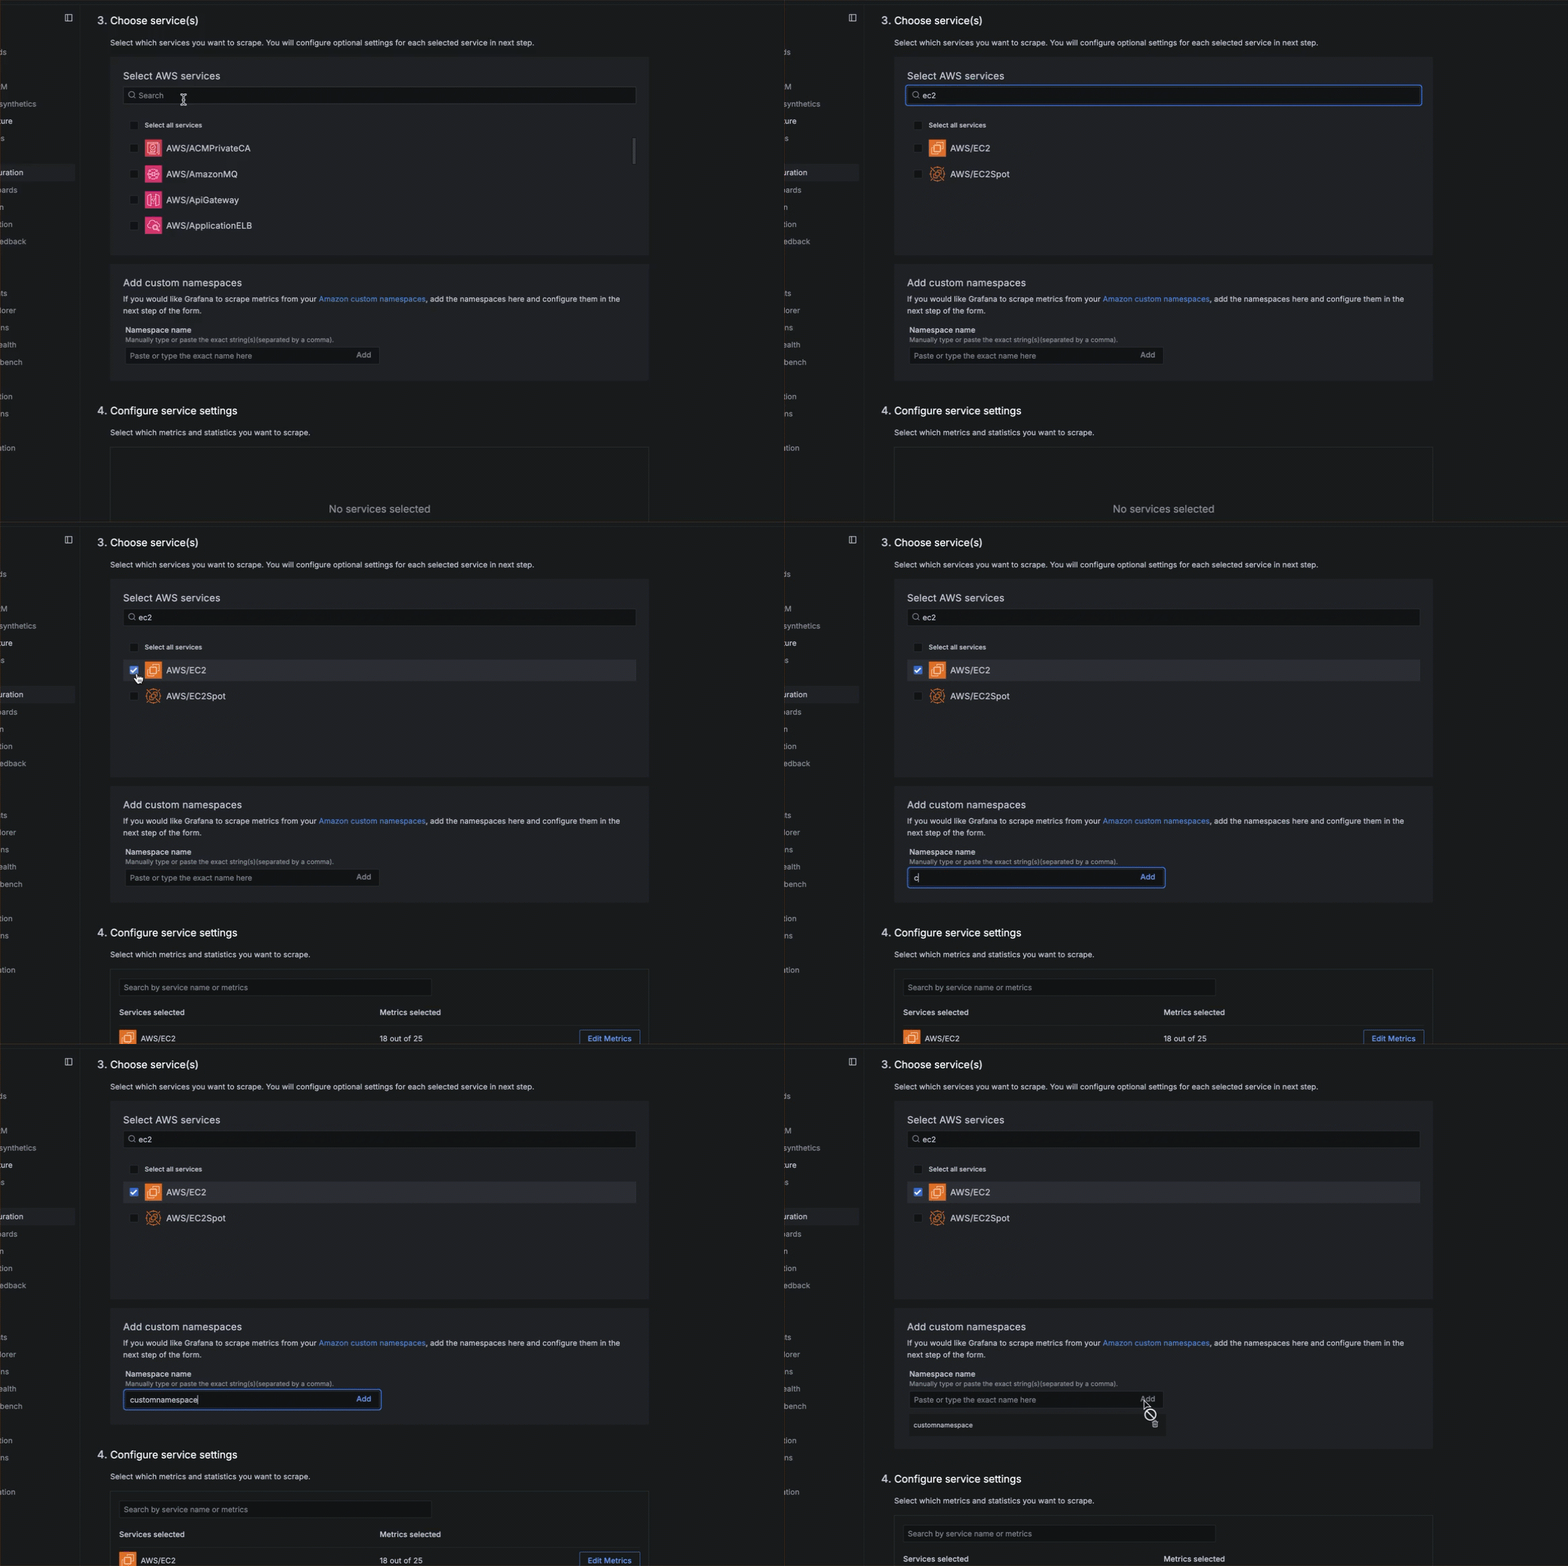
Choose services
- Choose the services you want to scrape. You can search in the search box or browse in the list of services.
- Optionally, enter a custom namespace in the Namespace name box and click Add.
Configure service settings
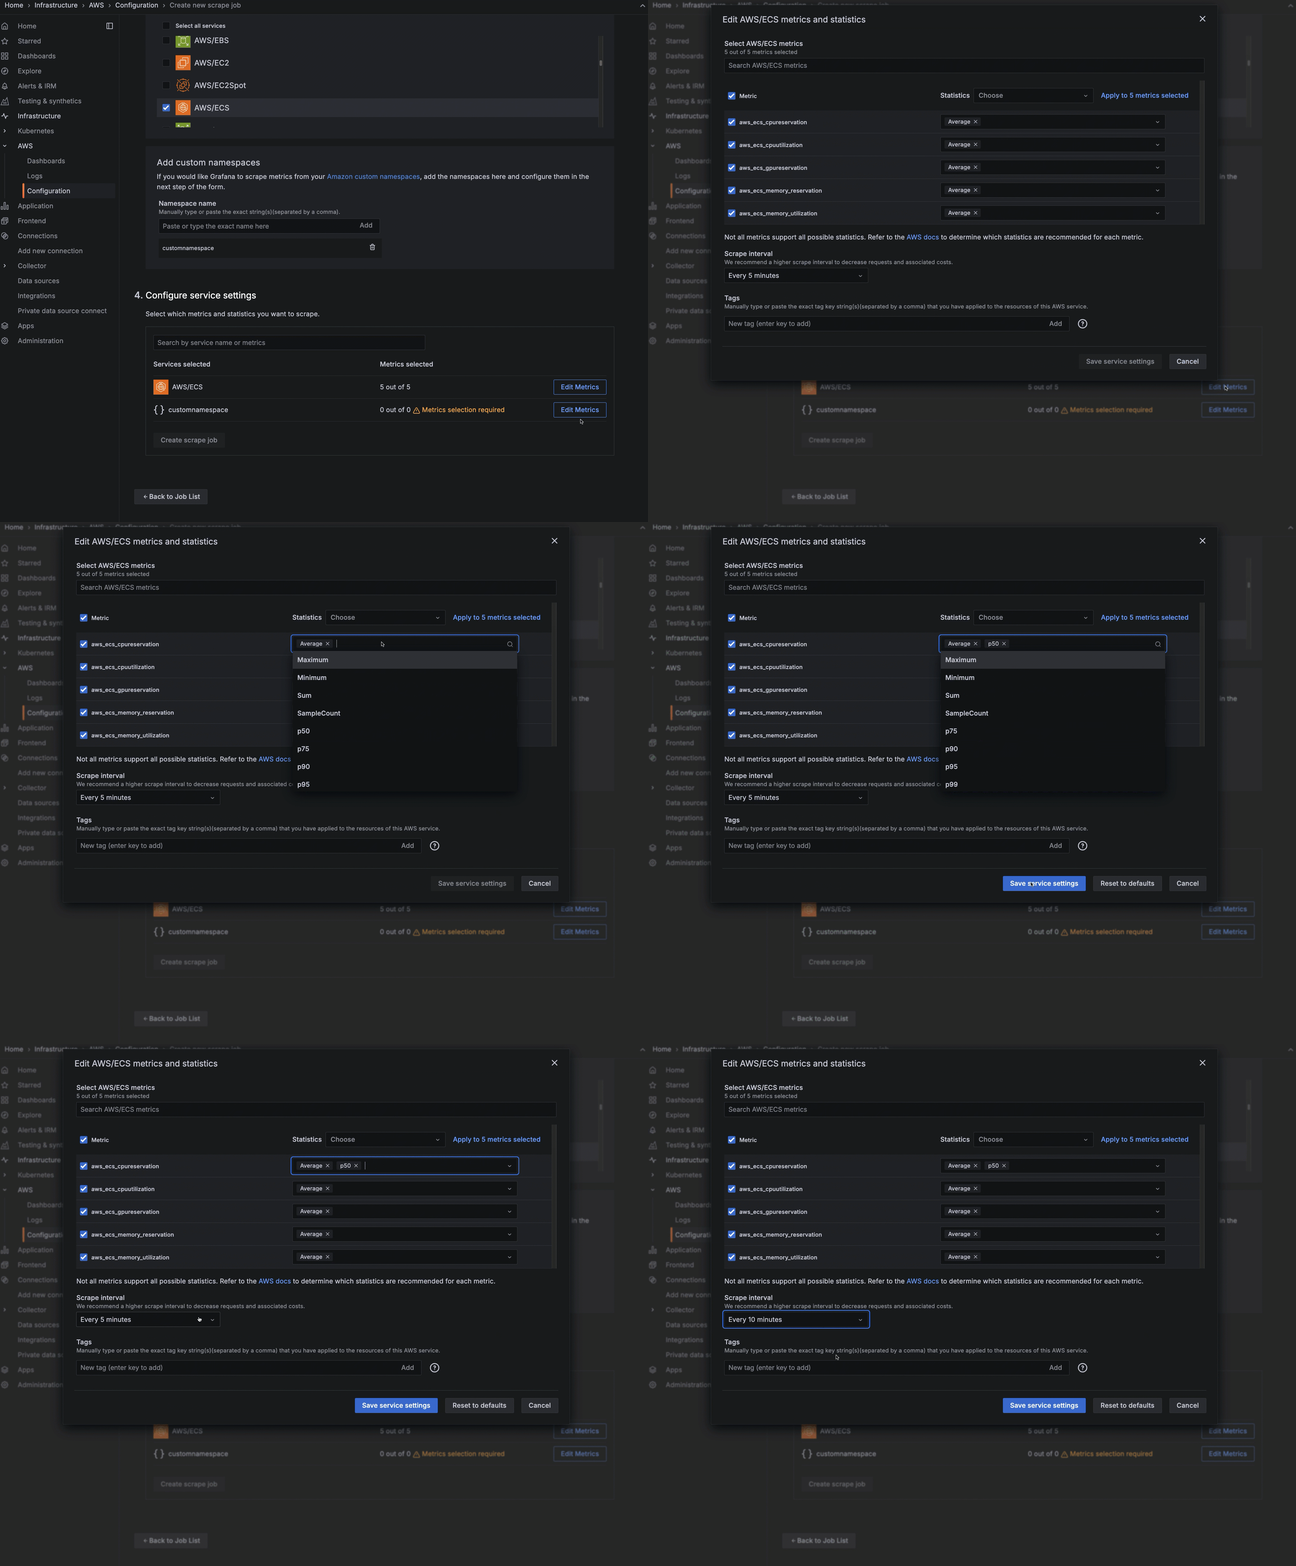
For each service and namespace you have chosen to scrape, select which metrics you want to collect. A default set of metrics is included for each service. For custom namespaces, you must enter the metrics.
- Click Edit Metrics next to the service or namespace to open the edit view.
- Select or deselect metrics.
- For each metric selected, choose the statistics you want to include. You can also choose statistics to apply to all metrics you have selected. Refer to AWS documentation to determine which statistics are possible or best for each metric.
- Select the scrape interval.
- For a custom namespace, click Edit Metrics, and add metrics and statistics.
Optionally configure resource tag use
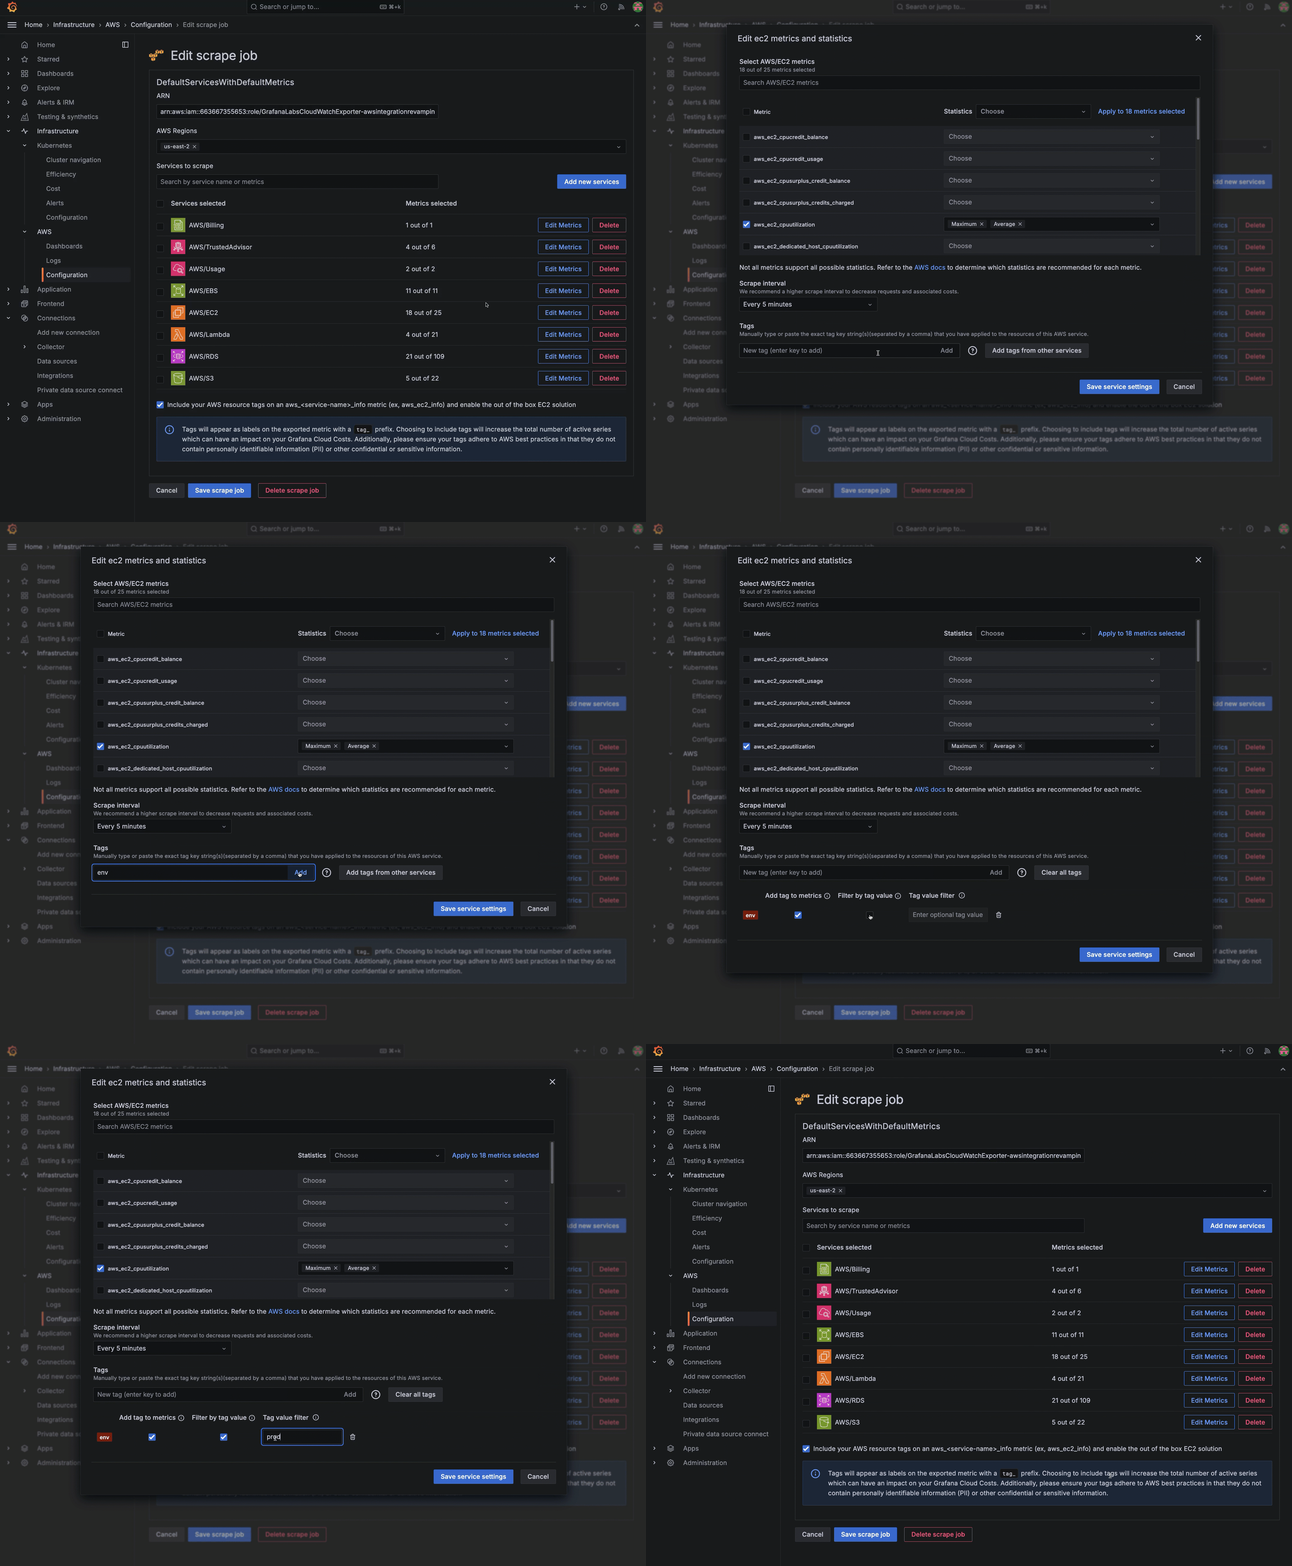
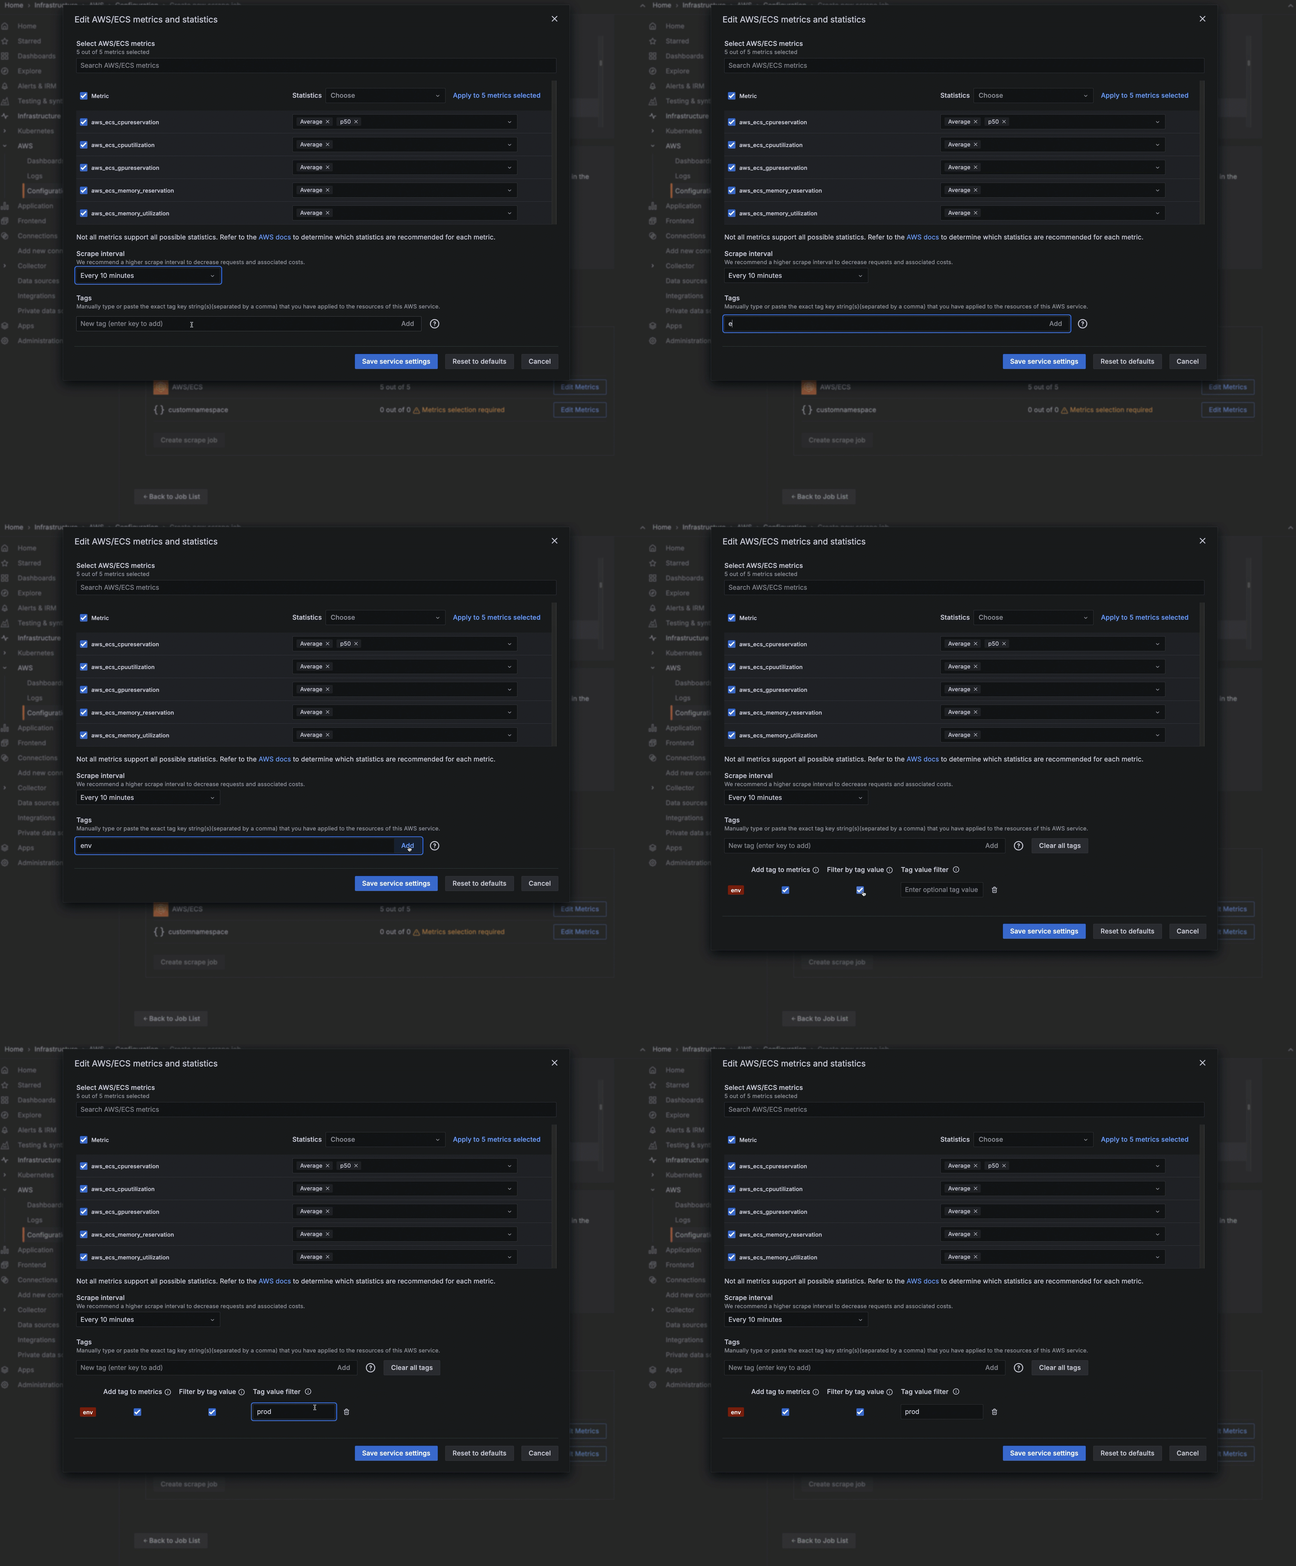
To pull metrics from Amazon CloudWatch into Grafana Cloud, you must have tagged resources in AWS. Optionally, you can narrow the metrics you pull by adding the tag you have placed on a metric in AWS, using the exact AWS tag format. To do so:
- In the Tags section, enter the name of the tag you have assigned in AWS. To add more than one tag, separate them with a comma.
- Select to add this tag to the metrics.
- To further filter, select to Filter by tag value and enter the value associated with the tag.
- Click Save service settings.
Save settings
- After editing the service or namespace, click Save service settings.
- Click Create scrape job to begin collecting metrics.
![Adding a tag and tag value Adding a tag and tag value]()
Adding a tag and tag value
Explore your AWS service data
Click Install dashboards and alerts to install prebuilt dashboards and alerts.
You can now view:
Configure automatically with Terraform
Refer to Terraform configuration for instructions on using Terraform to scrape your CloudWatch metrics data.
Configure manually in the AWS Management Console
When you create the role in the AWS IAM console, there are many more steps required. It is recommended that you use CloudFormation or Terraform to configure.
Before you begin
Make sure you have:
- Username / Instance ID for your Grafana Cloud Prometheus. You can find this by clicking on Details in the Prometheus card of the Grafana Cloud Portal.
- External ID: AWS uses an external ID to provide an extra layer of security when giving Grafana access to pull your CloudWatch metrics into Grafana Cloud.
Create a new AWS role
Create an AWS role so that Grafana can then assume a role that has access only to your CloudWatch data, with no need to share access and secret keys.
- At the Create new scrape job configuration page, select Manually to create a new role in the AWS IAM console.
- Click Open AWS IAM Console to open the IAM console.
- In Roles, click Create role.
- Select AWS Account for Trusted entity type.
- Select Another AWS account.
- In Account ID, enter the Grafana AWS account ID shown on the Create new scrape job configuration page.
- Select Require external ID, and enter the Username / Instance ID for your Grafana Cloud Prometheus as shown on the Create new scrape job page.
- Click Next: Permissions, then Create policy.
- At the Grafana Cloud Create new scrape job page under the Grant permissions to Grafana Cloud section, copy and paste the JSON into the policy text box in the AWS IAM console. This replaces the existing code.
Connect to AWS account
- At the Create new scrape job page in the Scrape job name box, enter the name of your scrape job.
Give your scrape job a unique name, containing only alphanumeric characters, dashes, and underscores. - Paste the ARN from your AWS IAM role in the ARN box.
- From the AWS Regions drop-down menu, select the regions where you have services you want to monitor.
- Include your AWS resource tags is selected by default. For more information, refer to Query tag data. Ensure your tags adhere to AWS best practices, such as not containing personally identifiable information or other confidential or sensitive information.
- Click Configure AWS Account to ensure the connection is working.
Choose services
- Choose the services you want to scrape. You can search in the search box or browse in the list of services.
- Optionally, enter a custom namespace in the Namespace name box and click Add.
Configure service settings
For each service and namespace you have chosen to scrape, select which metrics you want to collect. A default set of metrics is included for each service. For custom namespaces, you must enter the metrics.
- Click Edit Metrics next to the service or namespace to open the edit view.
- Select or deselect metrics.
- For each metric selected, choose the statistics you want to include. You can also choose statistics to apply to all metrics you have selected. Refer to AWS documentation to determine which statistics are possible or best for each metric.
- Select the scrape interval.
- For a custom namespace, click Edit Metrics, and add metrics and statistics.

Optionally configure resource tag use
Optionally, you can narrow the metrics you pull by adding the tag you have placed on a metric in AWS, using the exact AWS tag format. To do so:
- In the Tags section, enter the name of the tag you have assigned in AWS. To add more than one tag, separate them with a comma.
- Select to add this tag to the metrics.
- To further filter, select to Filter by tag value and enter the value associated with the tag.
- Click Save service settings.

Save settings
- After editing the service or namespace, click Save service settings.
- Click Create scrape job to begin collecting metrics.
View your dashboards and alerts
Click Install dashboards and alerts to install prebuilt dashboards and alerts.
You can now view:
Add, edit or delete a scrape job
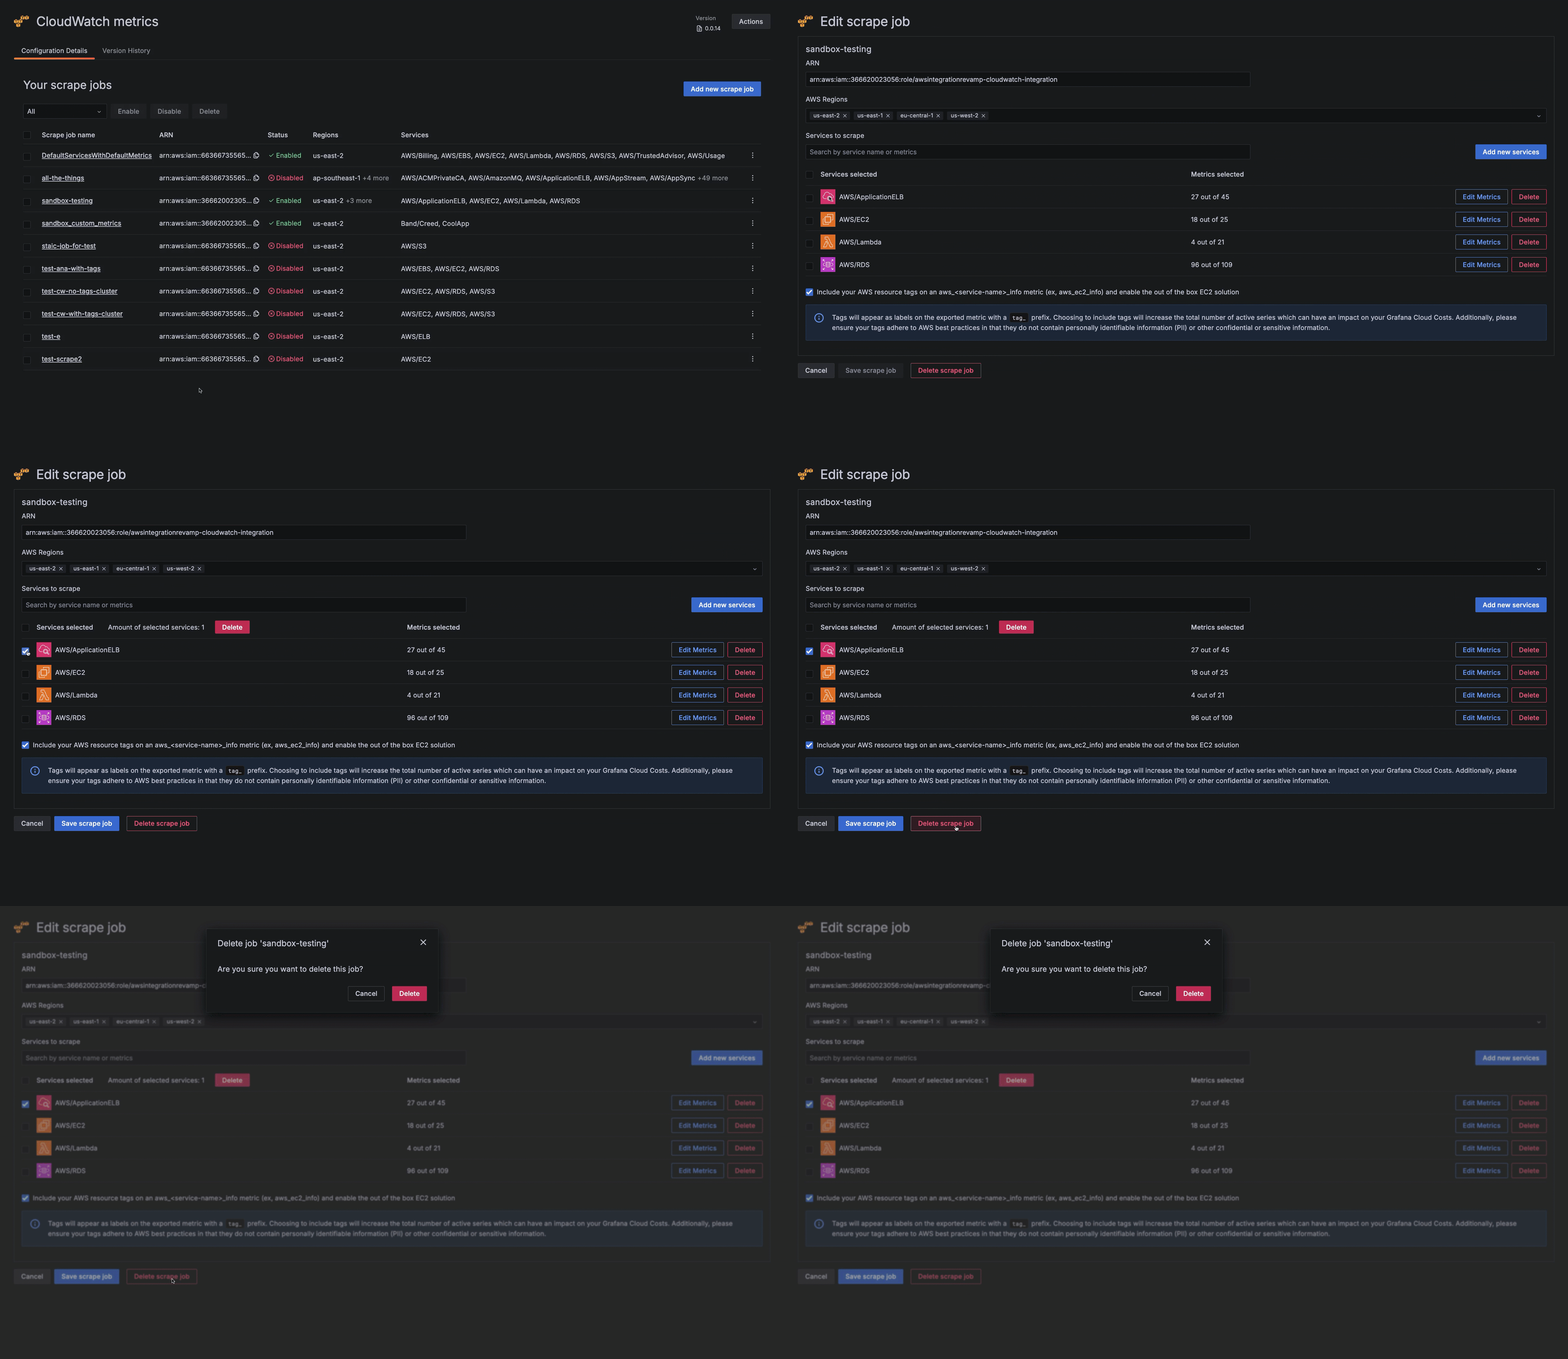
To add a scrape job, on the Your scrape jobs page, click Add new scrape job.
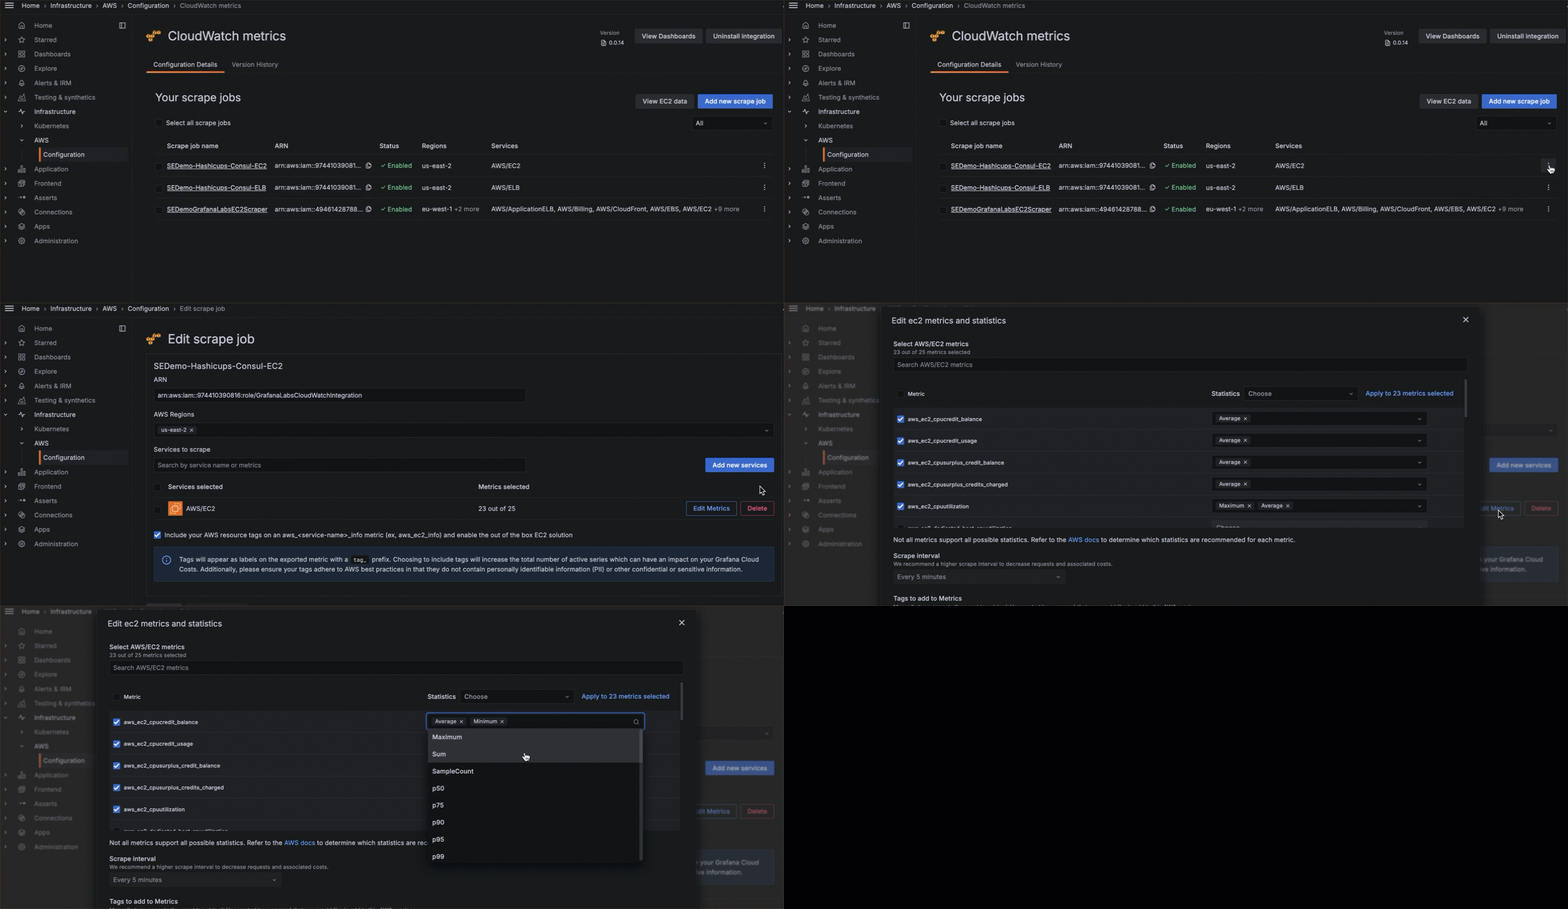
To edit a scrape job:
Click Configuration on the main menu, then click the CloudWatch metrics tile.
At the Your scrape jobs page, open the edit view by one of these methods:
- Click the name of the scrape job.
- Click the three-dot menu icon next to the scrape job, and select Edit.
In the Edit scrape job view, make your changes.
Click Save scrape job.
To delete a scrape job, at the Your scrape jobs page, you can either:
Click the name of the scrape job to open the Edit scrape job page, click Delete scrape job, then click Delete to confirm.
![Deleting a scrape job Deleting a scrape job]()
Deleting a scrape job Click the three-dot menu icon next to the scrape job, select Delete, then click Delete to confirm.
Enable account_alias label in collected metrics
Amazon CloudWatch Metrics supports pulling the AWS Account alias, as an additional label, account_alias, into all collected metrics. If the configured IAM role doesn’t have enough permissions to fetch the account alias, it isn’t added.
To enable the collection and addition of the account_alias label in all collected metrics, add the iam:ListAccountAliases permission to the IAM Policy used by Grafana.
You can check if the account_alias label is present by running the following query:
group({__name__=~"aws.+"}) by (account_alias)
