Respond to alerts
Respond to and troubleshoot alerts about your infrastructure and the applications running within it without leaving the context of Grafana Kubernetes Monitoring.
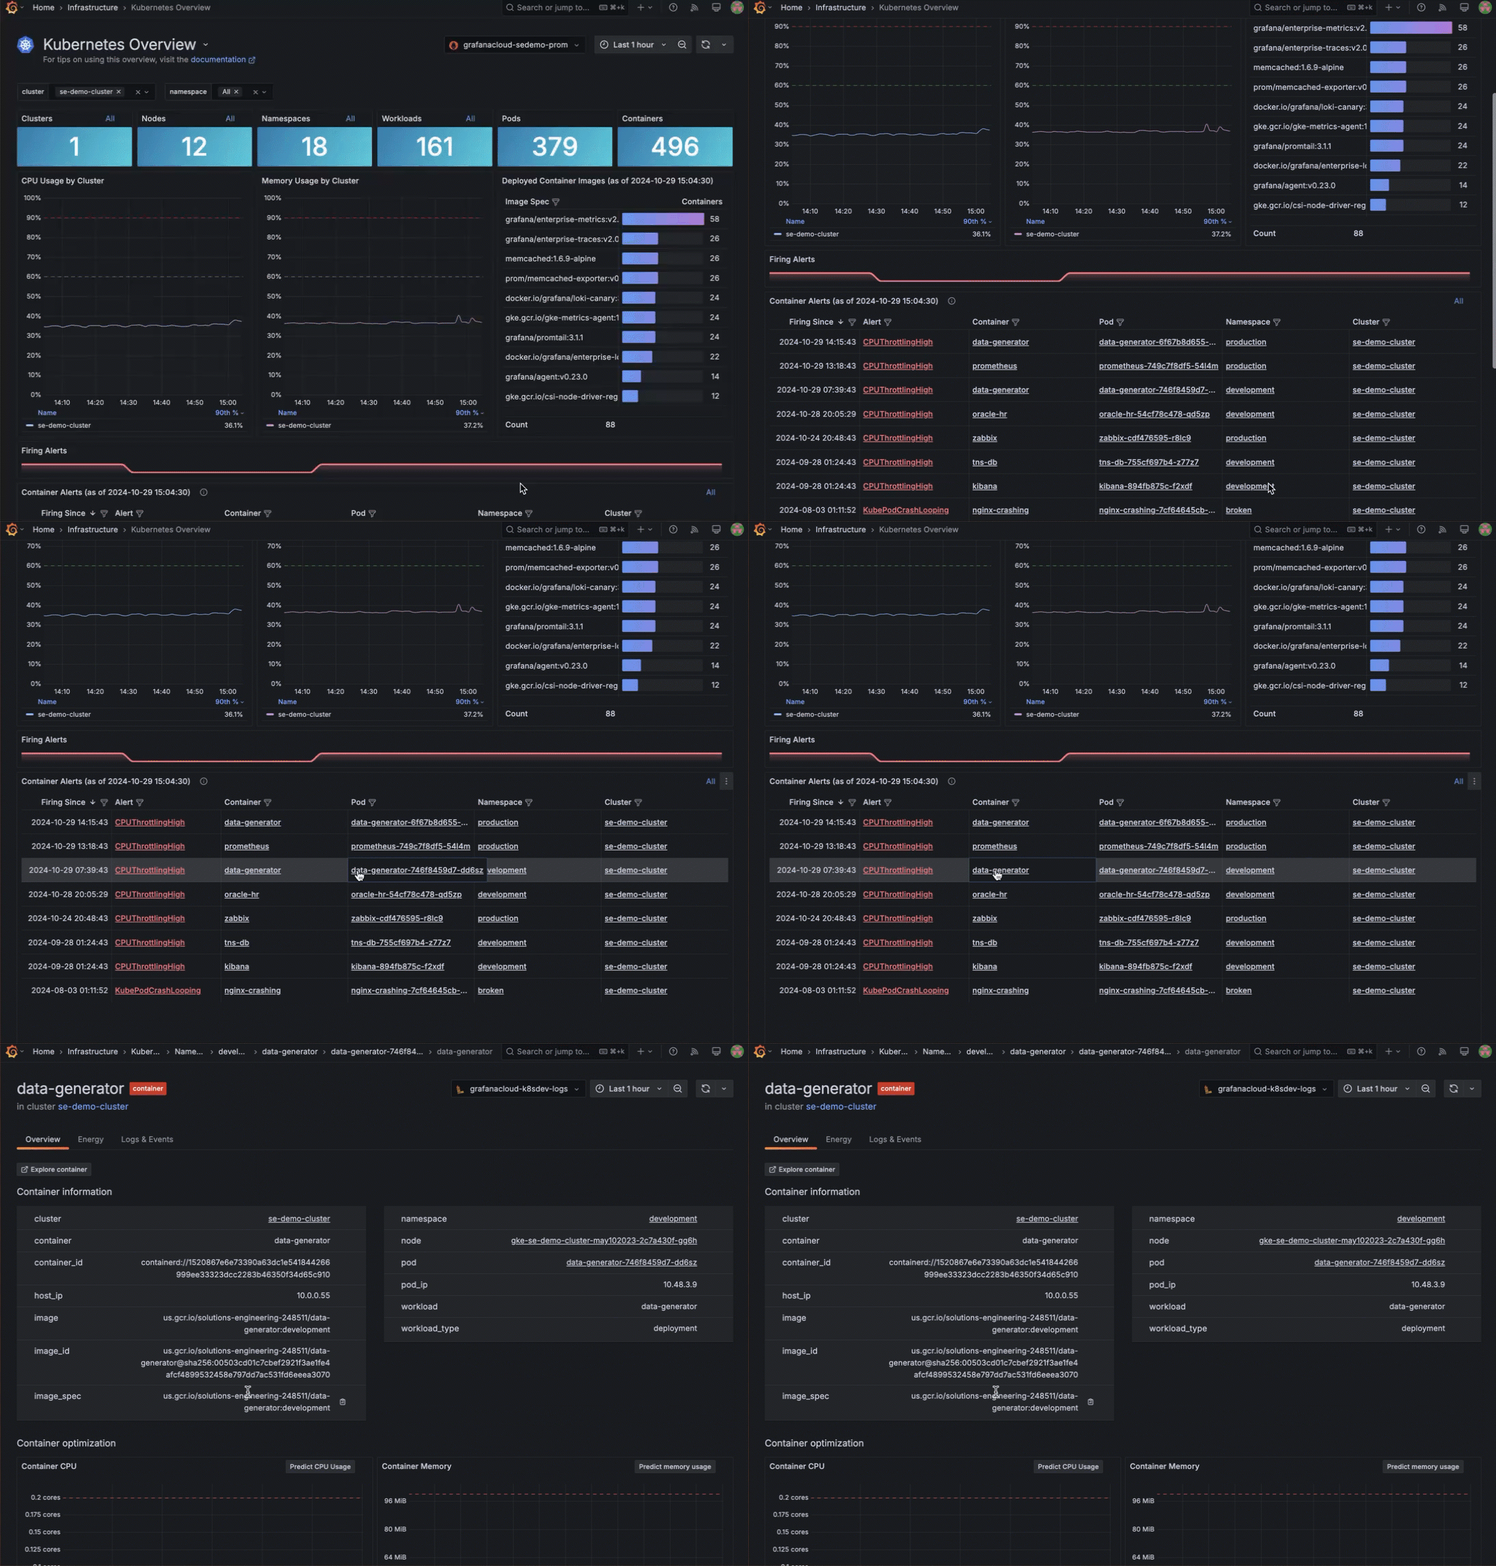
Start from snapshot on home page
Within the alerts section of the Kubernetes Overview page, two panels show container and Pod alerts. You can click directly into the container or Pod to continue your troubleshooting and problem solving.
Start from Alerts page
The Alerts page in Kubernetes Monitoring displays all alerts related exclusively to your Kubernetes infrastructure and any applications within your infrastructure. The graphs at the top of the page show the alerts by Cluster and namespace, as well as the alert severity rating.
Use filtering to look at one Cluster or namespace, or a severity rating.
The list of Firing Alerts reflects the filters at the top of the page. Additionally, you can filter further within the list to isolate a Cluster, namespace, workload, Pod, or container.
With one click, you can open the alert rule itself, or the details page for the Cluster, namespace, workload, Pod, or container.
Note
If you open the alert rule, the page loads in a another tab.
Use the runbooks
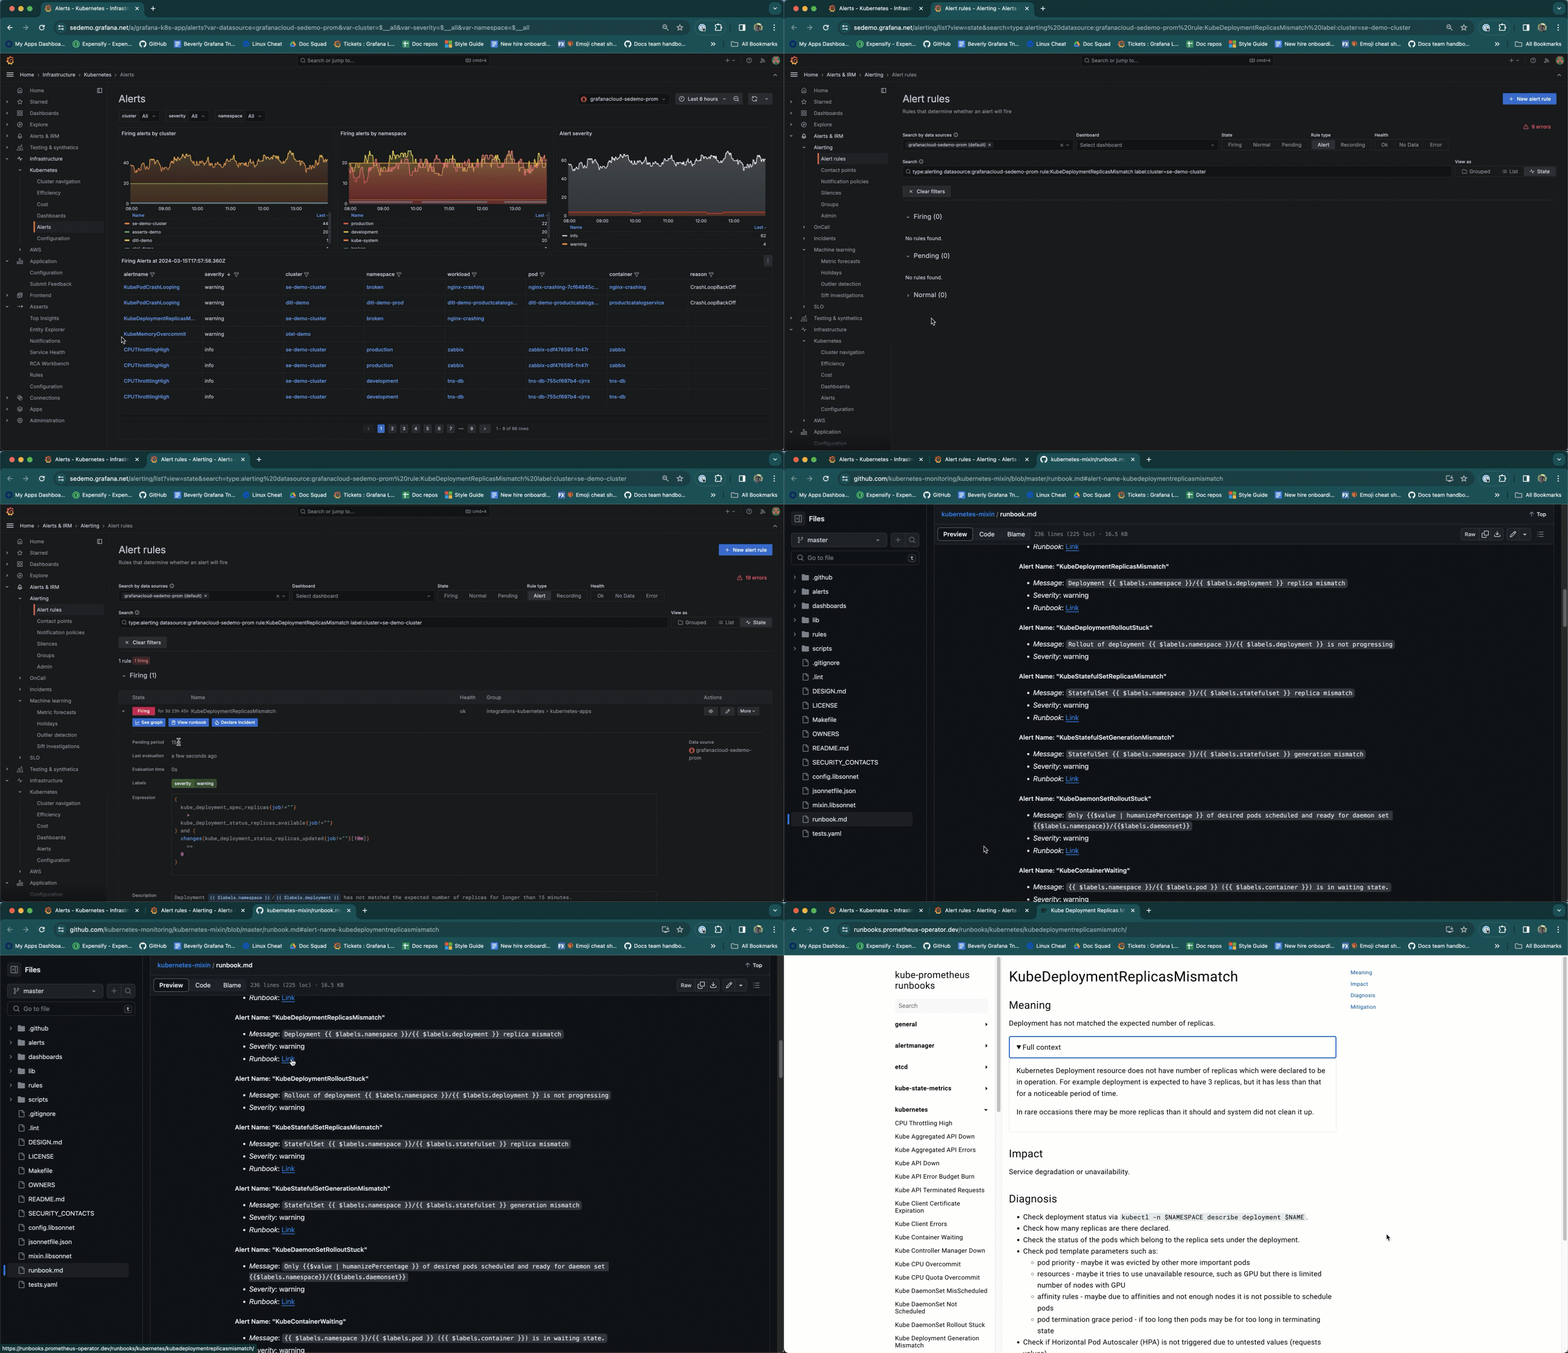
From the Alerts page or the Kubernetes Overview page, click the alert name to navigate to the runbook for more information.
- Click the name of the alert to open the Alert rules page for that alert.
- Expand the Firing state.
- Click View runbook to open to the alert in the kubernetes-mixin.
- Click Link to view the specific runbook at kube-prometheus runbooks.
![Navigating to the runbook Navigating to the runbook]()
Navigating to the runbook
Manage alerts
Preconfigured alerting rules are available out of the box.
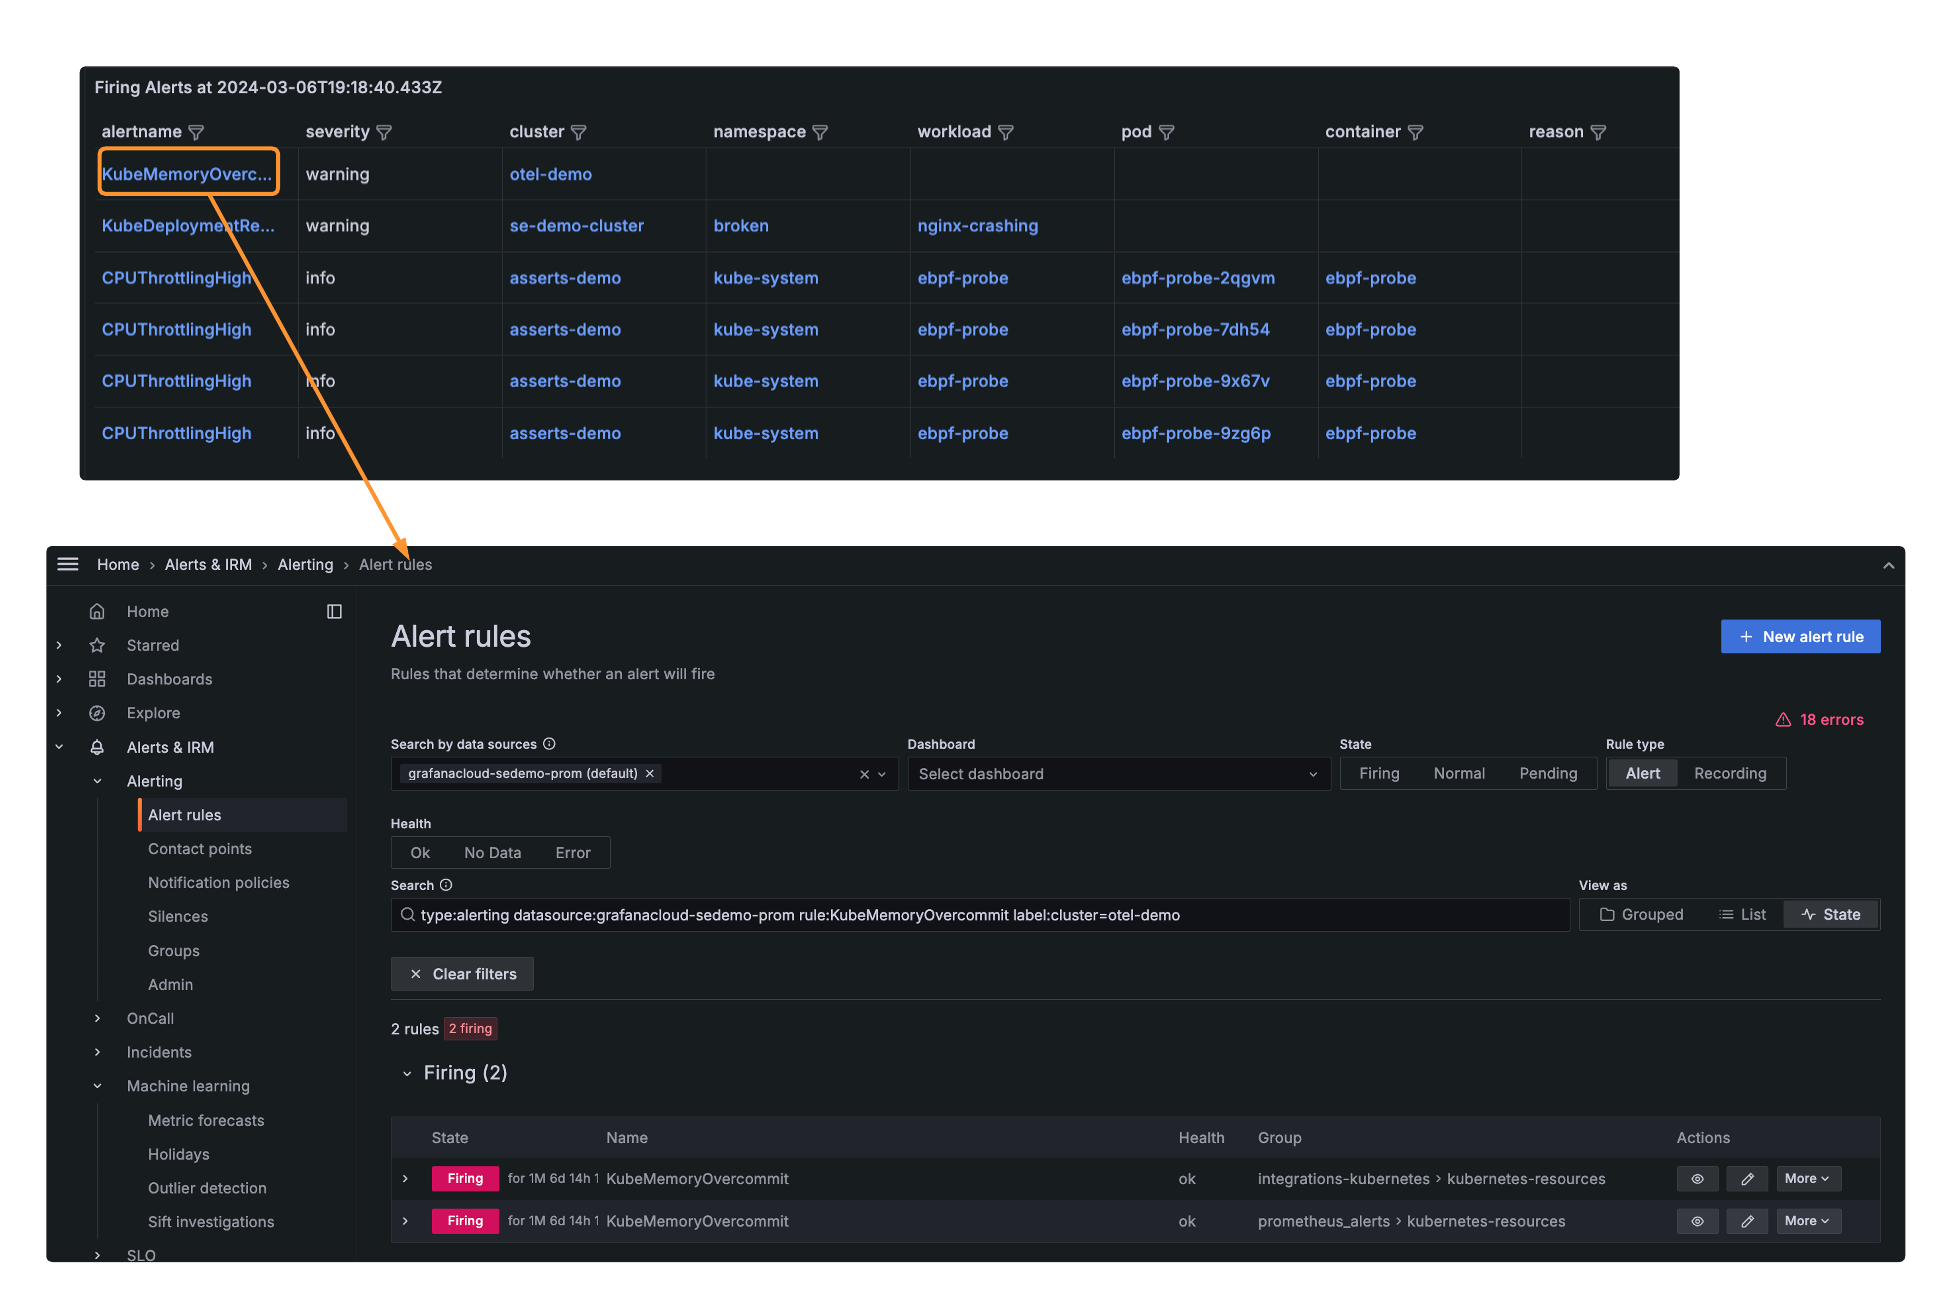
There are two ways to open an alert rule to open the Alert page in a new browser tab:
- In the Alerts page in the list of Firing Alerts, click the name of the alert.
![Opening alert rule from Alerts page Opening alert rule from Alerts page]()
Opening alert rule from Alerts page - In a Cluster, namespace, Node, Pod, or container list, click the underlined number next to the list item.
![Opening alert rule from list item Opening alert rule from list item]()
Opening alert rule from list item
For details on alert rules, refer to Configure alerting.
You can silence some default alerts temporarily as a useful strategy when you are investigating alerts.
Copy a preconfigured alert
While you cannot alter the preconfigured alerts that are available in Kubernetes Monitoring, you can copy them and customize them. This can be helpful when troubleshooting. For example, you may want to know whether an existing state that’s causing an alert to fire is temporary or a longer term problem. To copy an alert:
- Click the name of the alert on the Alerts page to open the alert rule in a new tab .
- On the Alert rules, expand the Firing section.
- Under Actions, click More, and select Duplicate.
![Selecting **Duplicate** to copy an alert Selecting **Duplicate** to copy an alert]()
Selecting Duplicate to copy an alert - On the New alert rule page, follow the steps to create and configure the rule.
Create an alert
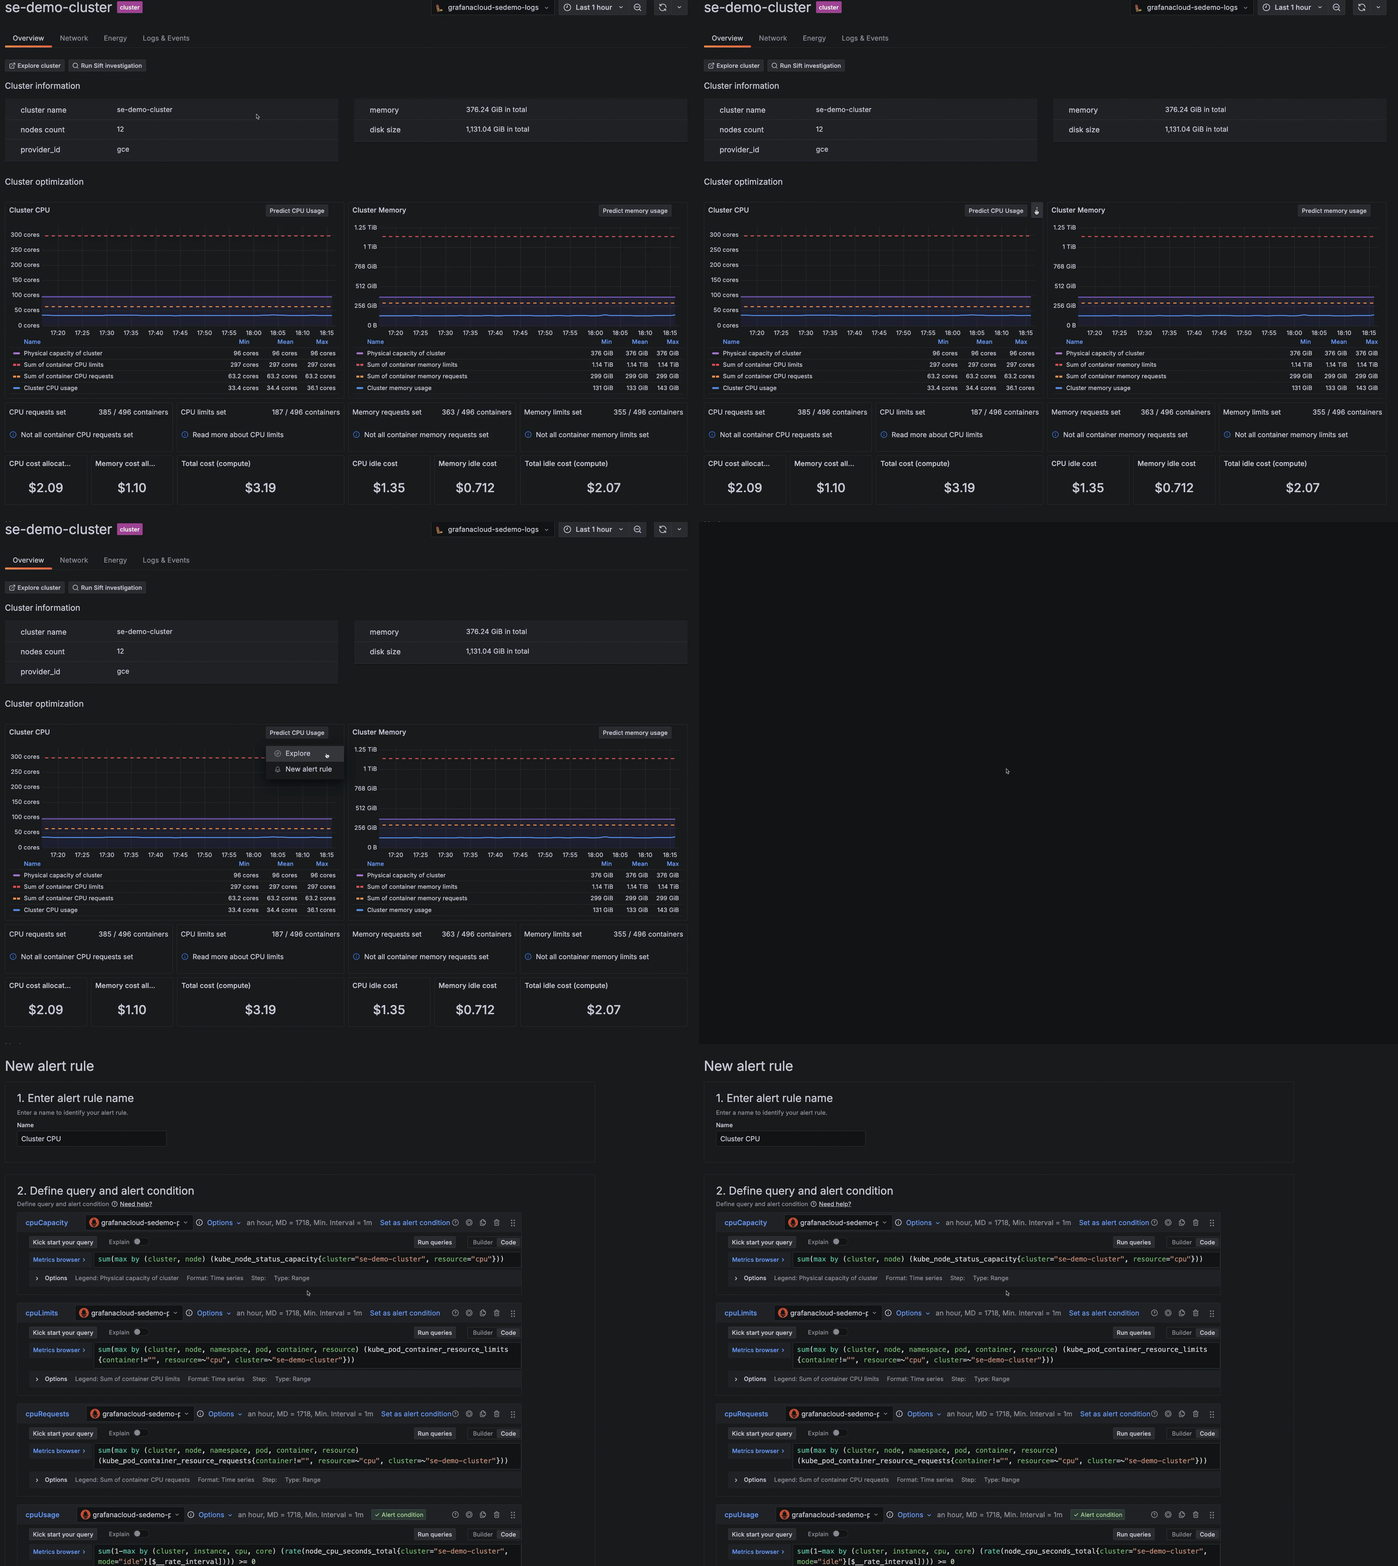
If you are an administrator of your Grafana Cloud stack, you can create a new alert from panels throughout Kubernetes Monitoring. To do so, complete the following steps:
- Navigate to any CPU or Memory panel and click the menu icon.
- Select New alert rule.
- On the New alert rule page, follow the steps to configure the rule.
![Creating a new alert from a panel menu Creating a new alert from a panel menu]()
Creating a new alert from a panel menu


