Manage costs
To manage the cost of cloud resources that your Kubernetes infrastructure is consuming, you need insight into the costs generated throughout your Clusters. Kubernetes Monitoring uses an OpenCost integration along with Grafana’s experience in managing Kubernetes-related costs to calculate cost data. OpenCost uses information about your Kubernetes components to provide metrics that measure infrastructure costs in real time.
You can use cost information to make data-driven decisions about resource allocation, scaling strategies, and technology investments. Out of the box, you can:
- Observe cost per resource and infrastructure type.
- View historical and projected costs.
- Identify savings you could achieve by removing or reducing unused CPU, RAM, or storage.
- Learn the costs of network egress and GPU.
- Compare savings and costs trends.
Cost overview
Click Cost on the main menu to view an Overview tab and a Savings tab.
Overview tab
The Overview tab includes:
- Filtering by Cluster
- Panels that offer a 90-day view of total compute cost, average cost per Pod, and average Pod count. The 90-day period is divided into:
- 30 days prior to the last 30 day time period
- The last 30 days from the current date
- An estimate of the next 30 days from the current date
- The cost (calculated within the selected time range) of:
- Each cloud service provider you are using along with the total cost of all providers
- A 30-day projected cost of idle CPU cores
- The percentage of unclaimed Persistent Volumes
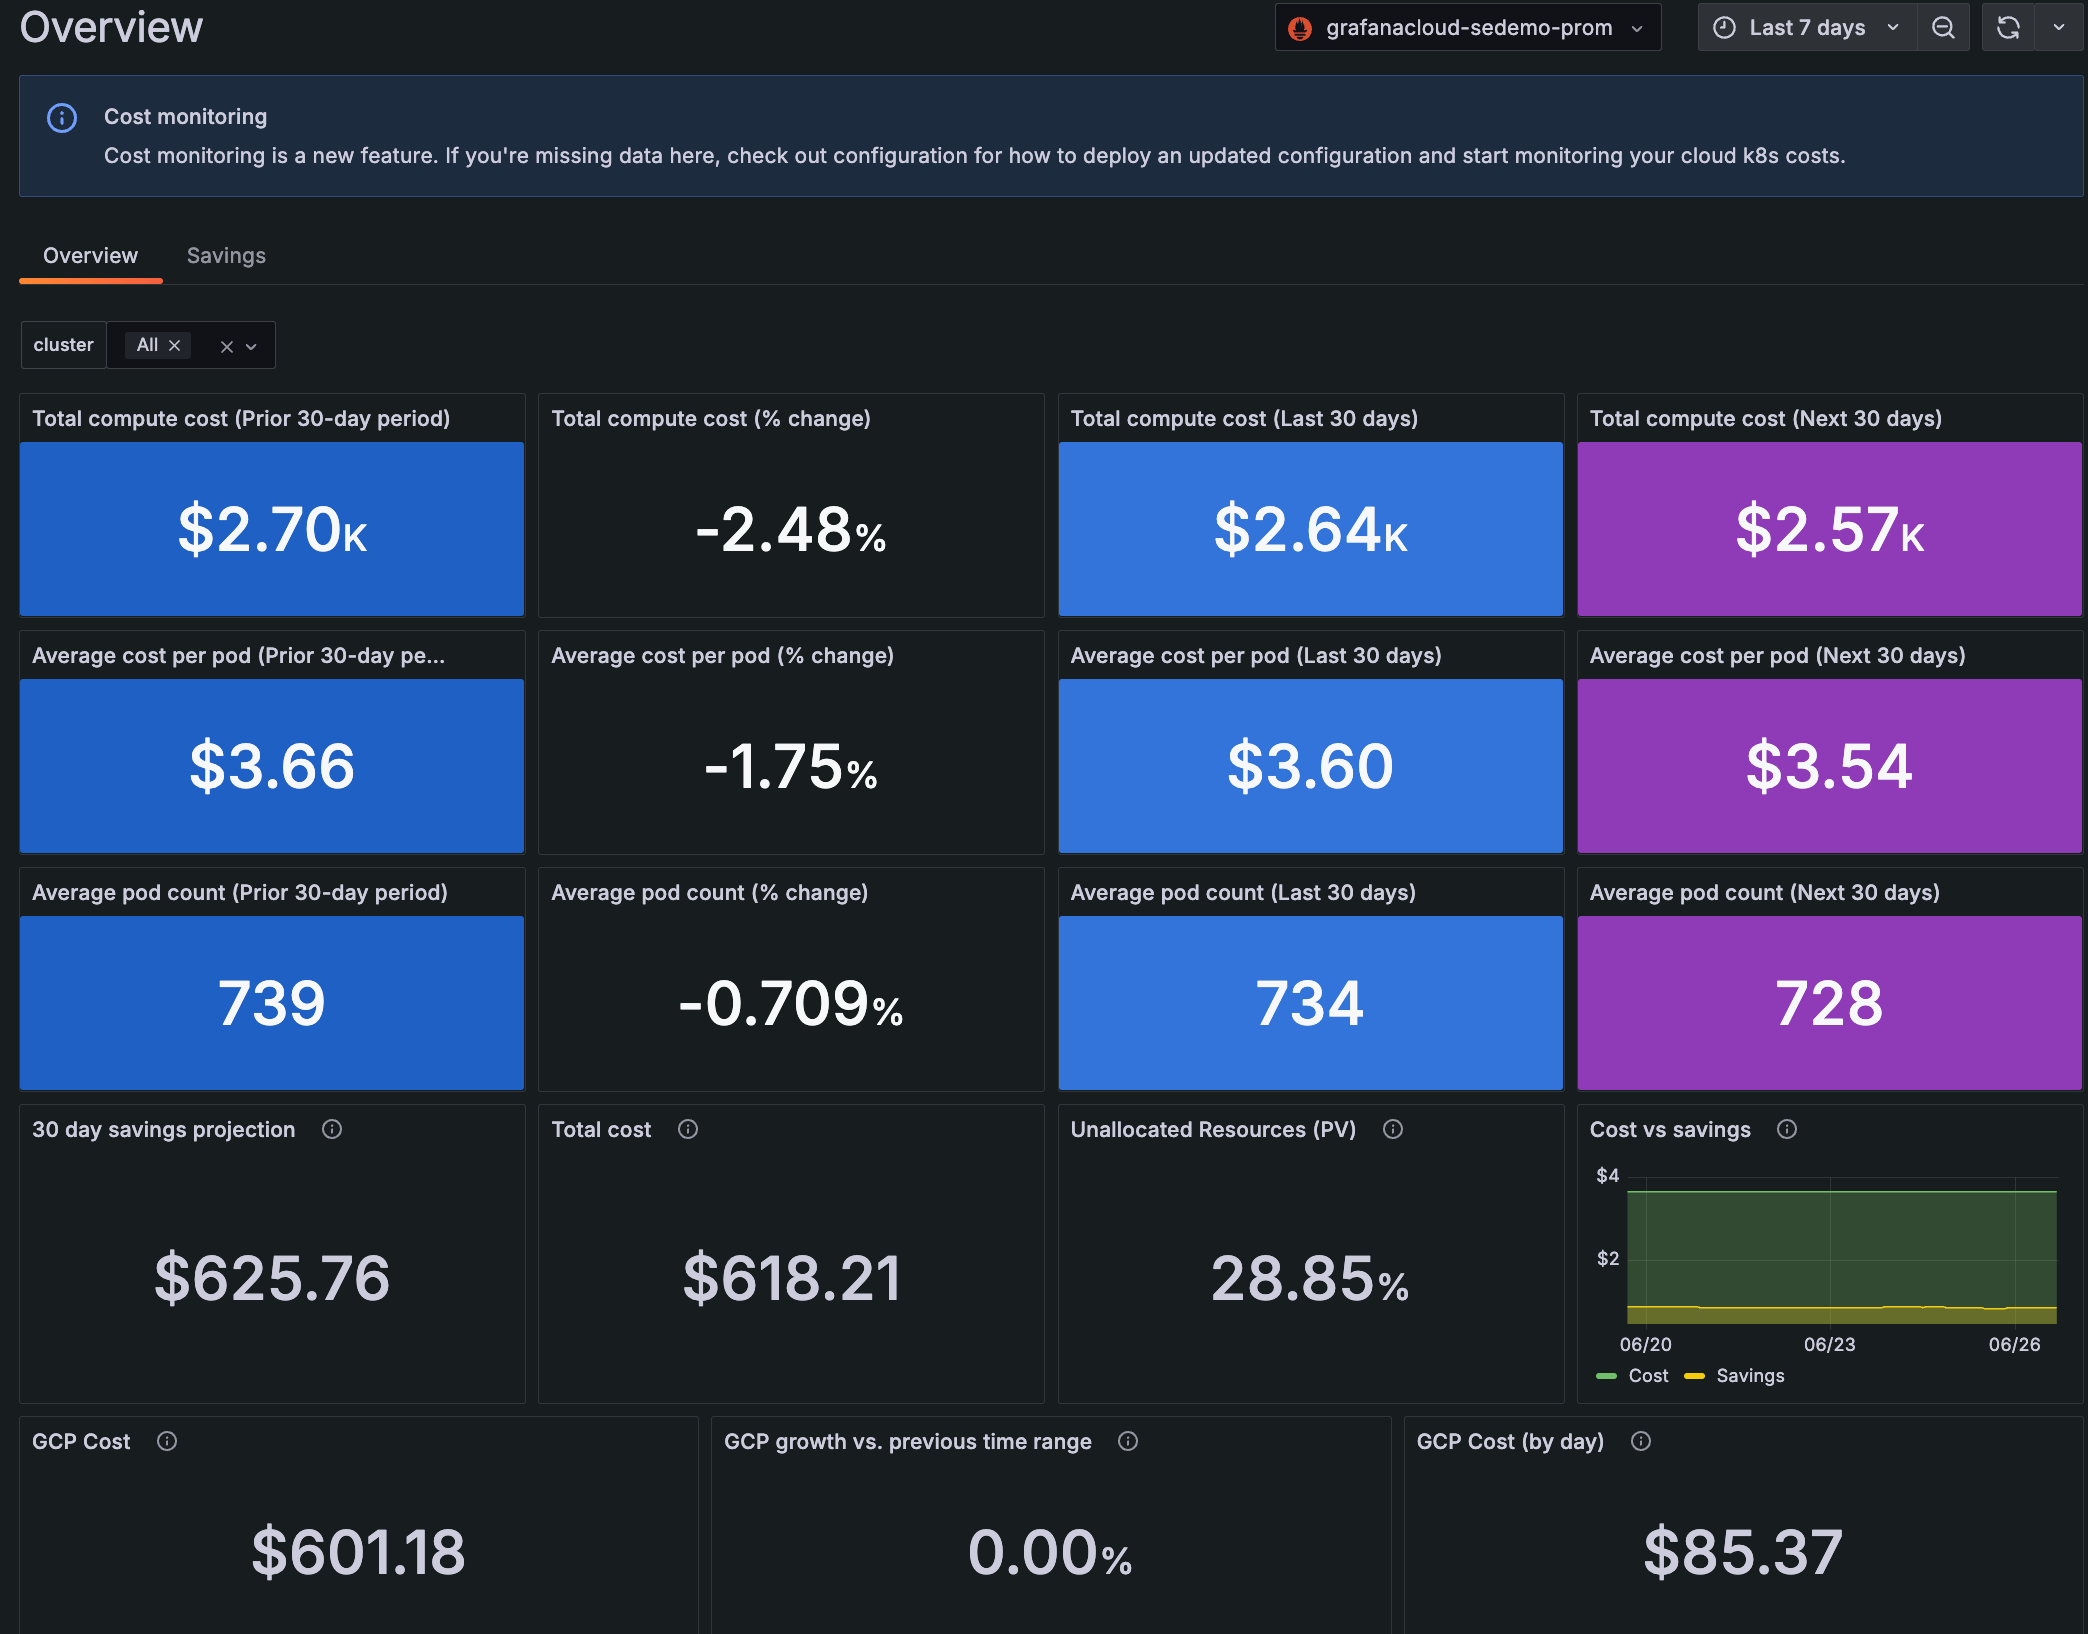
With Grafana Play, you can explore and see how it works, learning from practical examples to accelerate your development. This feature can be seen on the Cost Overview tab.
Savings tab
The Savings tab shows cost compared to savings for CPU, RAM, storage, and GPU if unused resources had been deprovisioned within the selected time range. This page also provides the cost of network egress.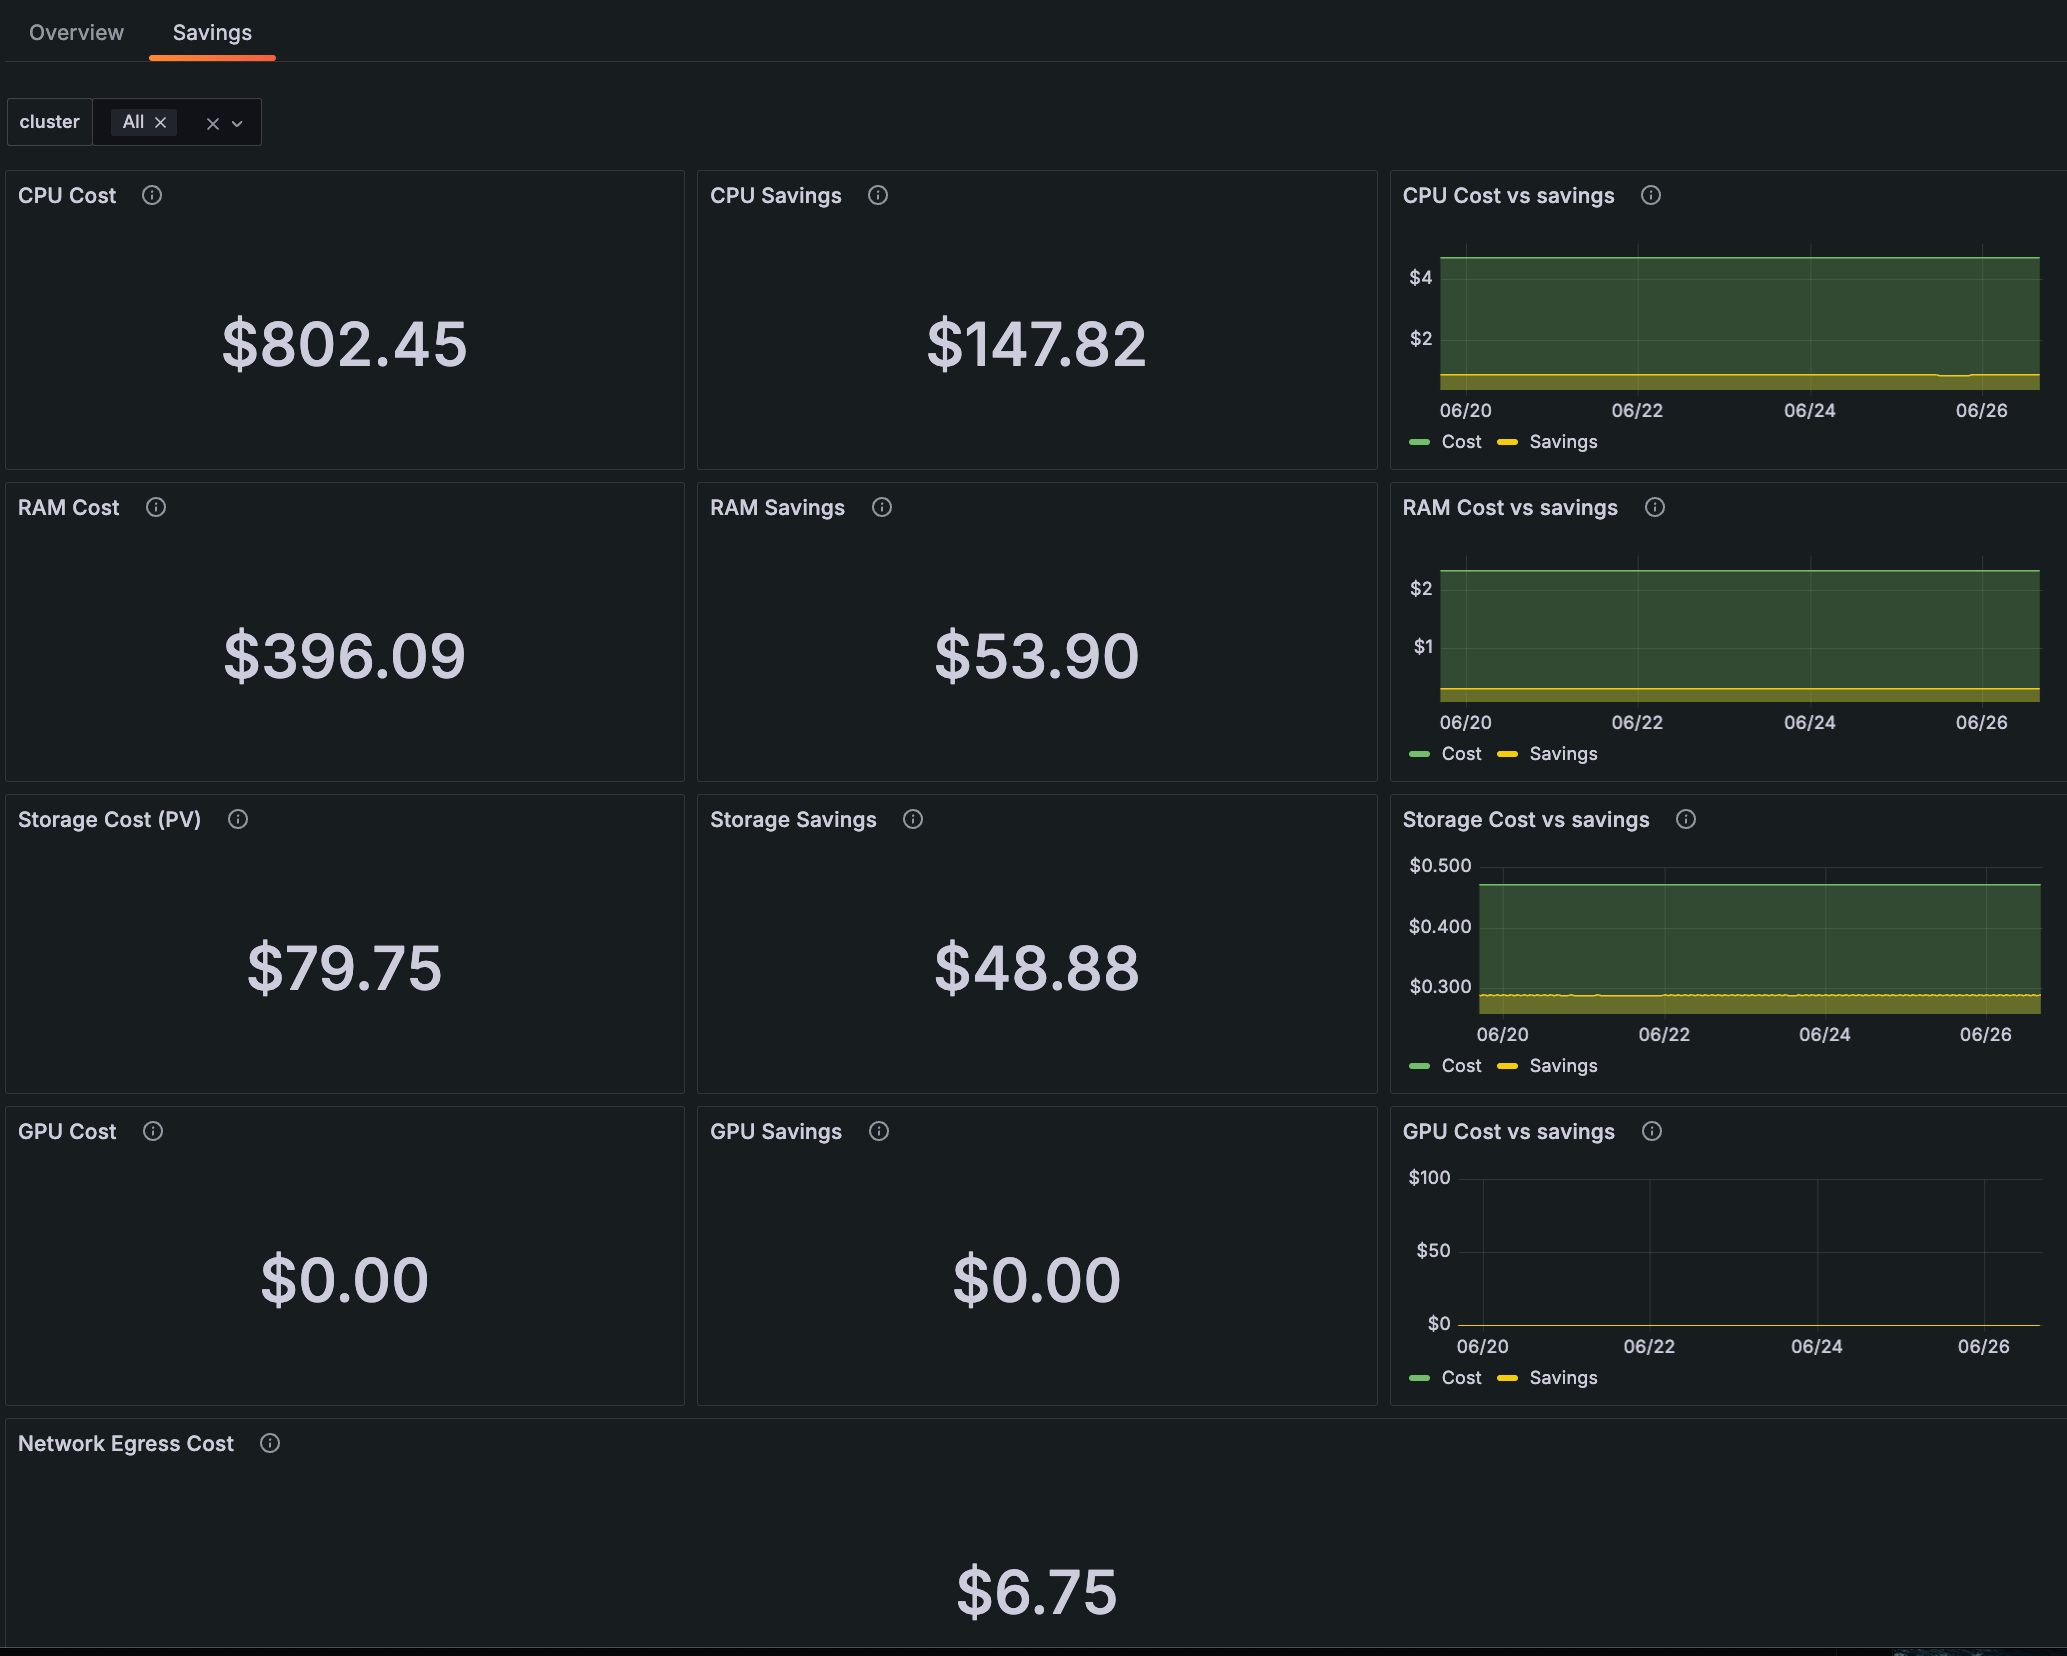
Cost data at every level
In the list view on any page, select Cost to see the estimated cost data and analyze costs.
Start a cost analysis flow
This example shows how you can start out your investigation on any list page.
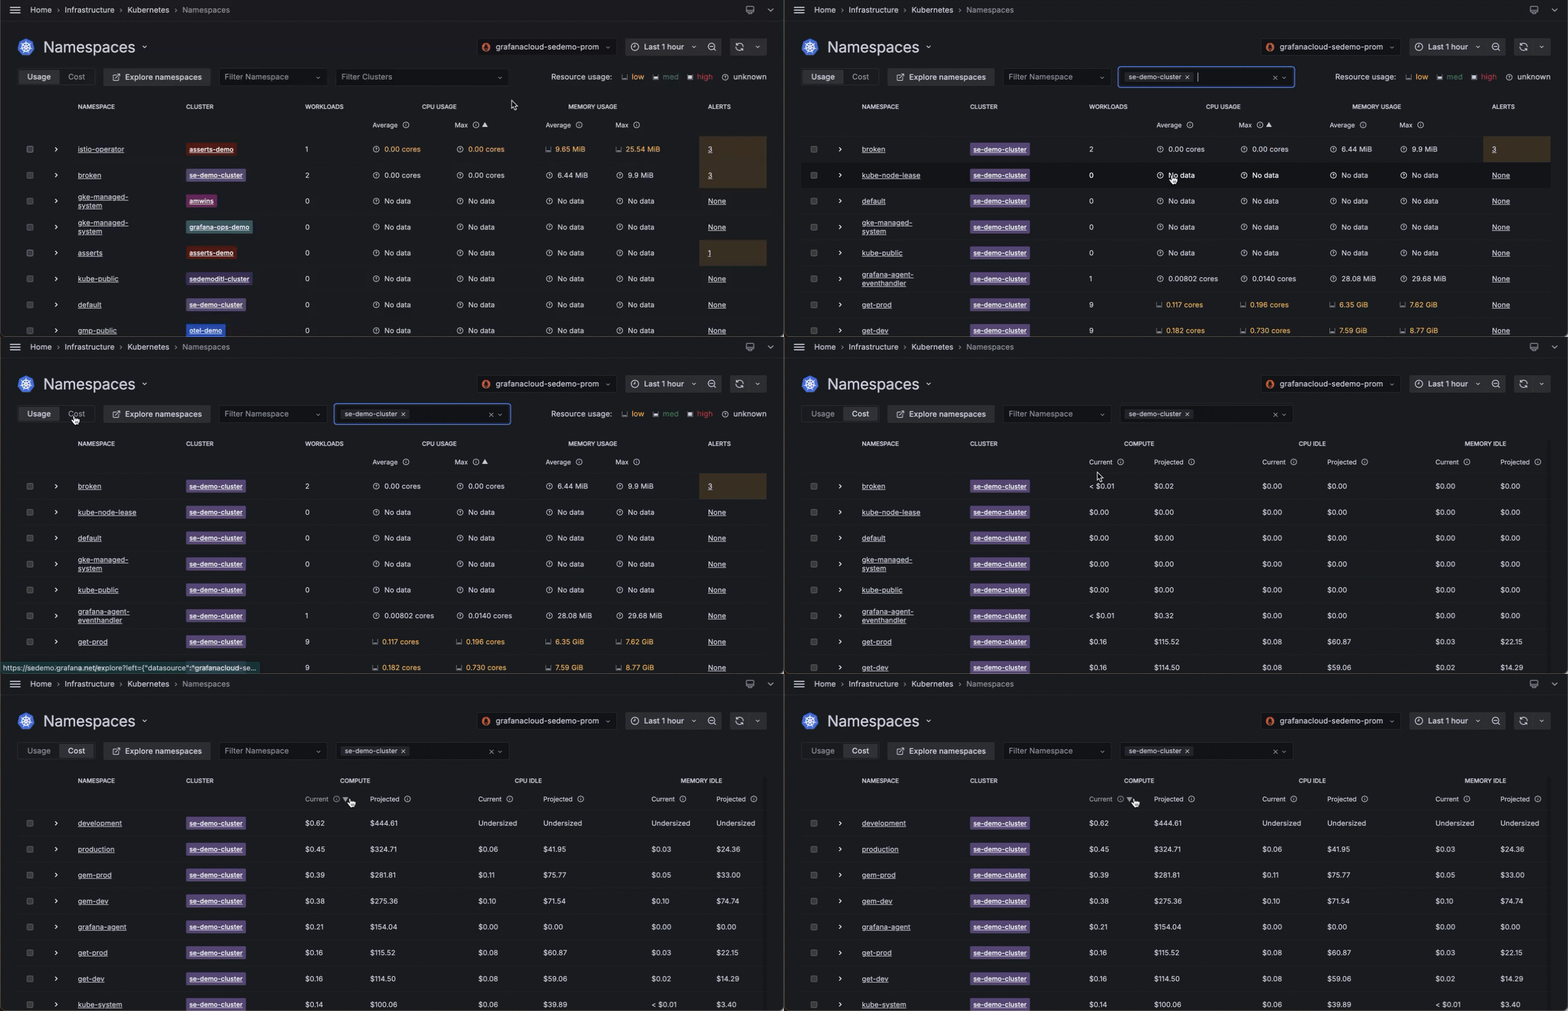
- Navigate to the Namespaces list page.
- Filter for the Cluster you want to view.
- Switch to the cost view.
- Sort the list for the highest current cost.
![Filtering by Cluster and sorting namespaces for the highest cost Filtering by Cluster and sorting namespaces for the highest cost]()
Filtering by Cluster and sorting namespaces for the highest cost - Click the namespace with the highest idle cost.
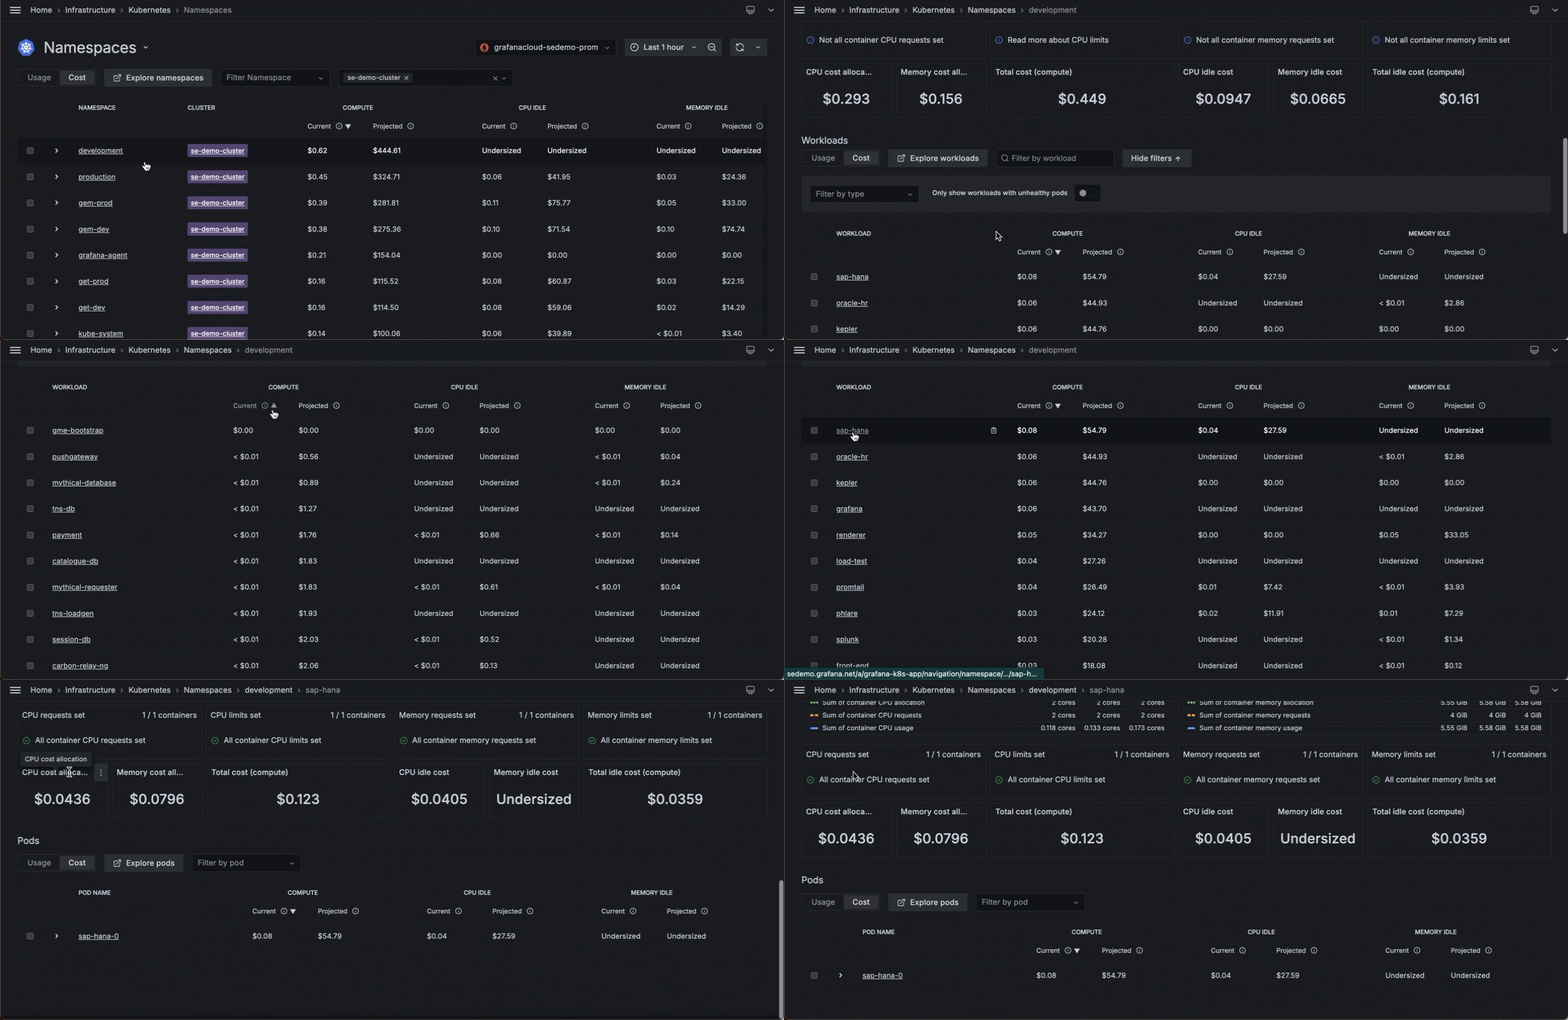
- At the namespace detail page, scroll down to the list of workloads in this namespace and sort the list for the highest compute cost.
- Click the workload with the highest cost.
- At the workloads detail page, scroll down to the list of Pods in the workload.
![Scrolling to the list of workloads in the Pod to find the one with the highest cost Scrolling to the list of workloads in the Pod to find the one with the highest cost]()
Scrolling to the list of workloads in the Pod to find the one with the highest cost - You can continue this pattern by clicking the Pod with the highest cost, clicking that Pod, and continuing your analysis.
With Grafana Play, you can explore and see how it works, learning from practical examples to accelerate your development. This feature can be seen on this workloads list.
Use cost monitoring strategically
Here are some strategies you can use to manage the costs of your Kubernetes infrastructure.
View cost over 90-day span
On the Cost Overview tab, review the total compute cost and average cost per Pod based on the Cluster filter.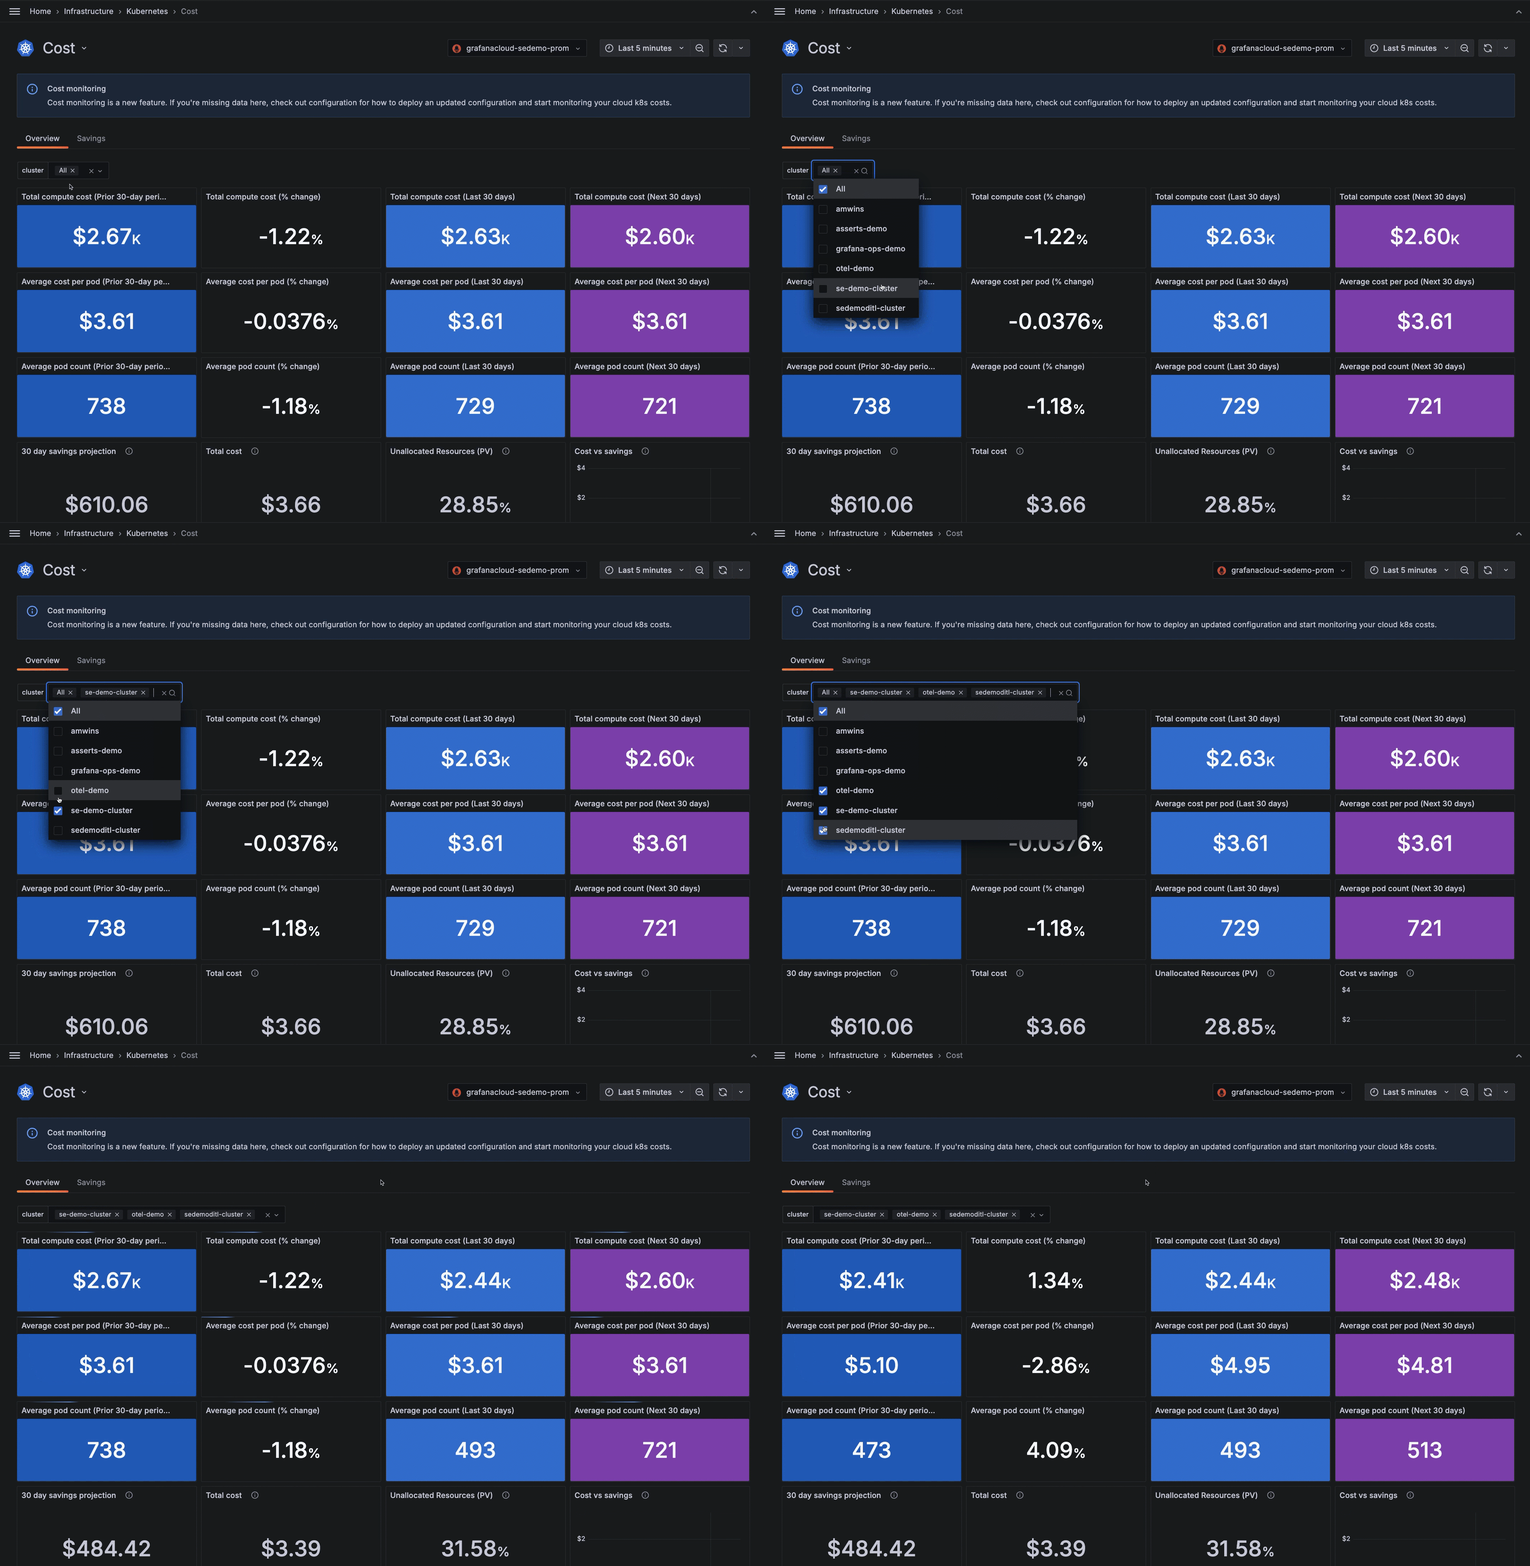
Examine historical costs
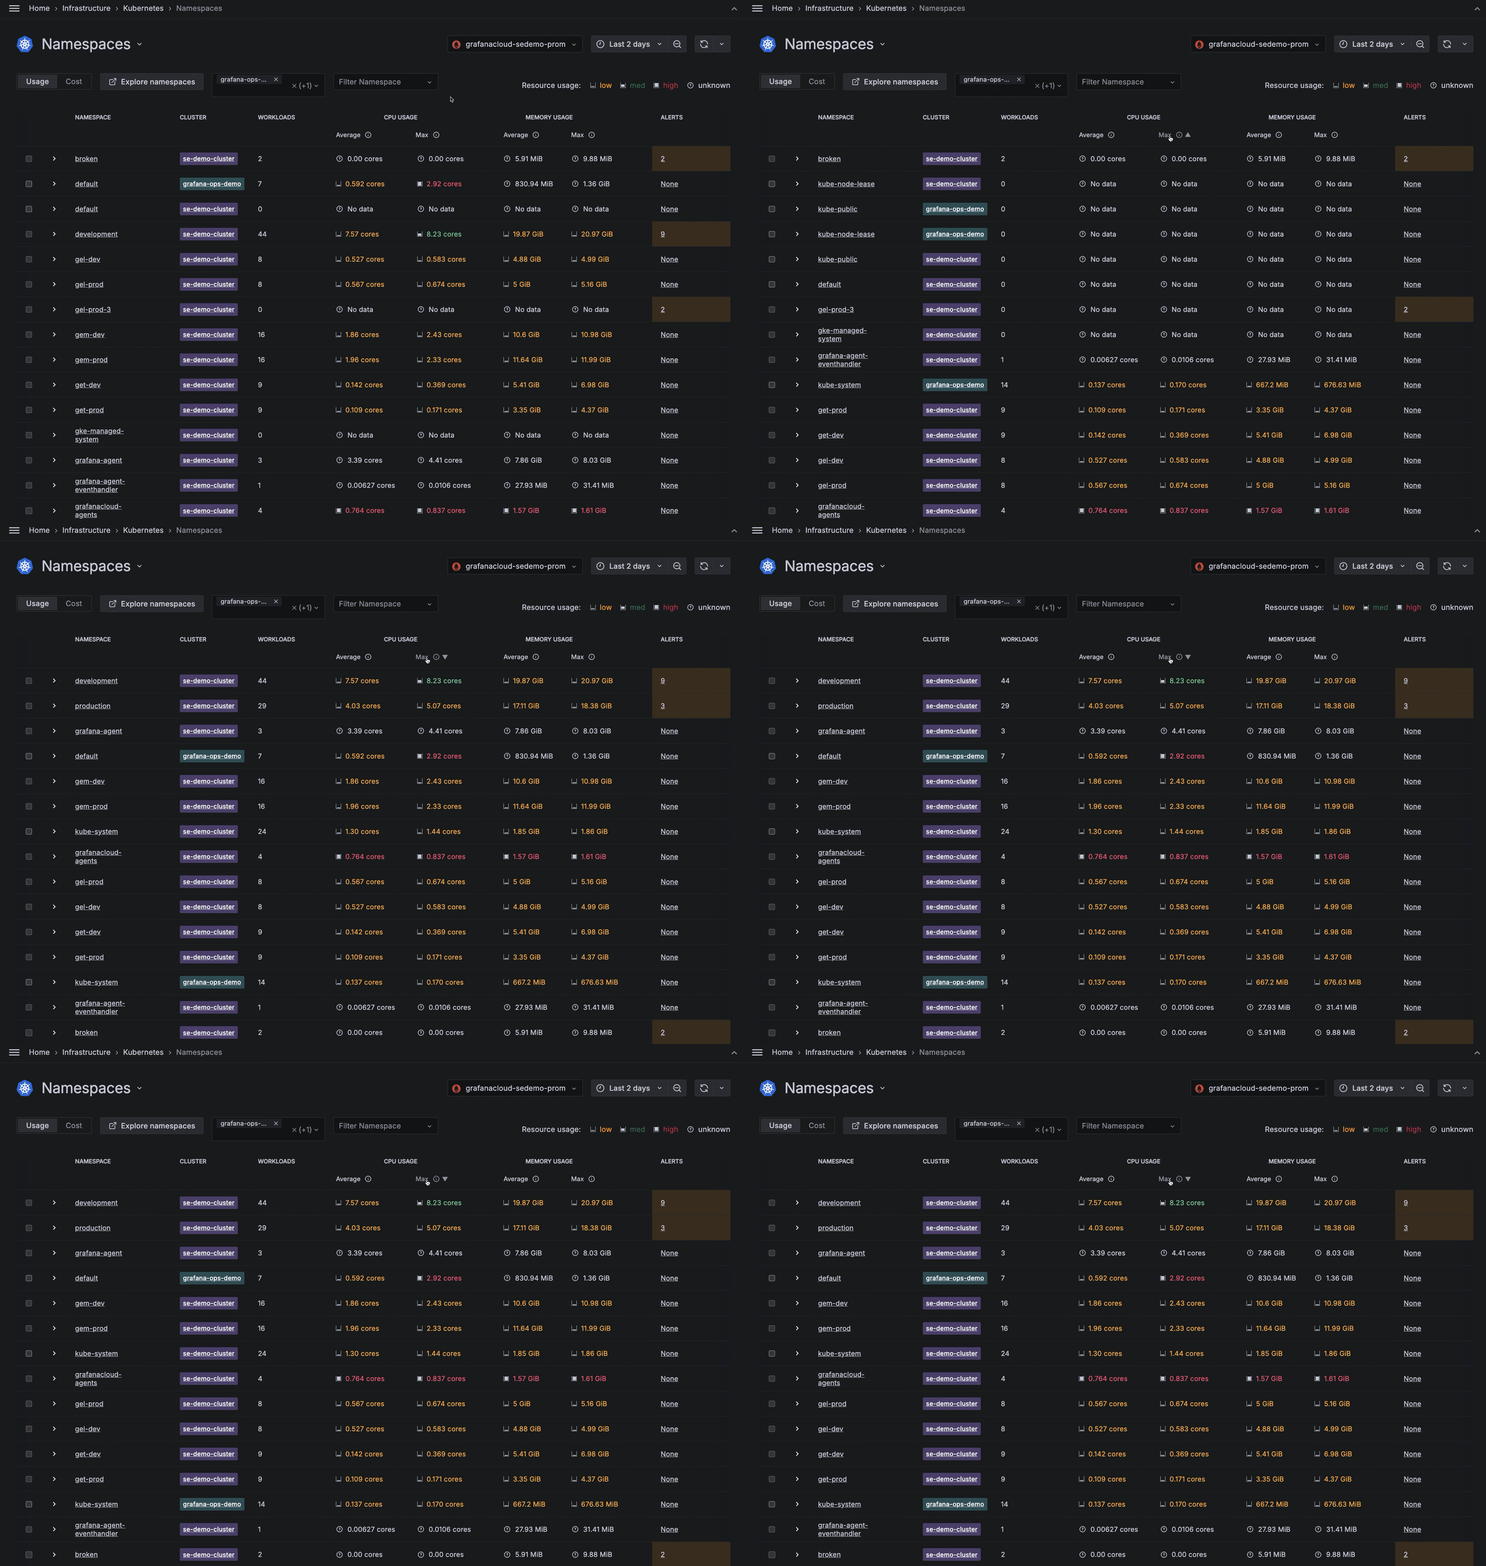
Examine costs over a time period for any list view:
- Use the time range selector to set a time range.
- Analyze the costs of CPU and memory usage.
![Sorting namespaces for highest CPU usage over two-day span Sorting namespaces for highest CPU usage over two-day span]()
Sorting namespaces for highest CPU usage over two-day span
Look at projected costs
Use the 30-day projected cost of any resource to prioritize where you might make adjustments and save.
Optimize resource usage
Costs can be affected by incorrectly configured CPU and memory requests and limits on containers. For more details, refer to:
Verify scaling
Assess the cost implications of scaling resources by using Kubernetes autoscaling mechanisms. With horizontal and vertical autoscalers, you can dynamically adjust resource allocation based on demand. Then verify your adjustments are reducing costs by using Kubernetes Monitoring to compare the past and present resource allocation.
Refine and monitor practices and policies
Establish cost governance practices and policies based on the cost data available in Kubernetes Monitoring.
Refine cost estimates
Costs shown in Kubernetes Monitoring are estimates of your infrastructure costs based on the node type, size, region, and public pricing lists. However, the default pricing doesn’t include cost adjustments that you receive from the vendor, such as discounts. To further refine the estimate to include any negotiated pricing that is specific to your account, visit these vendor links for instructions:
- AWS
- Azure
- GCP
- Enable the Cloud Billing API.
- Create an API key, and optionally edit the key and restrict to the Cloud Billing API.
- Edit the OpenCost Deployment on the Kubernetes Cluster, and set the
CLOUD_PROVIDER_API_KEYto the newly created API key.
Customize cost estimates
If you use a Cluster provider other than the top three vendors, you can configure custom pricing using the OpenCost Helm chart.
Configure or upgrade
Cost monitoring is a choice you can switch on or off when you configure with Grafana Kubernetes Monitoring Helm chart. If you have already deployed Kubernetes Monitoring using Agent or Agent Operator, follow the instructions to upgrade Kubernetes Monitoring.
How costs are calculated
The cost columns are calculated based on the time range selected and a 30-day projection.
- Current compute: The cost of allocated compute (CPU and memory) for the time range selected
- Projected compute: The cost of allocated compute (CPU and memory) if it remains the same for the next 30 days
- Current CPU idle: The cost of the CPU idleness for the time range selected
- Projected CPU idle: The cost of CPU idleness if it remains at the same level for the next 30 days
- Current memory idle: The cost of the memory idleness for the time range selected
- Projected memory idle: The cost of memory idleness if it remains at the same level for the next 30 days
Keep in mind that cost calculations depend on the type of object within Kubernetes. For example, some objects have a known cost, while the cost of others are derived from a calculation.
Known cost of Nodes and Clusters
Cloud provider costs are gathered per Node, so each Node (and therefore each Cluster) has a known cost. OpenCost estimates what proportion of the total Node cost can be associated with CPU and memory.
Allocated cost
For the cost of any resource not at the Node or Cluster level (containers, Pods, namespaces, and workloads), Kubernetes Monitoring uses an allocation algorithm in combination with OpenCost hourly cost estimates for CPU and memory proportional costs.
Allocation is derived by taking the greater amount of either the actual usage or the requested amount. The sum of the CPU and memory allocation in each hour is multiplied by the hourly CPU and memory cost, which is estimated by OpenCost.
Idle costs
For Nodes and Clusters, idle cost is calculated by the difference between usage and physical capacity. For resources not at the Node or Cluster level, idle cost is calculated by the difference between usage and requests. Requests act as reserved resources, so unused requests can’t be used by other objects in Kubernetes.
Comparison with vendor costs
If you want to compare the vendor costs with the cost estimates in Kubernetes Monitoring, it’s best to compare at the Node or Cluster level.
Cardinality with OpenCost
To understand the impact of using OpenCost on cardinality, refer to Available Prometheus Metrics for OpenCost.

