Troubleshoot Kubernetes Monitoring
This section includes common errors encountered while installing and configuring Kubernetes Monitoring components and tools you can use to troubleshoot.
Duplicate metrics
Certain metric data sources (such as Node Exporter or kube-state-metrics) may already exist on the Cluster. When you deployed with the Kubernetes Monitoring Helm chart, these data sources are installed even if they were already present on your Cluster.
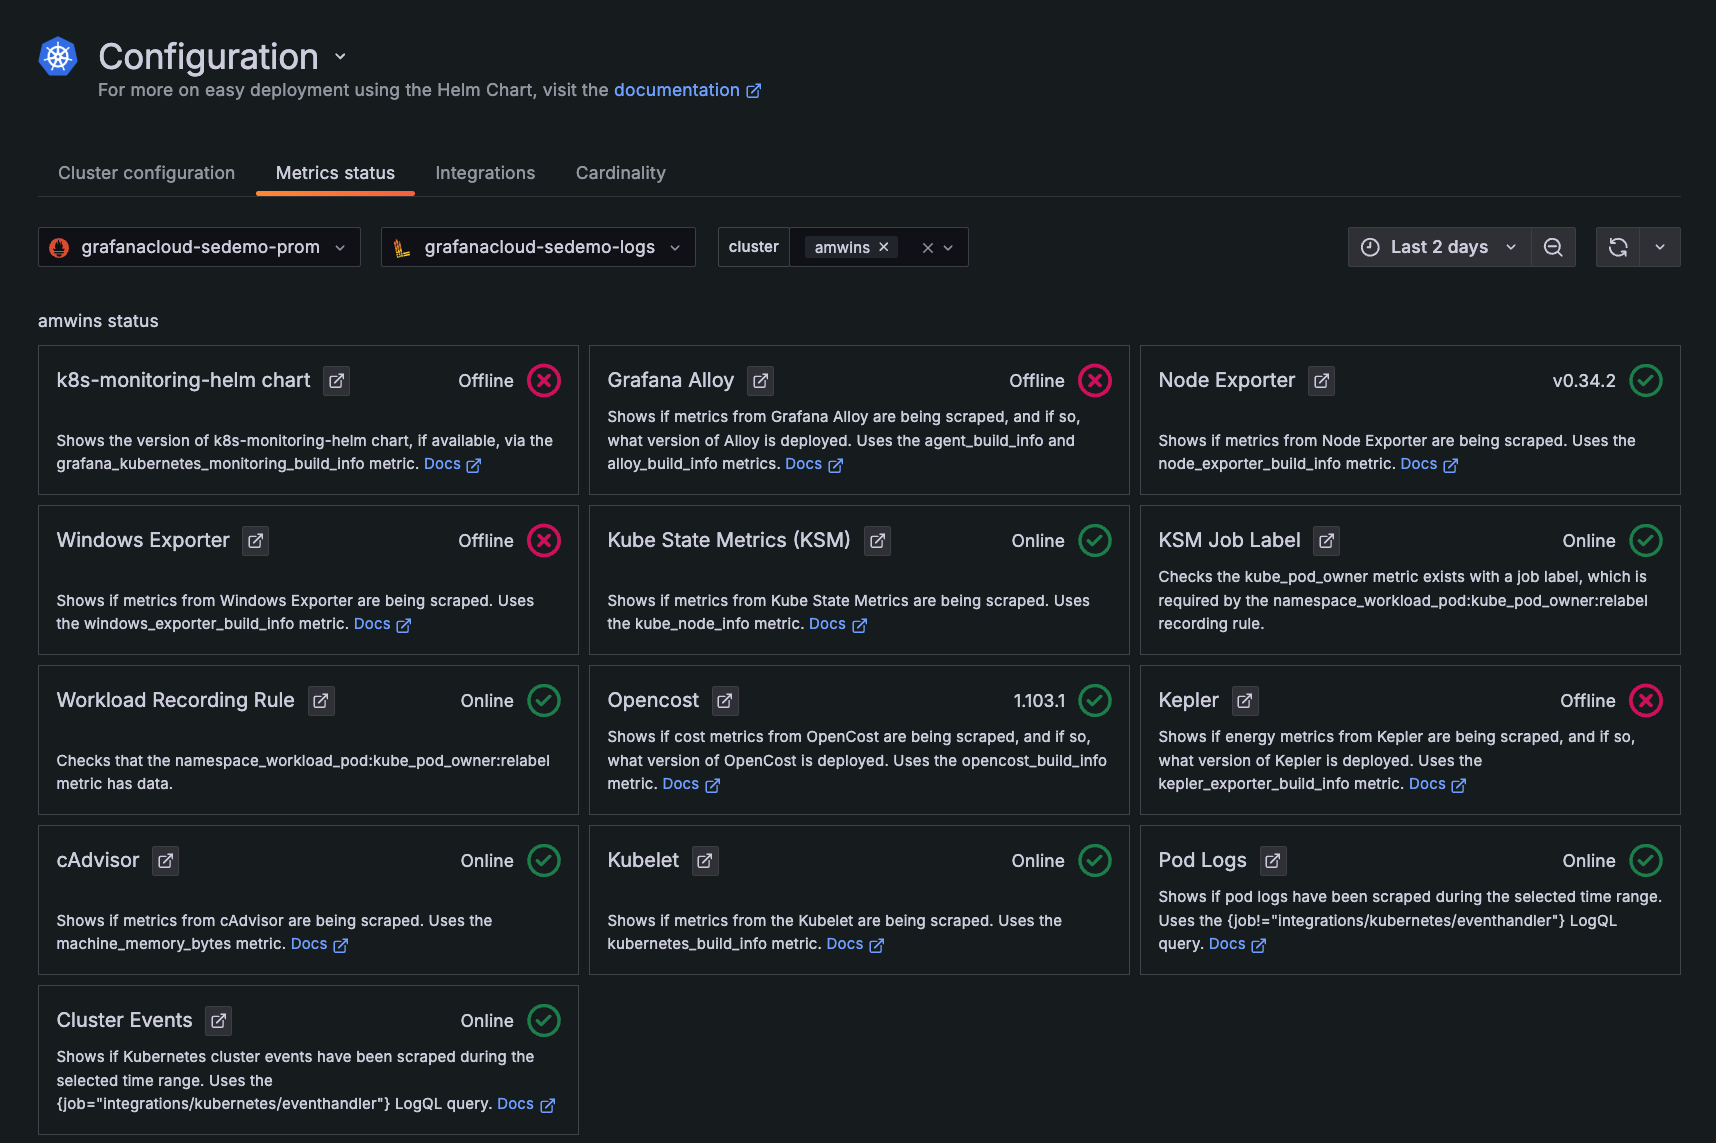
- Visit the Metrics status tab to view any duplicates.
- Remove the duplicates or adjust the Helm chart values to use the existing ones and skip deploying another instance.
Missing data
Here are some tips for missing data.
CPU usage panels missing data
If there is no CPU usage data, the data scraping intervals of the collector and the data source may not match. The default scraping interval for Grafana Alloy is 60 seconds. If the scraping interval for your data source is not 60 seconds, this mismatch may interfere with the calculation for CPU rate of usage.
To resolve, synchronize the scraping interval for the collector and data source.
- If you configured the data source (meaning it wasn’t automatically provisioned by Grafana Cloud), change the scrape interval for the data source to match the collector.
- If the data source was provisioned for you by Grafana Cloud, contact support to request the scrape interval for the data source be changed to match the collector.
Data missing in a panel
If a panel in Kubernetes Monitoring seems to be missing data or shows a “No data” message, open the query for the panel in Explore to determine which query is failing.
This can occur when new features are released. For example, if you see no data in the network bandwidth and saturation panels, it is likely you need to upgrade to the newest version of the Helm chart.
Data missing for a provider
If your cloud service provider name is not showing up in the Cluster list page, it’s likely due to a provider_id missing from some types of Clusters. This occurs in the case of an internal provider or bare metal Clusters. To ensure your provider shows up, create a relabeling rule for the provider.
metrics:
kube-state-metrics:
  extraMetricRelabelingRules: |-
    rule {
      source_labels = ["__name__", "provider_id", "node"]
      separator = "@"
      regex = "kube_node_info@@(.*)"
      replacement = "<cluster provider id>://${1}"
      action = "replace"
      target_label = "provider_id"
    }
Replace <cluster provider id> with the provider ID you would like to appear in the Kubernetes Monitoring Cluster list page.
Efficiency usage data missing
If CPU and memory usage within any table shows no data, it could be due to missing Node Exporter metrics. Navigate to the Metrics status tab to determine what is not being reported.
Metrics missing
If metrics are missing even though the Metrics status tab is showing that the configuration is set up as you intended, check for an incorrectly configured label for the Node Exporter instance.
Make sure the Node Exporter instance label is set to the Node name. The labels for kube-state-metrics node and Node Exporter instance must contain the same values.
Methodology for missing metrics
It’s helpful to keep in mind the different phases of metrics gathering when debugging.
Discovery
Find the metric source. In this phase, find out whether the tool to gather metrics is working. For example, is Node Exporter running? Can Alloy find Node Exporter? Perhaps there’s configuration that is incorrect because Alloy is looking in a namespace or for a specific label.
Scraping
Ask whether the metrics were gathered correctly. As an example, most metric sources use HTTP, but the metric source you are trying to find uses HTTPS. Identify whether the configuration is set for scraping HTTPS.
Processing
Ask whether metrics were correctly processed. With Kubernetes Monitoring, metrics are filtered to a small subset of the useful metrics.
Delivery
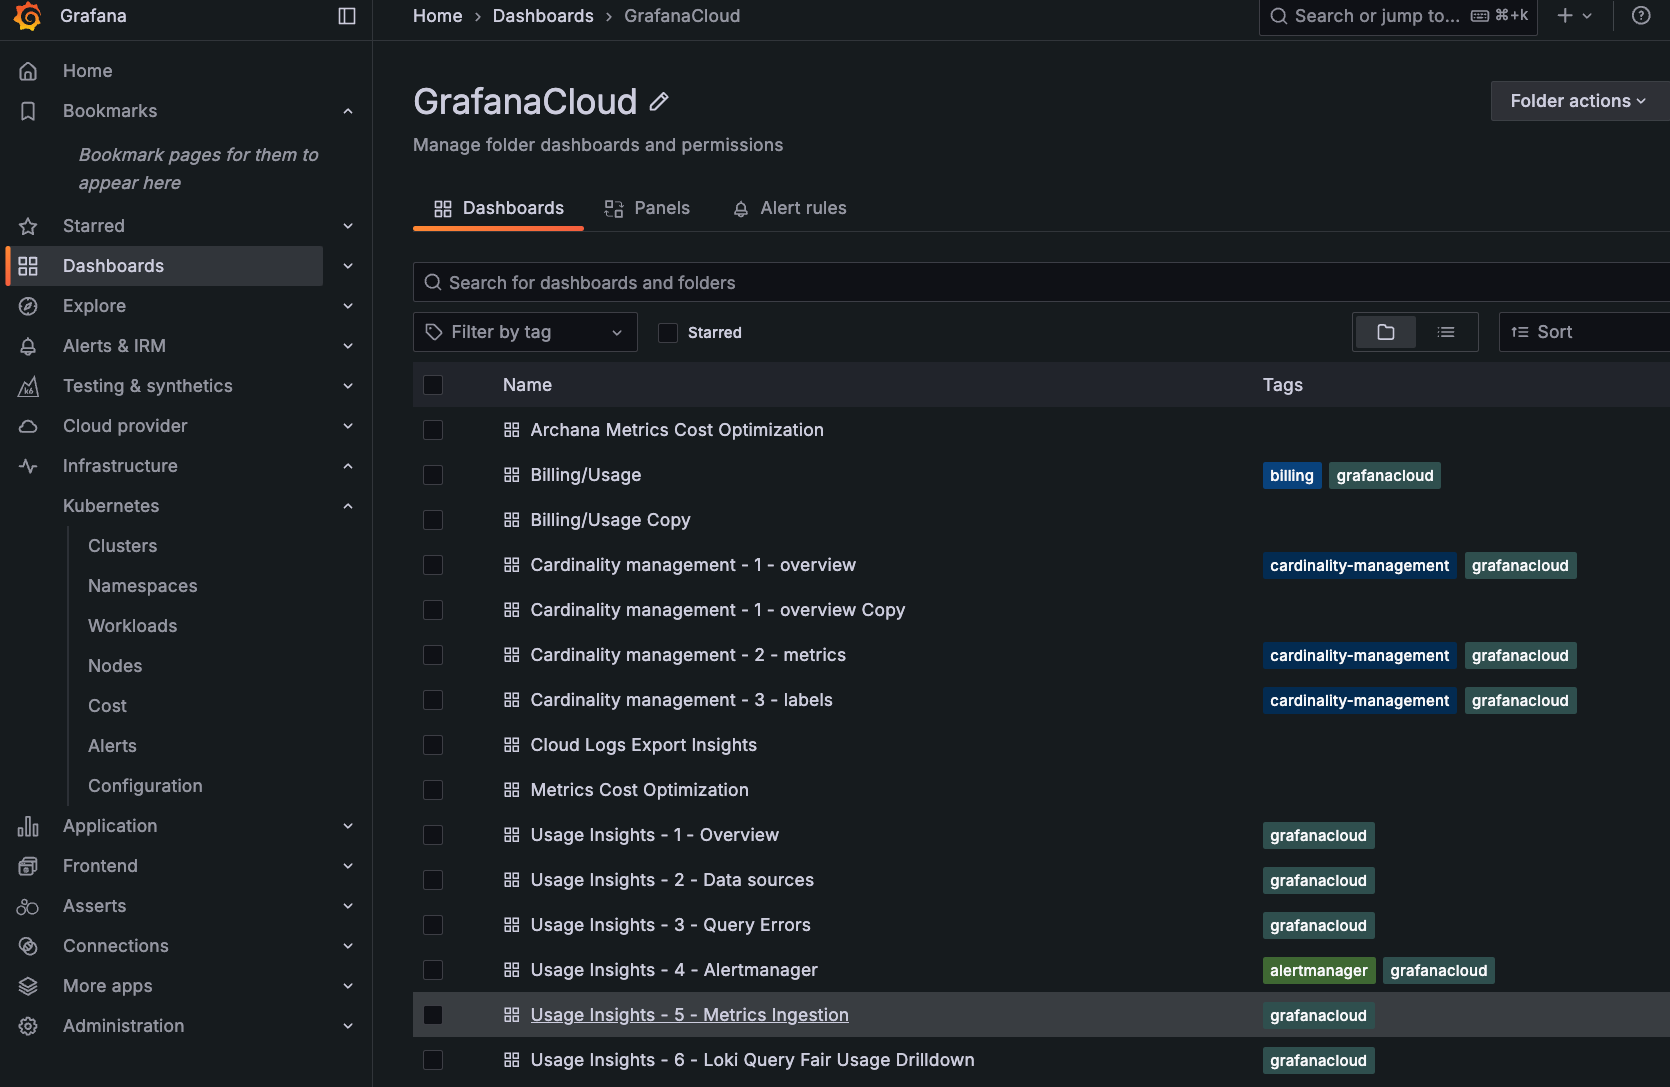
In this phase, metrics are sent to Grafana Cloud. If there is an issue, there are likely no metrics being delivered. This can occur if your account limits for metrics is reached. Check the Usage Insights - 5 - Metrics Ingestion dashboard.
Displaying
In this phase, a metric is not showing up in the Kubernetes Monitoring GUI. If you’ve determined the metrics are being delivered but some are not displaying, there may be a missing or incorrect label for the metric. Check the Metrics status tab.
Workload data missing
If you are seeing Pod resource usage but not workloads usage data, the recording rules and alert rules are likely not installed.
- Navigate to the Configuration page.
- Scroll to the step for Backend installation.
- Click Install to install alert rules and recording rules.
Troubleshooting deployment with Helm chart
Two common issues often occur when a Helm chart is not configured correctly:
- Duplicate metrics
- Missing metrics
If you have configured Kubernetes Monitoring with the Grafana Kubernetes Monitoring Helm chart, here are some general troubleshooting techniques:
- Within Kubernetes Monitoring, view the metrics status.
- Check for any changes with the command
helm template .... This produces an `output.yaml’ file to check the result. - Check the configuration with the command
helm test --logs. This provides a configuration validation, including all phases of metrics gathering through display. - Check the
extraConfigsection of the Helm chart to ensure this section is not used for modifications. This section is only for additional configuration not already in the chart, and not for modifications to the chart.
View metrics status
To view the status of metrics being collected:
- Click Configuration on the menu.
- Click the Metrics status tab.
- Filter for the Cluster or Clusters you want to see the status of.

Status icons
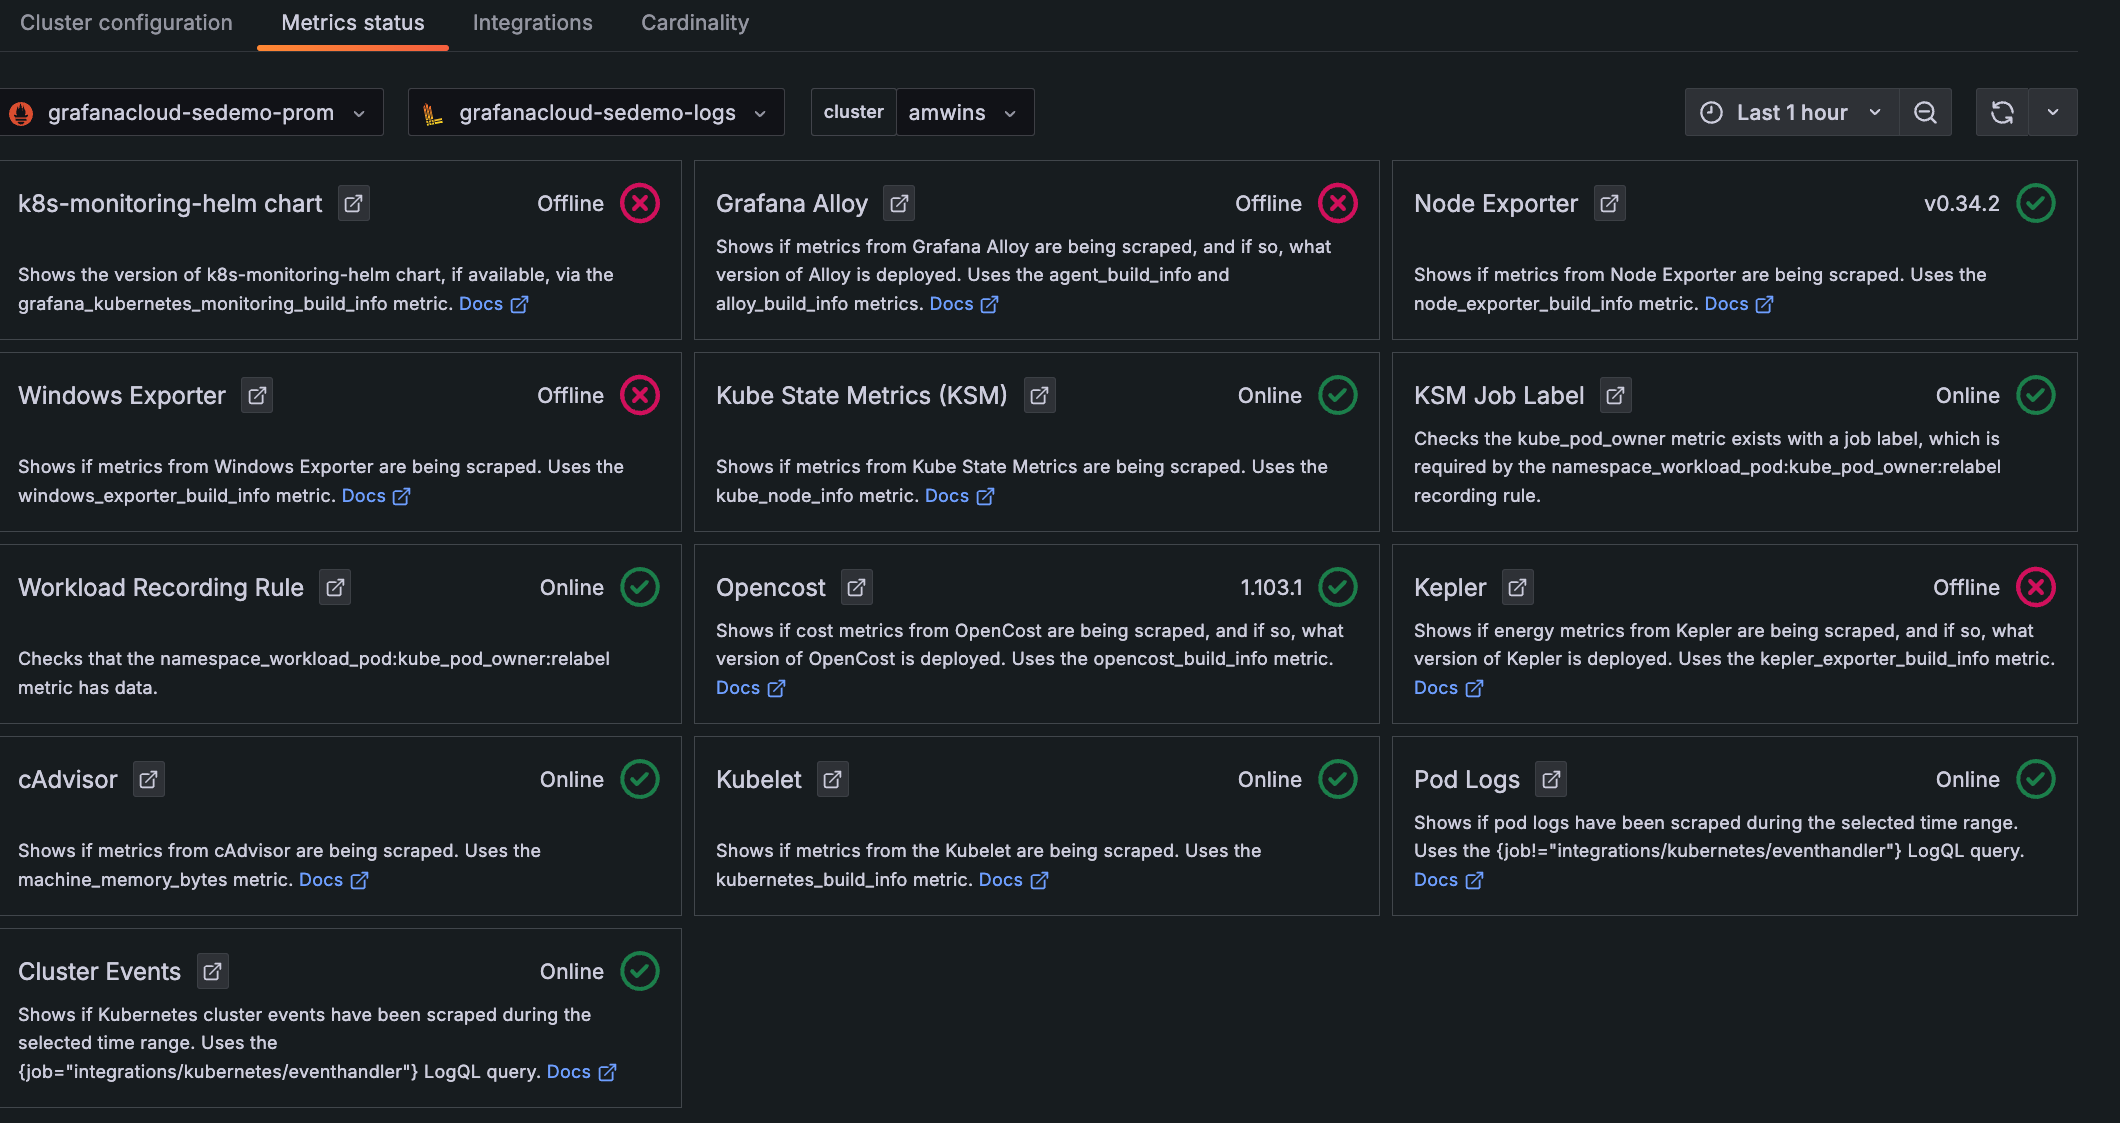
Each panel of the Metrics status shows an icon that indicates the status of the incoming data, based on the selected data source, Cluster, and time range:
- Check mark in a circle (green): Data for this source is being collected. The version of the source or online status also displays (if available).
- Caution with exclamation mark (yellow): Duplicate data is being collected for the metric source.
- X in a circle (red): There is no data available for this item within the time range specified, and it appears to be offline.

Check initial configuration
When you initially configure, if any box shows a red X in a circle, it can be any of the following:
- The feature was not selected during Cluster configuration.
- The system is not running correctly.
- Alloy was not able to gather data correctly.
- No data was gathered during the time range specified.
View the query with Explore
If something in the metrics status looks incorrect, click the icon next to the panel title. This opens the query in Explore where you can examine the query for any issues, such as an incorrect label.
Look at a historical time range
Use the time range selector to understand what was occurring in the past. In the following example, Cluster events were being collected but are not currently.
View documentation for each status
For more information about each status, click the Docs link in each panel.
Error messages
Here are tips for errors you may receive related to configuration.
OpenShift error
With OpenShift’s default SecurityContextConstraints (scc) of restricted (refer to the scc documentation for more info), you may run into the following errors while deploying Grafana Alloy using the default generated manifests:
msg="error creating the agent server entrypoint" err="creating HTTP listener: listen tcp 0.0.0.0:80: bind: permission denied"By default, the Alloy StatefulSet container attempts to bind to port 80, which is only allowed by the root user (0) and other privileged users. With the default restricted SCC on OpenShift, this results in the preceding error.
Events:
  Type     Reason        Age                   From                  Message
  ----     ------        ----                  ----                  -------
  Warning  FailedCreate  3m55s (x19 over 15m)  daemonset-controller  Error creating: pods "grafana-agent-logs-" is forbidden: unable to validate against any security context constraint: [provider "anyuid": Forbidden: not usable by user or serviceaccount, spec.volumes[1]: Invalid value: "hostPath": hostPath volumes are not allowed to be used, spec.volumes[2]: Invalid value: "hostPath": hostPath volumes are not allowed to be used, spec.containers[0].securityContext.runAsUser: Invalid value: 0: must be in the ranges: [1000650000, 1000659999], spec.containers[0].securityContext.privileged: Invalid value: true: Privileged containers are not allowed, provider "nonroot": Forbidden: not usable by user or serviceaccount, provider "hostmount-anyuid": Forbidden: not usable by user or serviceaccount, provider "machine-api-termination-handler": Forbidden: not usable by user or serviceaccount, provider "hostnetwork": Forbidden: not usable by user or serviceaccount, provider "hostaccess": Forbidden: not usable by user or serviceaccount, provider "node-exporter": Forbidden: not usable by user or serviceaccount, provider "privileged": Forbidden: not usable by user or serviceaccount]
By default, the Alloy DaemonSet attempts to run as root user, and also attempts to access directories on the host (to tail logs). With the default restricted SCC on OpenShift, this results in the preceding error.
To solve these errors, use the hostmount-anyuid SCC provided by OpenShift, which allows containers to run as root and mount directories on the host.
If this does not meet your security needs, create a new SCC with the required tailored permissions, or investigate running Agent as a non-root container, which goes beyond the scope of this troubleshooting guide.
To use the hostmount-anyuid SCC, add the following stanza to the alloy and alloy-logs ClusterRoles:
. . .
- apiGroups:
  - security.openshift.io
  resources:
  - securitycontextconstraints
  verbs:
  - use
  resourceNames:
  - hostmount-anyuid
. . .
Update error
If you attempted to upgrade Kubernetes Monitoring with the Update button on the Cluster configuration tab under Configuration and received an error message, complete the following instructions.
Warning
When you uninstall Grafana Alloy, this deletes its associated alert and recording rule namespace. Alerts added to the default locations are also removed. Save a copy of any customized item if you modified the provisioned version.
- Click Uninstall.
- Click Install to reinstall.
- Complete the instructions in Configure with Grafana Kubernetes Monitoring Helm chart.


