Send Kubernetes metrics, logs, and events to Grafana Cloud with Helm and Terraform
You can configure Kubernetes Monitoring with Helm and Terraform, and use:
- The Kubernetes Monitoring GUI
- Preconfigured alerts and recording rules
Before you begin
Make sure you have the following available:
- Terraform CLI installed in your system
- Access to a Kubernetes Cluster
- The Admin role to install preconfigured components
Configuration steps
The steps to configure Kubernetes Monitoring with Terraform are:
- Use a Grafana Cloud Access Policy token.
- Install the preconfigured components.
- Set up the Helm provider in Terraform.
- Configure Terraform variables.
- Install and configure the Helm chart.
- Apply the Terraform configuration.
Create or gather Grafana Cloud Access Policy token
You can create a new access policy token or look up an existing token. See Grafana Cloud Access Policies for more information.
You’ll use this token in a future step.
Install preconfigured alerts and recording rules
To install preconfigured alerts and recording rules, complete the following steps:
- Navigate to your Grafana Cloud account.
- Click the upper-left menu icon to open the main menu.
- Click Observability.
- Click the Kubernetes tile. The Configuration page appears.
- Under the Backend installation section, click Install to install the alerts and recording rules.
Configure the Helm provider in Terraform
Complete the following steps to create a provider.tf file and configure the provider.
Note
Before you being configuration, find the latest version number of the Helm chart, then enter that version as part of your code.
Open a text editor or terminal and paste the following code:
cat >> provider.tf <<'EOF'
terraform {
  required_providers {
    helm = {
      source  = "hashicorp/helm"
      version = "2.9.0"
    }
  }
}
provider "helm" {
  kubernetes {
    config_path    = "~/.kube/config"
    config_context = "k3d-test"
  }
}
EOF
Replace
{YOUR_CONTEXT}with the name of your Kubernetes context.
Define Terraform variables
Complete the following steps to create a vars.tf file and configure the Terraform variables.
Open a text editor or terminal and paste the following code:
cat >> vars.tf <<'EOF'
variable "namespace" {
    type = string
    default = "{NAMESPACE}"
}

variable "cluster-name" {
    type = string
    default = "{CLUSTER_NAME}"
}

variable "prometheus-username" {
    type = number
    default = {METRICS_USERNAME}
}

variable "prometheus-url" {
    type = string
    default = "{PROMETHEUS_URL}"
}

variable "loki-username" {
    type = number
    default = {LOGS_USERNAME}
}

variable "loki-url" {
    type = string
    default = "{LOKI_URL}"
}

variable "cloud-access-token" {
    type = string
    default = "{GRAFANA_CLOUD_ACCESS_TOKEN}"
}
EOF
Replace the following in the code:
{NAMESPACE}with your namespace where you want to deploy Kubernetes Monitoring resources{CLUSTER_NAME}with your Cluster name{METRICS_USERNAME}with the Prometheus instance ID{PROMETHEUS_URL}with the push endpoint URL of the Prometheus instance{LOGS_USERNAME}with Loki Username{LOKI_URL}with the push endpoint URL of the Loki instance{GRAFANA_CLOUD_ACCESS_TOKEN}with your Grafana Cloud Access token
Run the code to create the vars.tf file with the specified variables.
If you need to change the default value or add more variables, modify this file.
Install and configure the Helm chart
Note
Before you being configuration, find the latest version number of the Helm chart, then enter that version as part of your code.
Use the following command to create a Terraform configuration that installs and configures the Grafana Kubernetes Monitoring Helm chart. This command installs the Helm chart and enables metrics, Pod logs, Cluster events and cost metrics.
```shell
cat >> grafana-k8s-monitoring.tf <<'EOF'
resource "helm_release" "grafana-k8s-monitoring" {
  name       = "grafana-k8s-monitoring"
  repository = "https://grafana.github.io/helm-charts"
  chart      = "k8s-monitoring"
  version    = "0.1.4"
  namespace  = var.namespace

  set {
    name  = "cluster.name"
    value = var.cluster-name
  }

  set {
    name  = "externalServices.prometheus.host"
    value = var.prometheus-url
  }

  set {
    name  = "externalServices.prometheus.basicAuth.username"
    value = var.prometheus-username
  }

  set {
    name  = "externalServices.prometheus.basicAuth.password"
    value = var.cloud-access-token
  }
  set {
    name  = "externalServices.loki.host"
    value = var.loki-url
  }

  set {
    name  = "externalServices.loki.basicAuth.username"
    value = var.loki-username
  }

  set {
    name  = "externalServices.loki.basicAuth.password"
    value = var.cloud-access-token
  }

  set {
    name  = "opencost.opencost.exporter.defaultClusterId"
    value = var.cluster-name
  }

  set {
    name  = "opencost.opencost.prometheus.external.url"
    value = "${var.prometheus-url}/api/prom"
  }
}
EOF
```
Apply the Terraform configuration
Complete the following steps to apply the Terraform configuration and deploy the resources.
- Open a terminal or shell.
- Navigate to the directory where all the configuration files are located.
- Run the following command to initialize the Terraform working directory:
terraform initThis command will download and initialize the necessary provider plugins and modules.
To preview the changes that Terraform will make, run the following command. This command will analyze your configuration and display the resources that will be created, modified, or deleted.
```shell
terraform plan
```
Apply the configuration by running the following command:
terraform applyTerraform will prompt you to confirm the execution of the plan. Type “yes”, and press Enter to proceed with the deployment.
Next steps
Navigate to Kubernetes Monitoring, and click Configuration on the main menu.
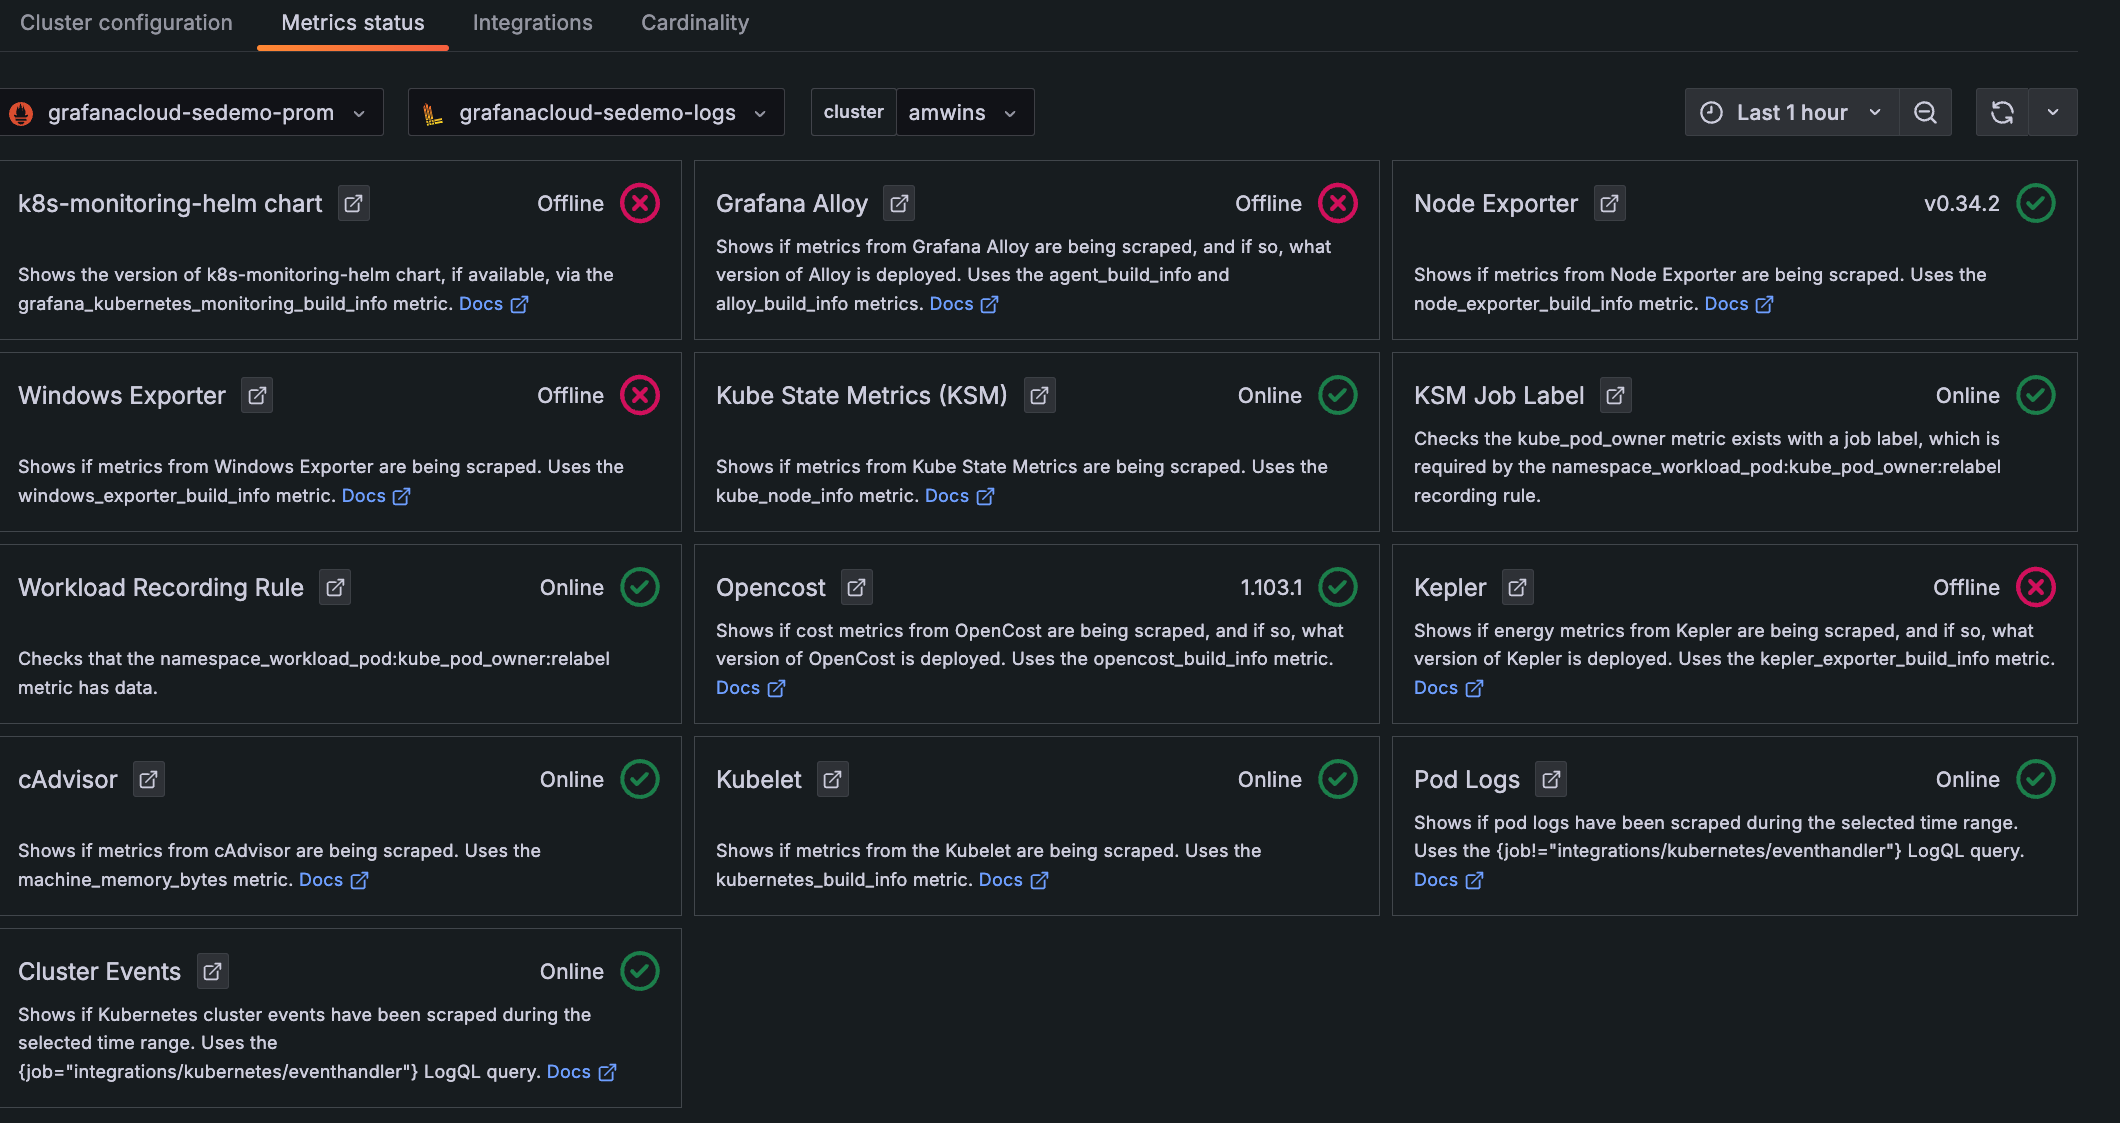
Click the Metrics status tab to view the data status. Your data becomes populated as the system components begin scraping and sending data to Grafana Cloud.
![**Metrics status** tab with status indicators for one Cluster Descriptions and statuses for each item chosen to be configured and whether they are online]()
Metrics status tab with status indicators for one Cluster Click Kubernetes Monitoring on the main menu to view the home page and see any issues currently highlighted. You can drill into the data from here.
Explore your Kubernetes infrastructure:
- Click Cluster navigation in the menu, then click your namespace to view the grafana-agent StatefulSet, the grafana-agent-logs DaemonSet, and the ksm-kube-state-metrics deployment. Click the kube-system namespace to see Kubernetes-specific resources.
- Click the Nodes tab, then click the Nodes of your cluster to view their condition, utilization, and pod density.


