Configure remote_write with Prometheus Operator
You can configure Prometheus Operator to scrape an endpoint and send the scraped metrics to Grafana Cloud. Prometheus Operator implements the Kubernetes Operator pattern for managing a Prometheus-based Kubernetes monitoring stack. A Kubernetes Operator consists of Kubernetes custom resources and controller code that abstract away the management and implementation details of running a given service on Kubernetes. To learn more about Kubernetes Operators, see Operator pattern from the Kubernetes docs.
The Prometheus Operator provides a set of Kubernetes Custom Resources that simplify Prometheus, Grafana and Alertmanager deployment and configuration. For example, with the ServiceMonitor custom resource, you can configure how to monitor groups of Kubernetes services in YAML manifests. The Operator controller then communicates with the Kubernetes API server to monitor service endpoints, and automatically generates the required Prometheus scrape configurations for the configured services. To learn more about Prometheus Operator, refer to the Prometheus Operator GitHub repository.
kube-prometheus configures Prometheus Operator with a default Prometheus-Alertmanager-Grafana stack, and sets up preconfigured Alertmanager alerts. It also configures a set of Prometheus scrape targets and sets up node-exporter and kube-state-metrics.
Before you begin
You must have either Prometheus Operator or kube-prometheus installed and running in your Kubernetes cluster. Prometheus Operator is a sub-component of the kube-prometheus stack.
- To install Prometheus Operator, see the Prometheus Operator GitHub repository.
- To install kube-prometheus, see kube-prometheus.
If you used the Helm package manager to install either of these components, see the relevant guide:
- Configure remote_write with Helm and Prometheus
- Configure remote_write with Helm and kube-prometheus-stack
Create a Kubernetes Secret to store Grafana Cloud credentials
Create a Kubernetes Secret to store your Grafana Cloud Metrics username and password.
To create your Kubernetes Secret:
To find your username, navigate to your stack in the Cloud Portal and click Details next to the Prometheus panel.
Your password corresponds to a Cloud Access Policy token that you can generate by clicking on Generate now in this same panel. To create a Cloud Access Policy, refer to Create a Grafana Cloud Access Policy.
Make a note of your Cloud Prometheus username and password.
Run the following command to create a Secret, as in this example,
kubepromsecret:kubectl create secret generic kubepromsecret \ --from-literal=username=<your_grafana_cloud_prometheus_username>\ --from-literal=password='<your_grafana_cloud_access_policy_token>'\ -n defaultNote: If you deployed your monitoring stack in a namespace other than
default, change the-n monitoringflag to the appropriate namespace in the above command. For more information about this command, see Managing Secrets using kubectl.Instead of creating the secret directly as in this example, you can use a manifest file. For more about Kubernetes Secrets, refer to Secrets.
Modify the Prometheus manifest configuration
Locate the manifest file for the Prometheus custom resource running in your cluster.
- If you are using kube-prometheus and deployed its default stack, the manifest file is
prometheus-prometheus.yamlin themanifestsdirectory of the kube-prometheus GitHub repo. - If you are using Prometheus Operator, first define and deploy one or more Prometheus instances using the Prometheus Custom Resource Definition (CRD) created by Prometheus Operator. You can use the Prometheus manifest from kube-prometheus to help you begin. The installation and configuration of Prometheus in your cluster is beyond the scope of this content.
- If you are using kube-prometheus and deployed its default stack, the manifest file is
Open the manifest file in an editor. You should see something like the following:
apiVersion: monitoring.coreos.com/v1
kind: Prometheus
metadata:
  labels:
    prometheus: k8s
  name: k8s
  namespace: monitoring
spec:
  alerting:
    alertmanagers:
    - name: alertmanager-main
      namespace: monitoring
      port: web
  image: quay.io/prometheus/prometheus:v2.22.1
  nodeSelector:
    kubernetes.io/os: linux
  podMonitorNamespaceSelector: {}
  podMonitorSelector: {}
  probeNamespaceSelector: {}
  probeSelector: {}
  replicas: 2
  resources:
    requests:
      memory: 400Mi
  ruleSelector:
    matchLabels:
      prometheus: k8s
      role: alert-rules
  securityContext:
    fsGroup: 2000
    runAsNonRoot: true
    runAsUser: 1000
  serviceAccountName: prometheus-k8s
  serviceMonitorNamespaceSelector: {}
  serviceMonitorSelector: {}
  version: v2.22.1
The manifest file may vary depending on your specific Prometheus deployment.
Edit and append the following
remote_writeconfiguration block after theversionparameter:version: v2.22.1 remoteWrite: - url: "<Your Metrics instance remote_write endpoint>" basicAuth: username: name: kubepromsecret key: username password: name: kubepromsecret key: passwordMake the following edits:
- Set the
remote_writeURL to Grafana Cloud’s Prometheus metrics endpoint. To find the/api/prom/pushURL, username, and password for your metrics endpoint, click Details in the Prometheus card of the Cloud Portal. - Update the
basicAuthusername and password fields based on the Secret you created in the previous step (namedkubepromsecretin the example). Enter theusernameandpasswordkeys for the Secret.
- Set the
Save and close the file after editing it.
Make the changes using the following command:
kubectl apply -f prometheus-prometheus.yaml -n monitoringReplace
prometheus-prometheus.yamlwith the appropriate filename andmonitoringwith the namespace into which the Prometheus stack has been installed.You should see the following output:
prometheus.monitoring.coreos.com/k8s configured
Verify your updates
Verify that your changes have propagated to your running Prometheus instances:
Use
port-forwardby running this command:kubectl --namespace monitoring port-forward svc/prometheus-k8s 9090Replace
namespacewith the appropriate namespace, andprometheus-k8swith the Prometheus service name.Navigate to
http://localhost:9090in your browser, and then Status and Configuration.Verify that the
remote_writeblock you appended above has propagated to your running Prometheus instances.Log in to your Grafana instance to begin querying your cluster data.
Navigate to Kubernetes Monitoring, and click Configuration on the main menu.
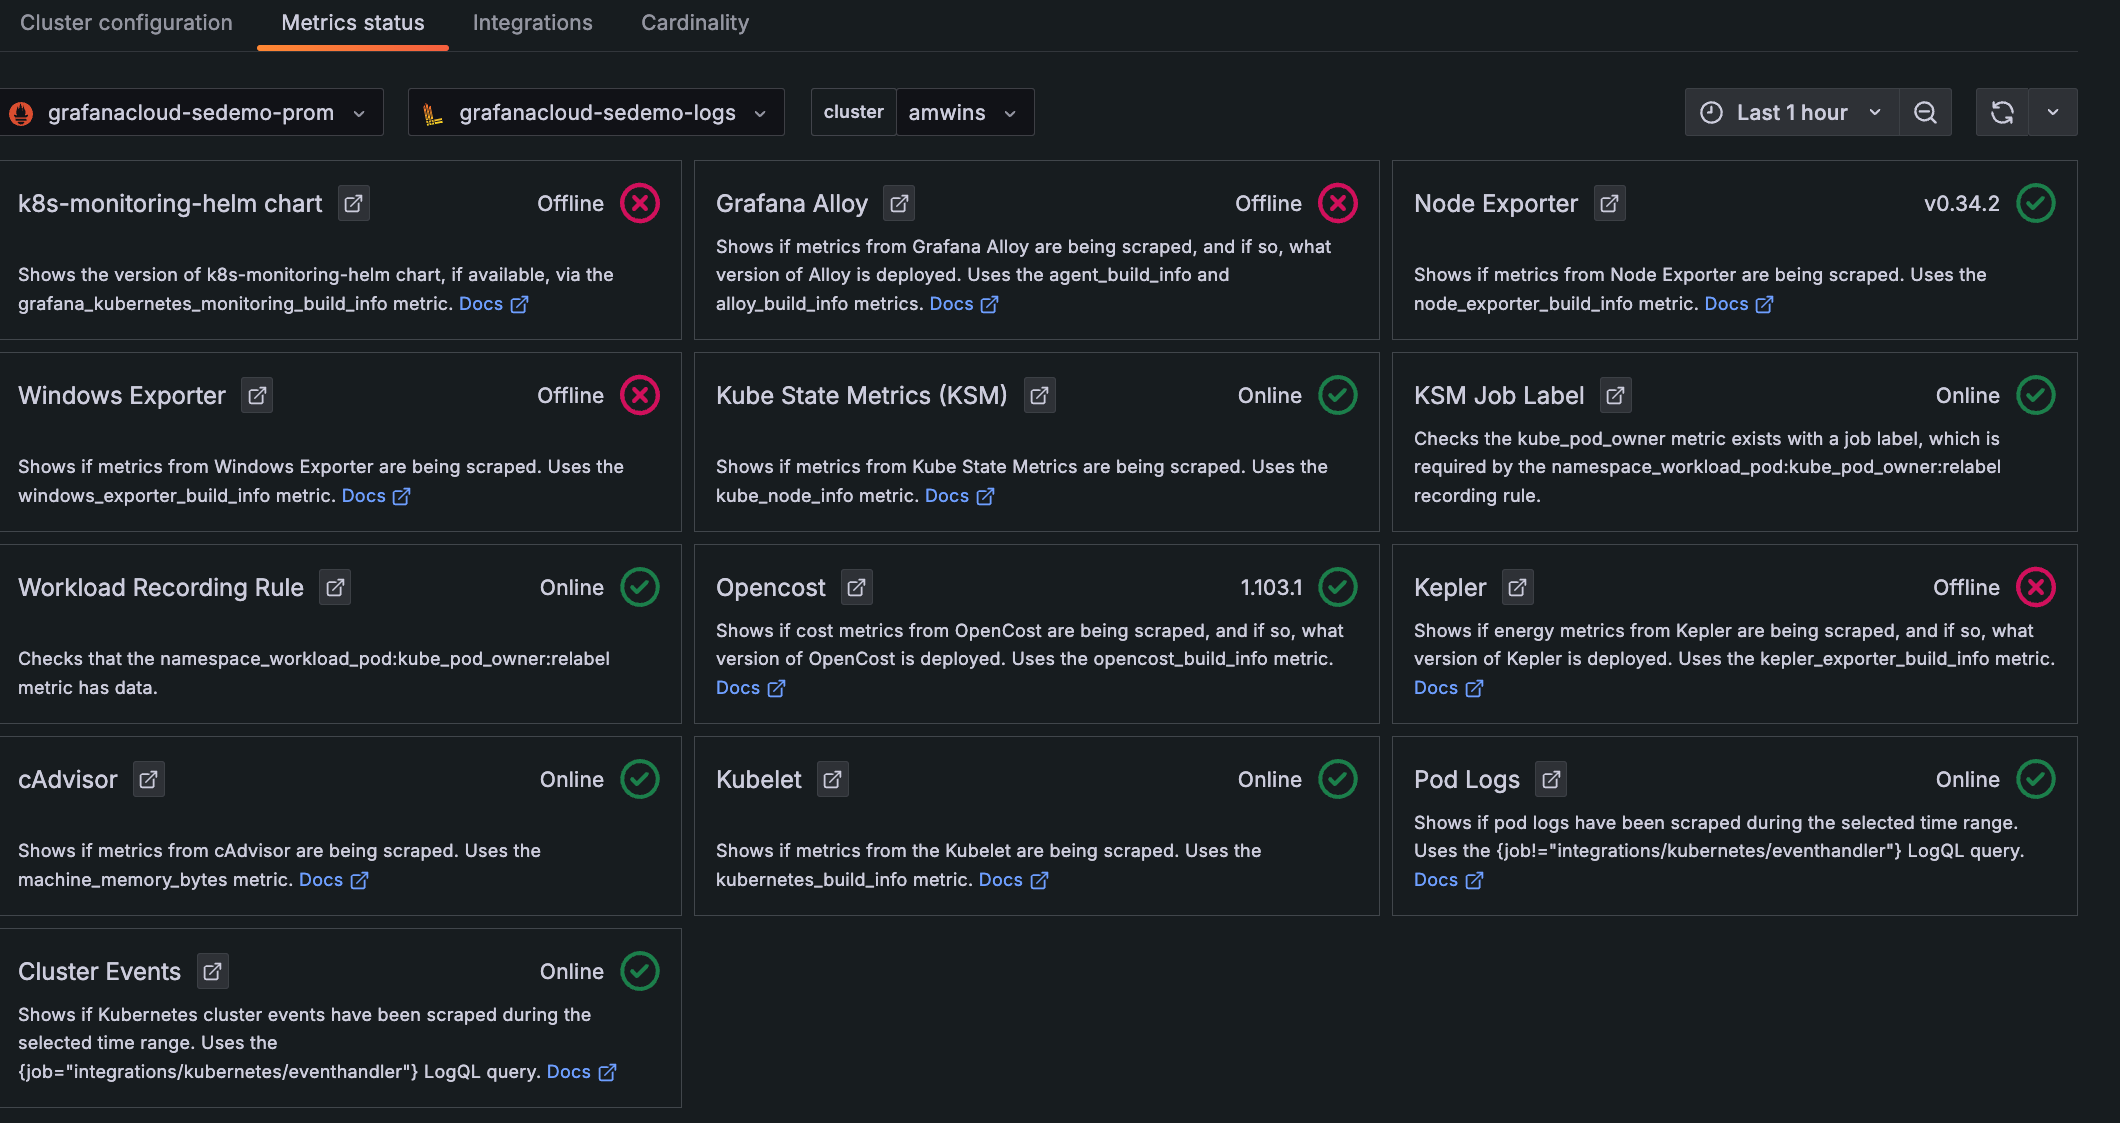
Click the Metrics status tab to view the data status. Your data begins populating in the view as the system components begin scraping and sending data to Grafana Cloud.
![**Metrics status** tab with status indicators for one Cluster Descriptions and statuses for each item chosen to be configured and whether they are online]()
Metrics status tab with status indicators for one Cluster


