Configure remote_write with Helm and Prometheus
In this guide, you’ll learn how to configure Prometheus’s remote_write feature with Helm to ship cluster metrics to Grafana Cloud using Helm.
The Prometheus Helm chart installs and bootstraps a one-replica Prometheus Deployment into your Kubernetes cluster. It also sets up kube-state-metrics, Pushgateway, Alertmanager, and node-exporter. It configures a default set of Kubernetes observability scraping jobs for Prometheus.
The Prometheus Helm chart provides a more lightweight foundation to build from than kube-prometheus-stack and can be useful if you don’t want to use Prometheus Operator or run a local Grafana instance. To learn more, see the Prometheus Helm chart GitHub repo.
Before you begin
This guide assumes you have installed the Prometheus Helm chart in your Kubernetes cluster using the Helm package manager.
To learn how to install Helm on your local machine, see Install Helm from the Helm documentation. To learn how to install the Prometheus chart, see Install Chart from the Prometheus chart GitHub repo.
If you did not use Helm to install Prometheus into your cluster or are using Prometheus Operator and the kube-prometheus stack, select a different method.
Create a Helm values file containing the remote_write configuration
In this step, you’ll create a Helm values file to define parameters for Prometheus’s remote_write configuration. With a Helm values file, you can set configuration variables that are passed in to Helm’s object templates. To see the default values file for the Prometheus Helm chart, refer to values.yaml from the Prometheus Helm chart GitHub repository.
You’ll first create a values file defining Prometheus’s remote_write configuration, and then you’ll apply this new configuration to the Prometheus deployment running in our cluster.
To create the Helm values file:
Open a file named
new_values.yamlin an editor and paste in the following values:server: remoteWrite: - url: "<Your Metrics instance remote_write endpoint>" basic_auth: username: <your_grafana_cloud_prometheus_username> password: <your_grafana_cloud_access_policy_token>Set the
remote_writeURL andbasic_authusername and password using your Grafana Cloud credentials. You can find your username by navigating to your stack in the Cloud Portal and clicking Details next to the Prometheus panel.Your password corresponds to a Cloud Access Policy token that you can generate by clicking on Generate now in this same panel. To create a Cloud Access Policy, refer to Create a Grafana Cloud Access Policy.
When you’re done editing the file, save and close it.
Now that you’ve created a values file with your Prometheus remote_write configuration, you can move on to upgrading the Prometheus Helm chart.
Upgrade the Prometheus Helm chart
Upgrade the Prometheus Helm chart with the values file you just created using
helm upgrade -f:helm upgrade -f new_values.yml [your_release_name] prometheus-community/prometheusReplace
[your_release_name]with the name of the release you used to install Prometheus. You can get a list of installed releases usinghelm list.After running
helm upgrade, you should see the following output:Release "[your_release_name]" has been upgraded. Happy Helming! NAME: [your_release_name] LAST DEPLOYED: Thu Dec 10 16:41:33 2020 NAMESPACE: default STATUS: deployed REVISION: 2 TEST SUITE: None NOTES: The Prometheus server can be accessed via port 80 on the following DNS name from within your cluster: [your_release_name]-prometheus-server.default.svc.cluster.local . . . Get the PushGateway URL by running these commands in the same shell: export POD_NAME=$(kubectl get pods --namespace default -l "app=prometheus,component=pushgateway" -o jsonpath="{.items[0].metadata.name}") kubectl --namespace default port-forward $POD_NAME 9091 For more information on running Prometheus, visit: https://prometheus.io/
Verify your updates
At this point, you’ve successfully configured Prometheus to remote_write scraped metrics to Grafana Cloud. You can verify that your running Prometheus instance is remote_writing correctly using port-forward.
To verify your changes:
Get the Prometheus server’s service name:
kubectl get svcThe Prometheus service name should look similar to
<your_release_name>-prometheus-server.Use
port-forwardto forward a local port to the Prometheus service:kubectl --namespace default port-forward svc/<prometheus-service-name> 9090:80Replace
namespacewith the appropriate namespace, and<prometheus-service-name>with the name of the Prometheus service.Navigate to
http://localhost:9090in your browser, and then Status and Configuration.Verify that the
remote_writeblock you created above has propagated to your running Prometheus instance configuration.It may take a couple of minutes for the changes to get picked up by the running Prometheus instance.
Finally, log in to your Grafana instance to begin querying your cluster data.
Navigate to Kubernetes Monitoring, and click Configuration on the main menu.
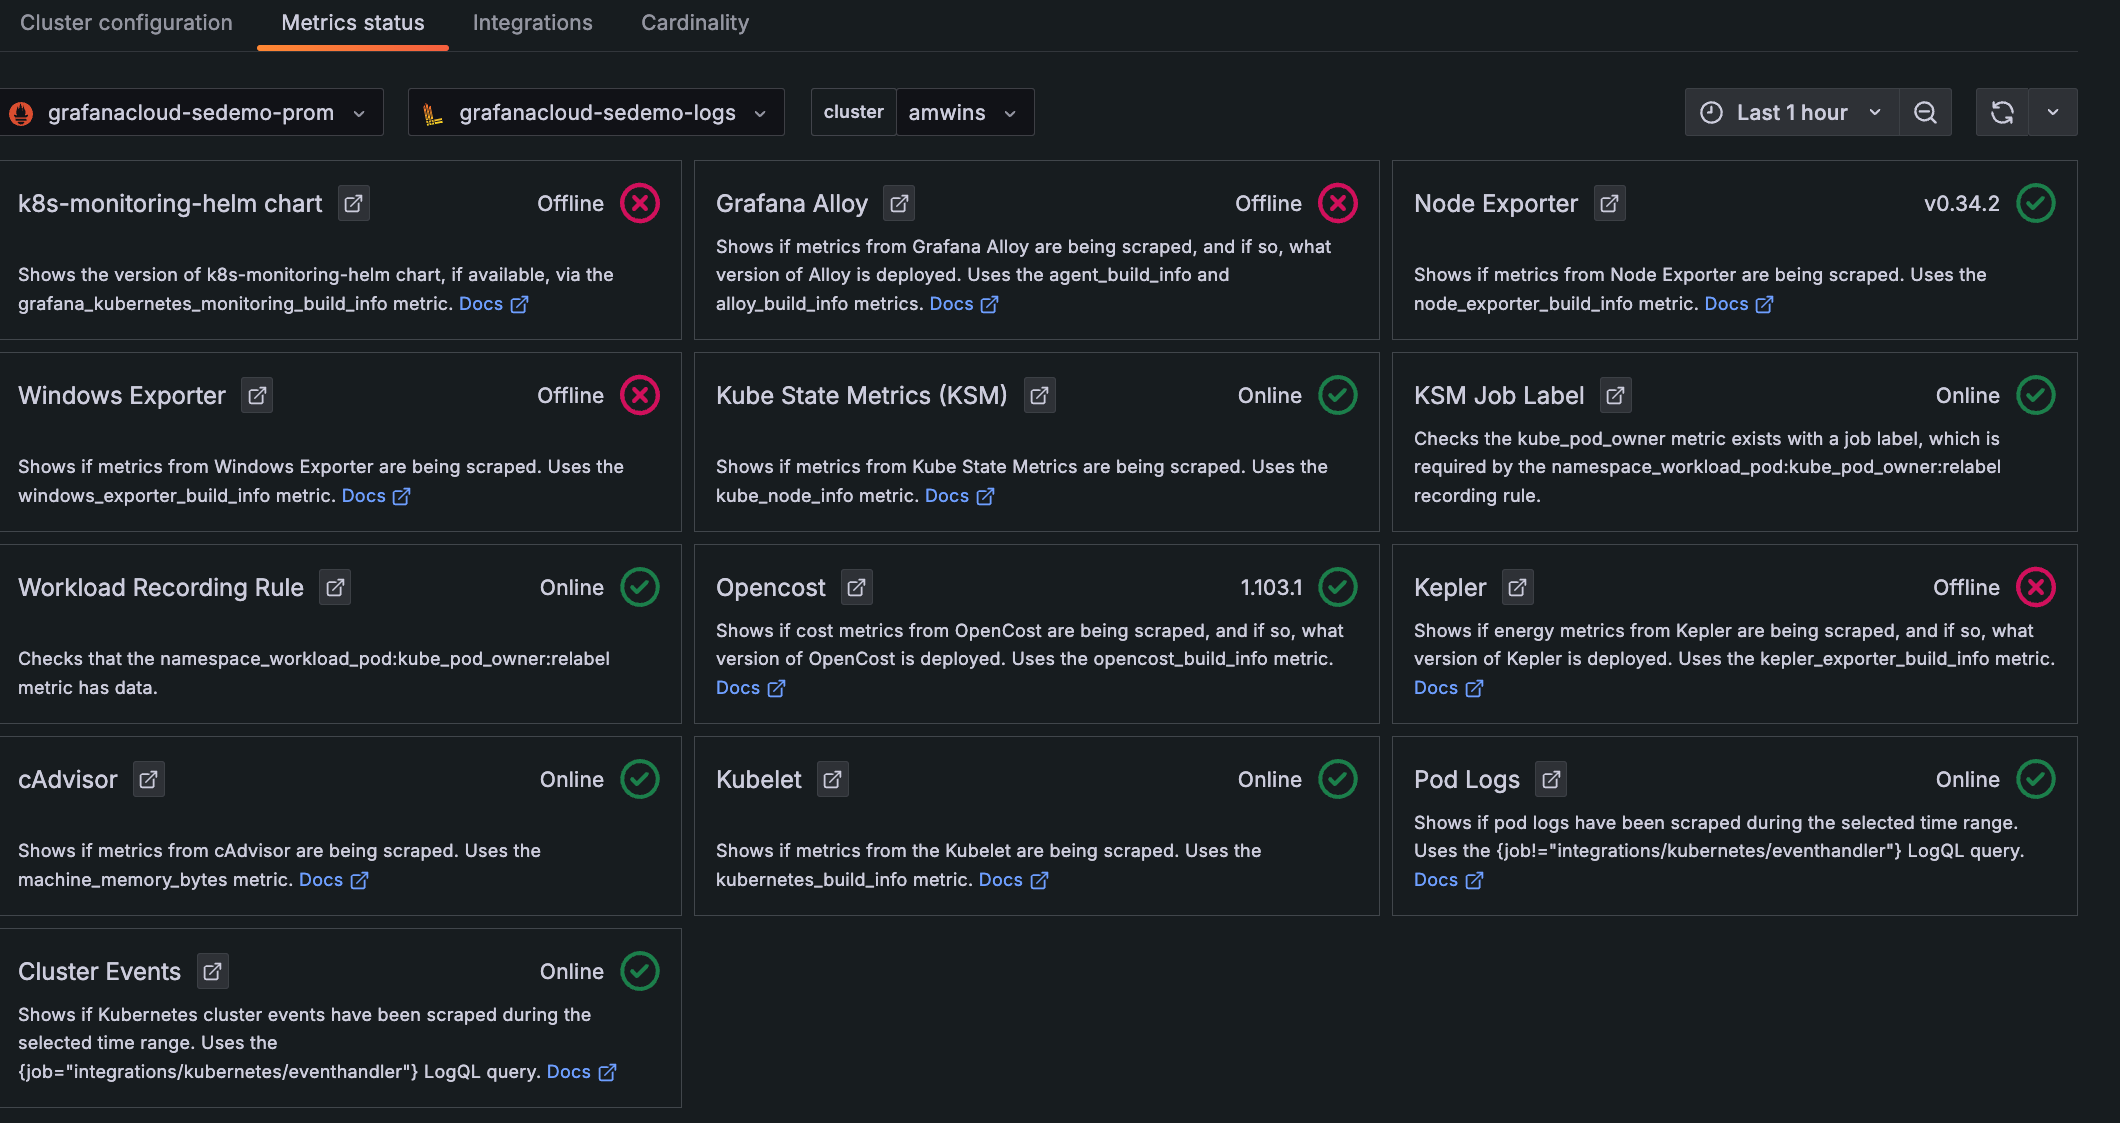
Click the Metrics status tab to view the data status. Your data begins populating in the view as the system components begin scraping and sending data to Grafana Cloud.
![**Metrics status** tab with status indicators for one Cluster Descriptions and statuses for each item chosen to be configured and whether they are online]()
Metrics status tab with status indicators for one Cluster


