vSphere integration for Grafana Cloud
VMware vSphere is a virtualization platform that enables organizations to virtualize and consolidate their IT infrastructure, allowing multiple virtual machines (VMs) to run on a single physical server. It provides features such as resource pooling, high availability, and centralized management through vCenter Server, enhancing efficiency, flexibility, and scalability in data center environments. vSphere simplifies IT management, improves resource utilization, and delivers cost savings while ensuring reliability and performance for virtualized workloads.
This integration supports vCenter Server 7.0.2.x+ and ESXi 6.7 U2+.
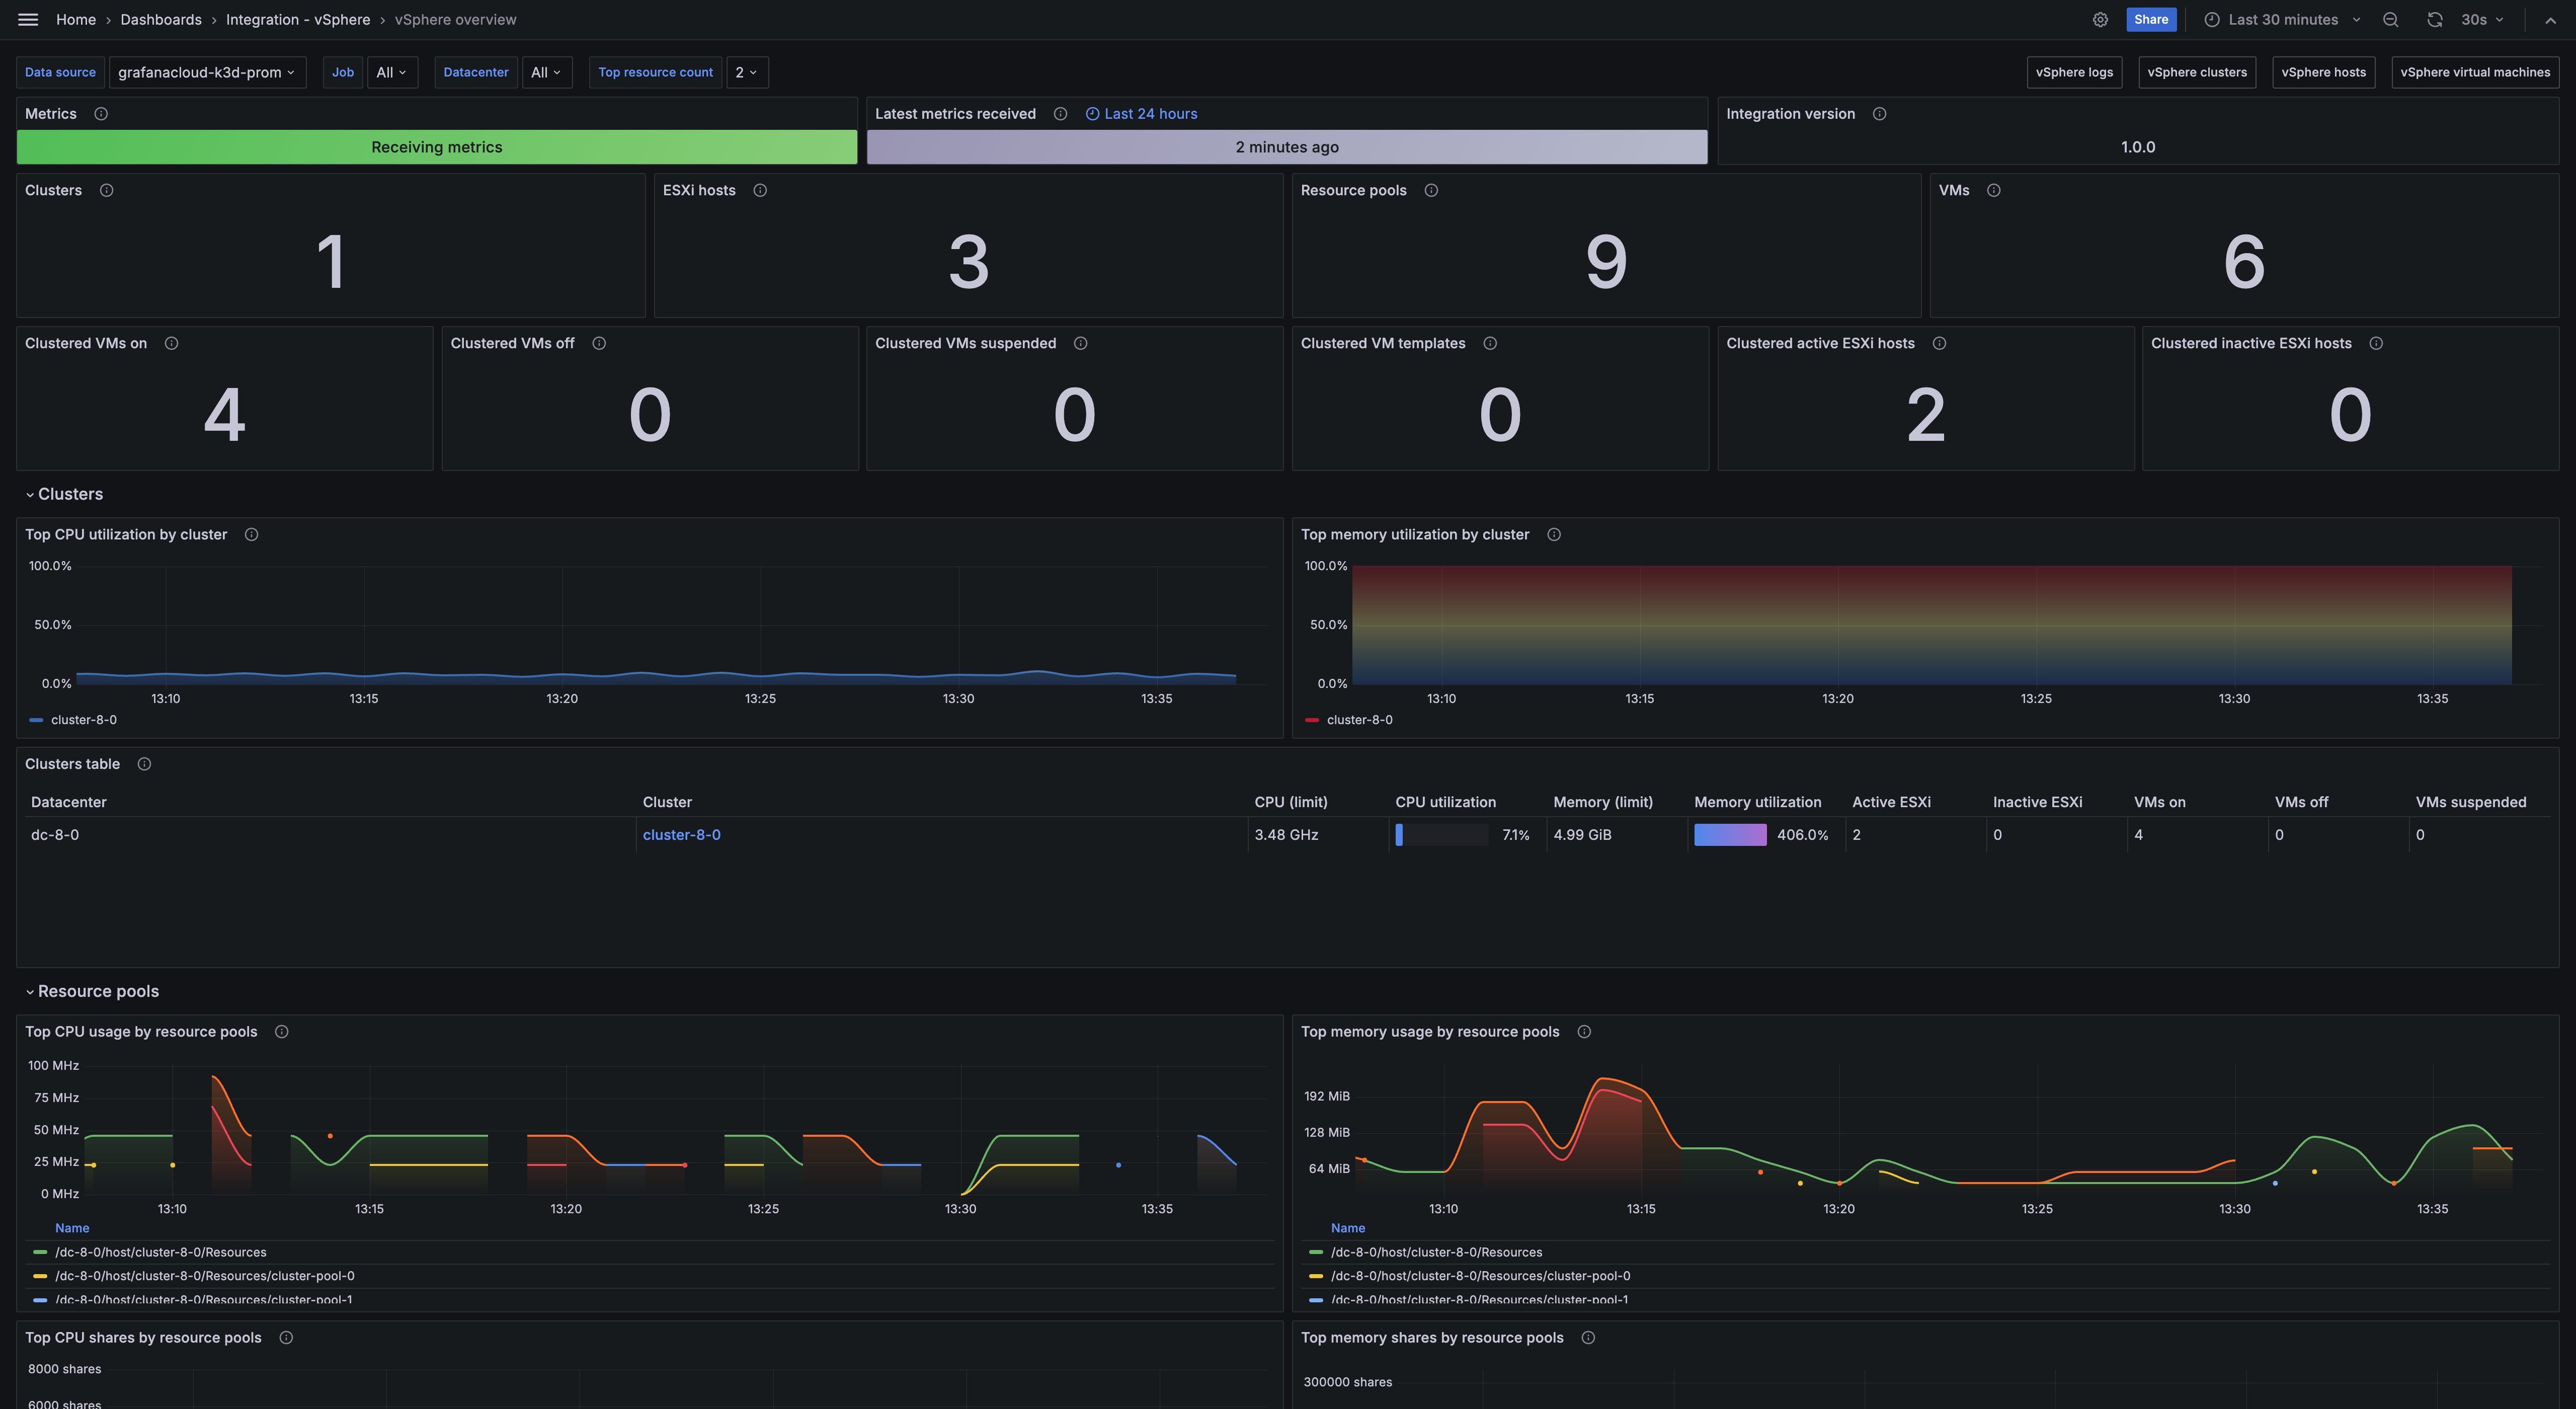
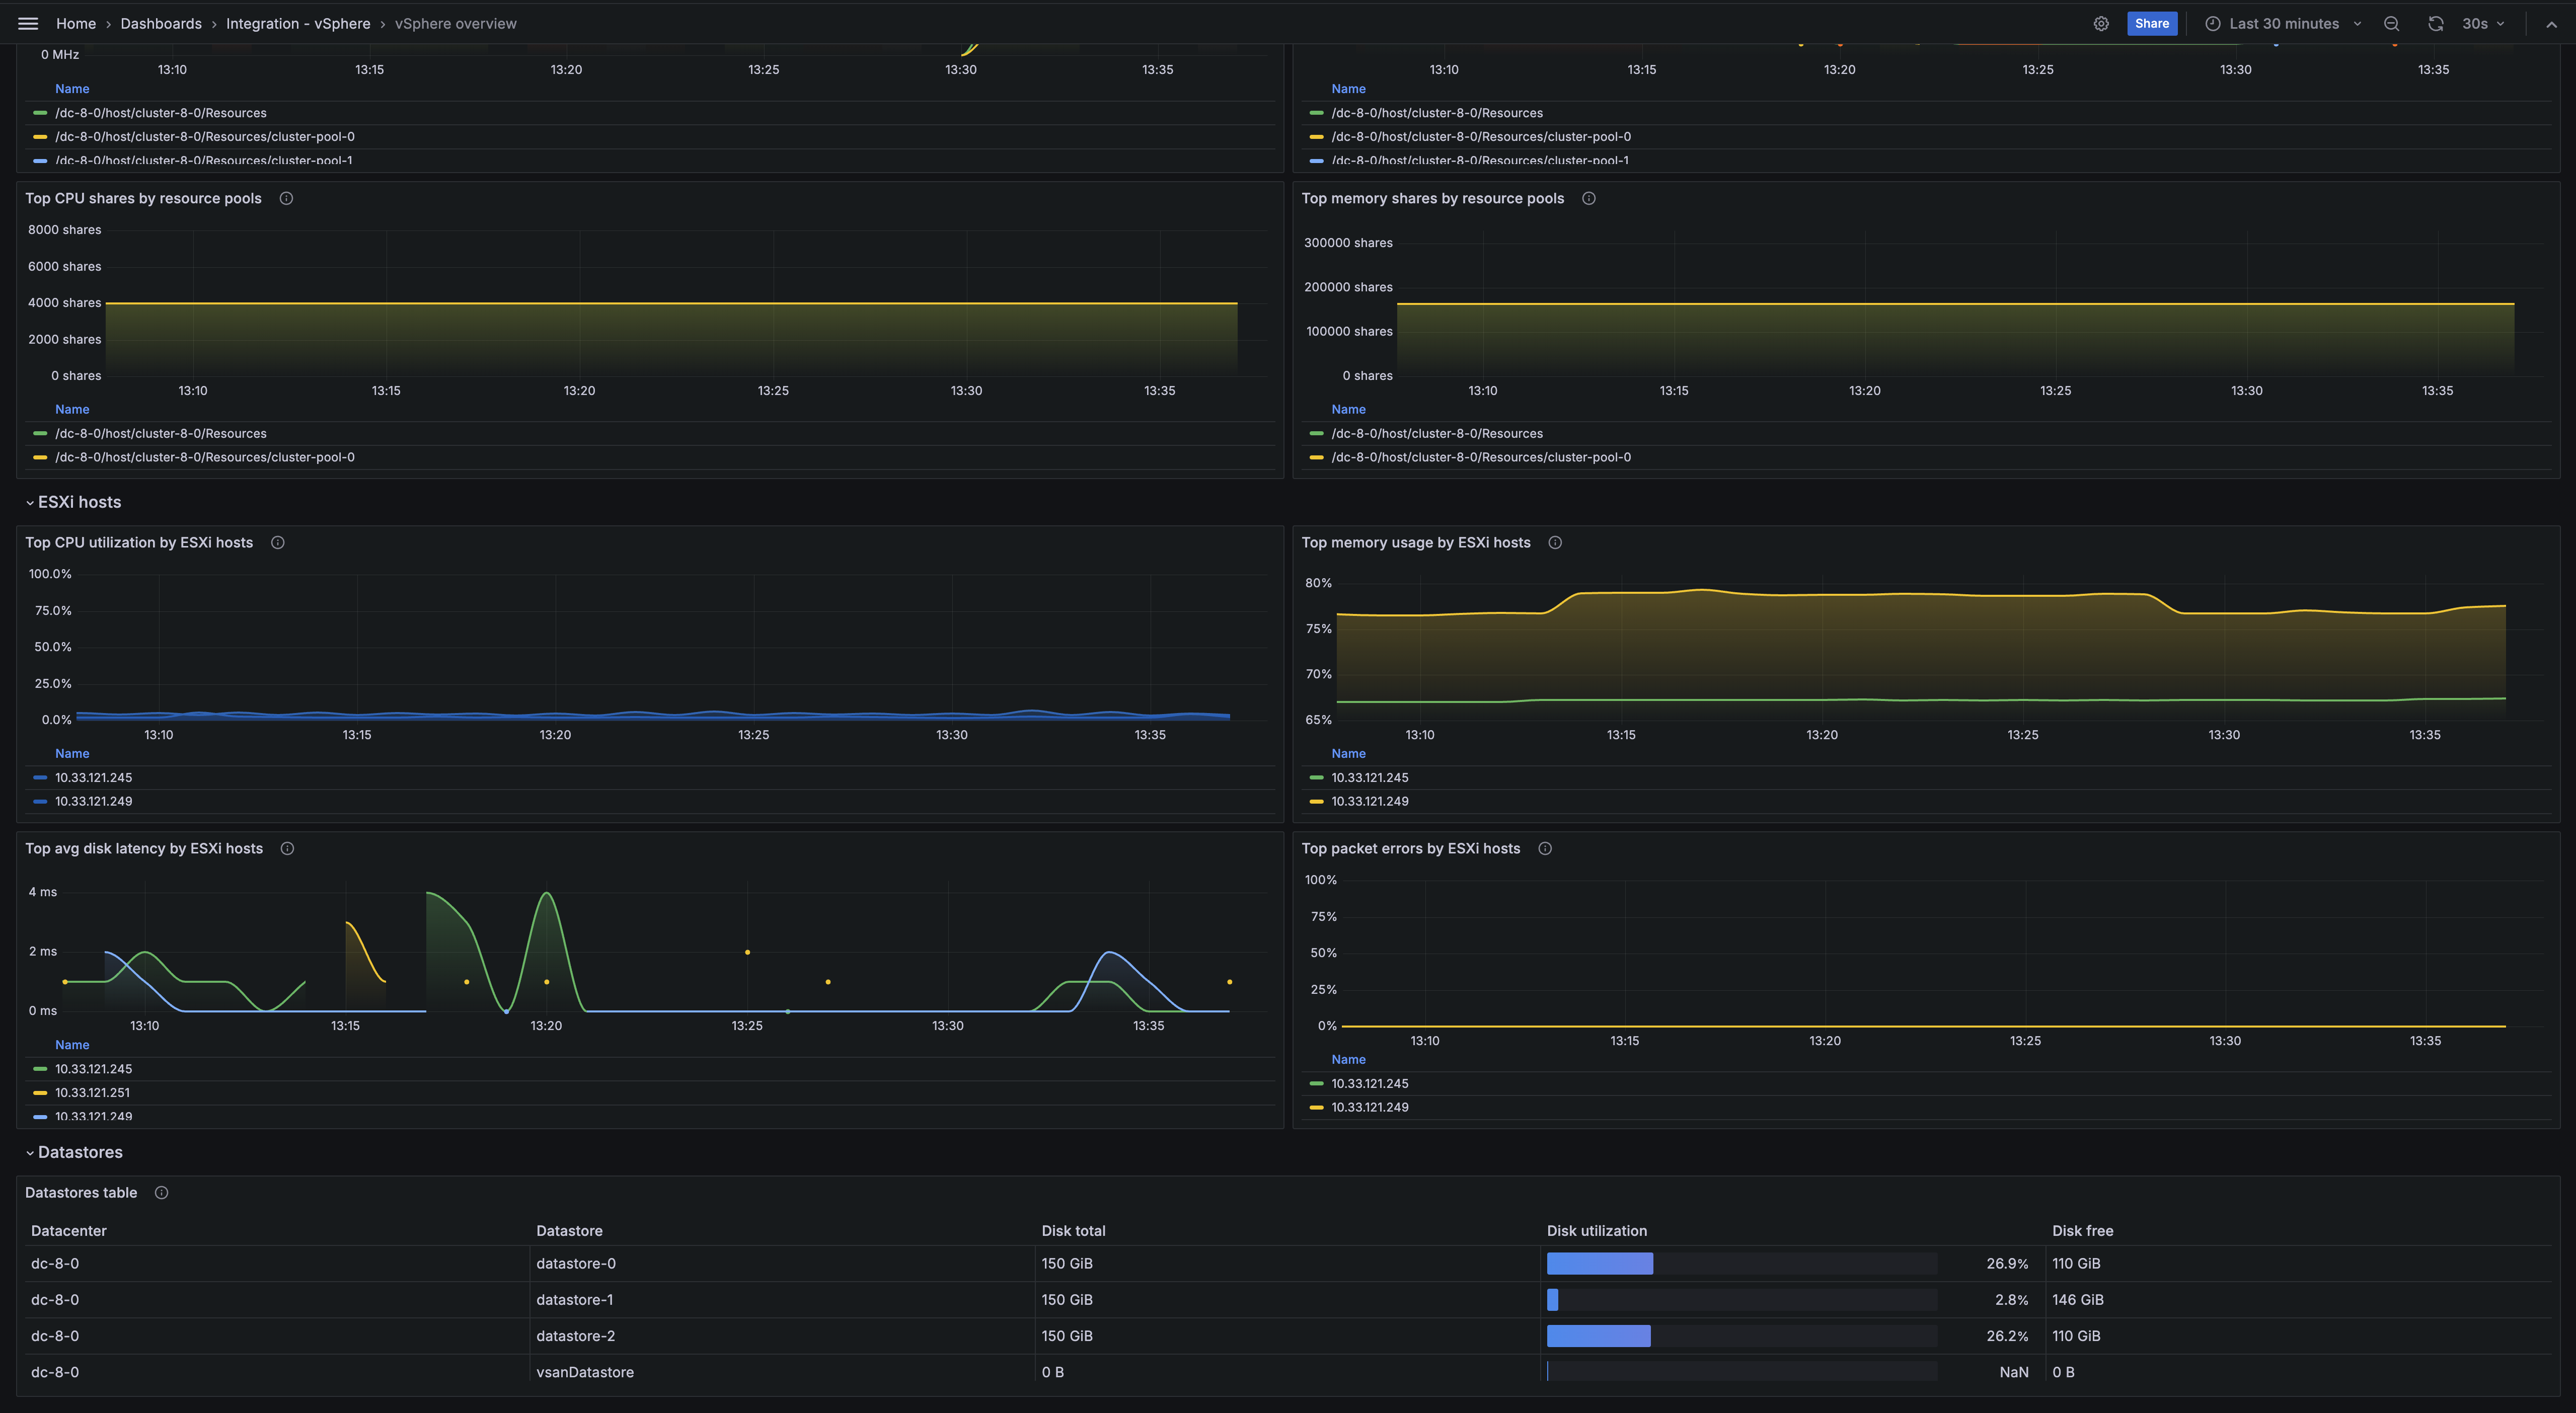
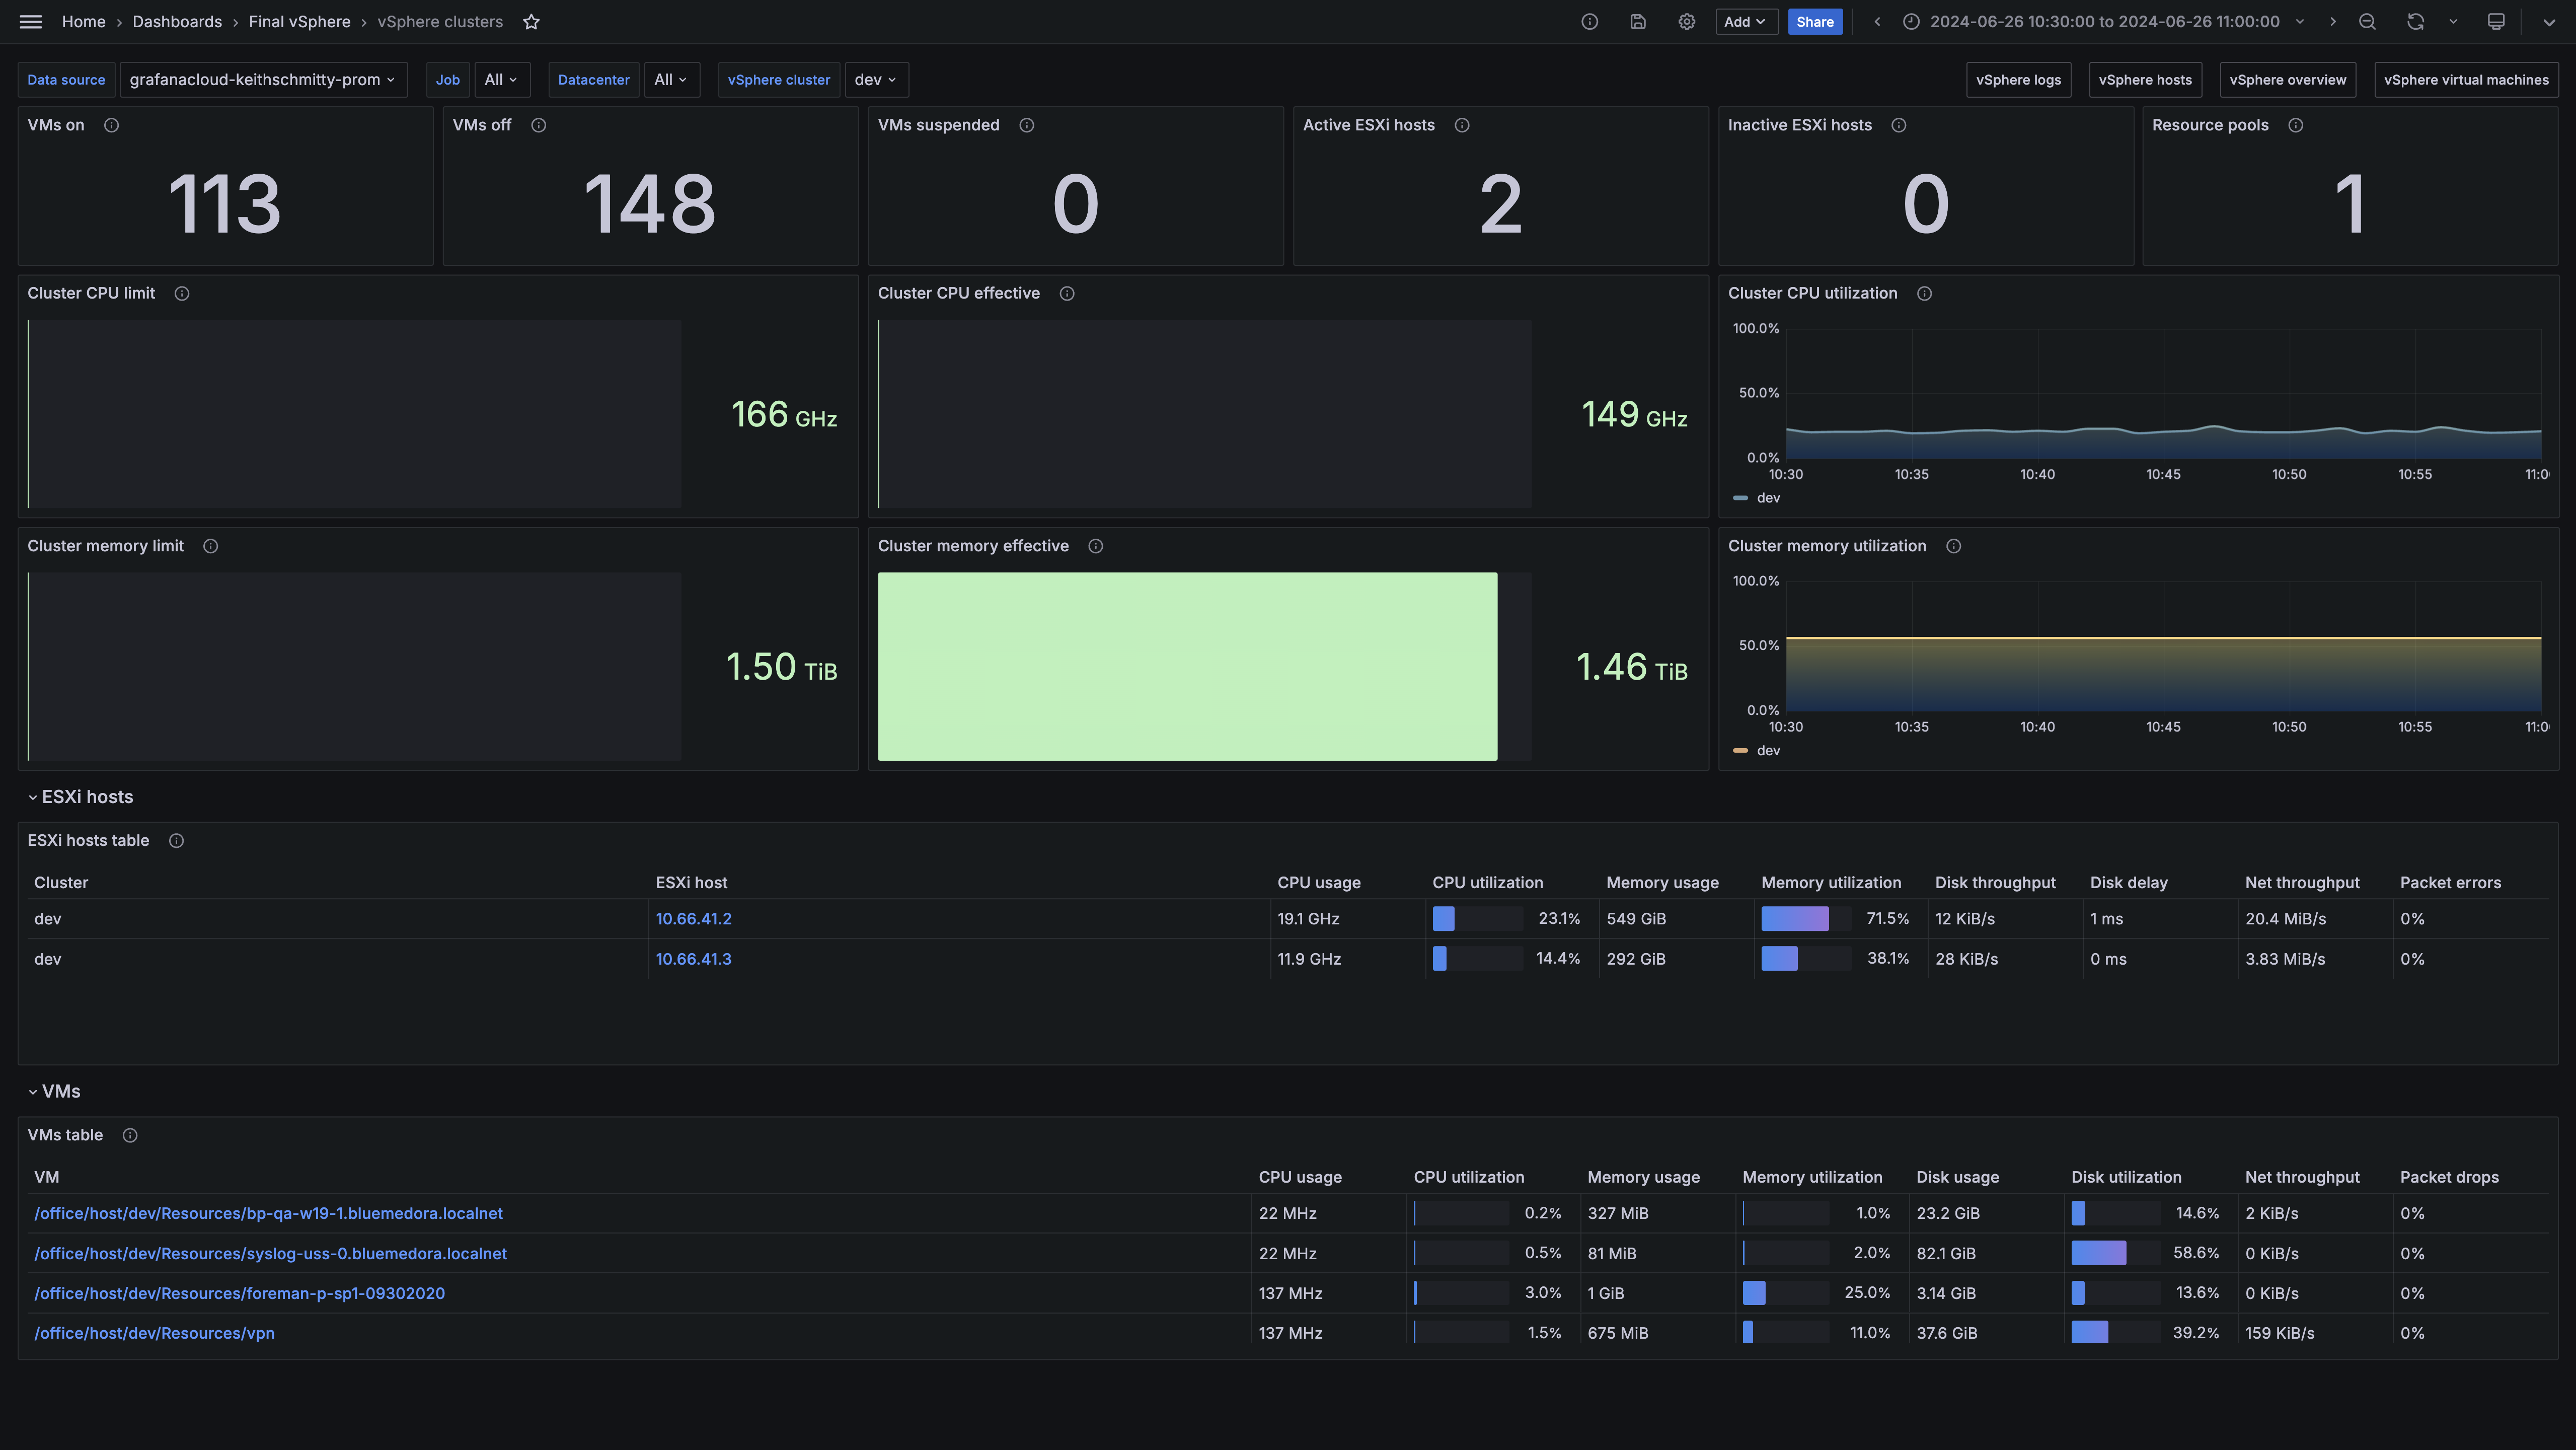
This integration includes 5 useful alerts and 5 pre-built dashboards to help monitor and visualize vSphere metrics and logs.
Before you begin
Metrics
A “Read Only” user assigned to a vSphere is required. This user must have permissions to the vCenter server, cluster and all subsequent resources being monitored in order to retrieve information about them.
In order to capture key vSphere metrics, you must set your Statistics Collection Level to at least level 2 as described here.
The minimum version of Alloy which supports this integration is v1.2.0. Because the otelcol.receiver.vcenter component is still experimental in v1.2.0, you will need to run Alloy with the –stability.level=experimental flag.
Logs
There are two recommended approaches for collecting vCenter logs, and both involve configuring remote syslog forwarding. Refer to Forward vCenter Server Log Files to Remote Syslog Server in the VMWare documentation for more information.
The first option is to have Alloy intercept the incoming syslogs using the loki.source.syslog component.
The second is to have Alloy read syslogs from a file using the loki.source.file component. This option will require the path that syslogs are being written to.
For either option, you can install Alloy on the existing machine that logs are forwarded to, or you can install it on a secondary machine. If you don’t install Alloy on the primary machine, you must modify the remote syslog forwarding configuration to have a second entry that forwards syslogs to the machine where Alloy is installed.
Install vSphere integration for Grafana Cloud
- In your Grafana Cloud stack, click Connections in the left-hand menu.
- Find vSphere and click its tile to open the integration.
- Review the prerequisites in the Configuration Details tab and set up Grafana Agent to send vSphere metrics and logs to your Grafana Cloud instance.
- Click Install to add this integration’s pre-built dashboards and alerts to your Grafana Cloud instance, and you can start monitoring your vSphere setup.
Configuration snippets for Grafana Alloy
Advanced mode
The following snippets provide examples to guide you through the configuration process.
To instruct Grafana Alloy to scrape your vSphere instances, manually copy and append the snippets to your alloy configuration file, then follow subsequent instructions.
Advanced integrations snippets
otelcol.receiver.vcenter "integrations_vsphere" {
    endpoint = "https://<vcenter-hostname>:<vcenter-port>"
    username = "<vcenter-user>"
    password = "<vcenter-password>"

    tls {
        insecure = true
    }

    output {
        metrics = [otelcol.processor.batch.integrations_vsphere.input]
    }
}

otelcol.processor.batch "integrations_vsphere" {
    output {
        metrics = [otelcol.processor.transform.integrations_vsphere.input]
    }
}

otelcol.processor.transform "integrations_vsphere" {
    error_mode = "ignore"

    metric_statements {
        context = "resource"
        statements = [
            `set(attributes["job"], "integrations/vsphere") where attributes["job"] == nil`,
        ]
    }

    output {
        metrics = [otelcol.exporter.prometheus.integrations_vsphere.input]
    }
}

otelcol.exporter.prometheus "integrations_vsphere" {
    forward_to = [prometheus.remote_write.metrics_service.receiver]

    resource_to_telemetry_conversion = true
}
This integration uses the otelcol.receiver.vcenter component to collect VMware vSphere metrics from a vCenter Server. Configure the following properties according to your environment:
endpoint: This must be set to the vCenter Server. The expected format is:// : . username: This must be set to the user used to collect metrics from the vCenter Server.password: This must be set to the password for the user used to collected metrics from the vCenter Server.tls: Here a user must set options based on the vCenter Server’s TLS configuration.
These metrics are first fed into the otelcol.processor.batch component to reduce the number of outgoing network requests required to transmit data.
Then they are fed into the otelcol.processor.transform component which will add a job label with a value of integrations/vsphere onto every metric.
Finally, the otelcol.exporter.prometheus component is used to convert the OTLP formatted metrics to Prometheus formatted metrics. Here OTEL resource attributes are converted to prometheus labels on each metric as well.
Advanced logs snippets
linux
loki.source.syslog "integrations_vsphere" {
    forward_to = [loki.process.integrations_vsphere_drop.receiver]

    listener {
        address = "<vcenter-host>:<vcenter-syslog-port>"
        protocol = "tcp"
        use_rfc5424_message = true
        labels = {
            job = "integrations/vsphere",
        }
    }
}

loki.process "integrations_vsphere_drop" {
    forward_to = [loki.process.integrations_vsphere_labels.receiver]

    stage.regex {
        expression = "^<\\S+>\\S* \\d+-\\d+-\\d+T\\d+:\\d+:\\d+\\.\\d+Z (?<instance>\\S+) (?<log_type>\\S+) .*$"
    }

    stage.labels {
        values = {
            log_type = "",
            instance = "",
        }
    }

    stage.match {
        selector = "{log_type=~\".+\", log_type!=\"vpxd-main\", log_type!=\"vpxd-svcs-main\", log_type!=\"analytics\", log_type!=\"applmgmt\"}"
        action = "drop"

        drop_counter_reason = "vsphere_non_priority_logs"
    }
}

loki.process "integrations_vsphere_labels" {
    forward_to = [loki.write.grafana_cloud_loki.receiver]

    stage.match {
        selector = "{log_type=\"vpxd-main\"}"

        stage.regex {
            expression = "^.*vpxd-main \\S+ \\S+ \\S+ \\d+-\\d+-\\d+T\\d+:\\d+:\\d+\\.\\d+Z (?<level>\\w+)\\s+.*$"
        }

        stage.labels {
            values = {
                level = "",
            }
        }
    }

    stage.match {
        selector = "{log_type=\"vpxd-svcs-main\"}"

        stage.regex {
            expression = "^.*vpxd-svcs-main \\S+ \\S+ \\S+ \\d+-\\d+-\\d+T\\d+:\\d+:\\d+\\.\\d+Z \\[\\S+ \\[\\S*\\] (?<level>\\w+)\\s+.*$"
        }

        stage.labels {
            values = {
                level = "",
            }
        }
    }

    stage.match {
        selector = "{log_type=\"applmgmt\"}"

        stage.regex {
            expression = "^.+applmgmt \\S+ \\S+ \\S+ \\d+-\\d+-\\d+T\\d+:\\d+:\\d+ \\S+ \\S+ \\[\\S+\\](?<level>\\w+):.*$"
        }

        stage.labels {
            values = {
                level = "",
            }
        }
    }

    stage.match {
        selector = "{log_type=\"analytics\"}"

        stage.regex {
            expression = "^.*analytics \\S+ \\S+ \\S+ \\d+-\\d+-\\d+T\\d+:\\d+:\\d+\\.\\d+Z \\S+\\s+(?<level>\\w+)\\s+.*$"
        }

        stage.labels {
            values = {
                level = "",
            }
        }
    }

    stage.template {
        source = "level"
        template = "{{ ToLower .Value }}"
    }

    stage.labels {
        values = {
            "level" = "",
        }
    }
}

// NOTE: The following configuration is for systems where Alloy will read syslog from a file.
// loki.source.file "integrations_vsphere" {
//     targets = [{__path__ = <path/to/syslog_file.log>}]
//     forward_to = [loki.process.integrations_vsphere_drop.receiver]
// }
// loki.process "integrations_vsphere_drop" {
//     forward_to = [loki.process.integrations_vsphere_labels.receiver]
//     stage.regex {
//         expression = "^\\S+\\s+\\d+ \\d{2}:\\d{2}:\\d{2} (?P<instance>\\S+) (?P<log_type>\\S+) .*$"
//     }
//     stage.static_labels {
//         values = {
//             job = "integrations/vsphere",
//         }
//     }
//     stage.labels {
//         values = {
//             log_type = "",
//             instance = "",
//         }
//     }
//     stage.match {
//         selector = "{log_type=~\".+\", log_type!=\"vpxd-main\", log_type!=\"vpxd-svcs-main\", log_type!=\"analytics\", log_type!=\"applmgmt\"}"
//         action = "drop"
//         drop_counter_reason = "vsphere_non_priority_logs"
//     }
// }
// loki.process "integrations_vsphere_labels" {
//     forward_to = [loki.write.grafana_cloud_loki.receiver]
//     stage.match {
//         selector = "{log_type=\"vpxd-main\"}"
//         stage.regex {
//             expression = "^.*vpxd-main \\S+ (?P<level>\\w+) .*$"
//         }
//         stage.labels {
//             values = {
//                 level = "",
//             }
//         }
//     }
//     stage.match {
//         selector = "{log_type=\"vpxd-svcs-main\"}"
//         stage.regex {
//             expression = "^.*vpxd-svcs-main \\S+ \\S+ \\[\\S*] (?P<level>\\w+) .*$"
//         }
//         stage.labels {
//             values = {
//                 level = "",
//             }
//         }
//     }
//     stage.match {
//         selector = "{log_type=\"applmgmt\"}"
//         stage.regex {
//             expression = "^.+applmgmt \\d+-\\d+-\\S+ \\S+ \\S+ \\[\\S+\\](?P<level>\\w+):.*$"
//         }
//         stage.labels {
//             values = {
//                 level = "",
//             }
//         }
//     }
//     stage.match {
//         selector = "{log_type=\"analytics\"}"
//         stage.regex {
//             expression = "^.*analytics \\S+ \\S+  (?P<level>\\w+).*$"
//         }
//         stage.labels {
//             values = {
//                 level = "",
//             }
//         }
//     }
//     stage.template {
//         source = "level"
//         template = "{{ ToLower .Value }}"
//     }
//     stage.labels {
//         values = {
//             "level" = "",
//         }
//     }
// }
To monitor your VMware Appliance Management Service (applmgmt), VMware Analytics (analytics), and VMware vCenter Server (vpxd) logs, you will use one of the two following components.
For systems where Alloy is intercepting incoming syslogs: The loki.source.syslog component defines a syslog listener and the list of receivers to forward syslogs to. Change the following properties according to your environment:
address: This<vcenter-host:vcenter-syslog-port>address will inform the syslog component about where to listen in order to receive syslogs from the vCenter Server’s remote syslog forwarding configuration.<vcenter-host>must match the vCenter Server’s IP address<vcenter-syslog-port>must match the vCenter Server’s remote syslog forwarding configuration.
protocol: Can be set to eithertcporudp.
For systems where Alloy is reading from a syslog file:
The loki.source.file component reads the log entries from the syslog files, then forwards them to loki.process.integrations_vsphere_drop.receiver.
Change the follow properties according to your environment:
targets: The list of syslog files to read from.
Combine one of the former components with the loki.process component to define how to process logs before sending them to Loki.
Dashboards
The vSphere integration installs the following dashboards in your Grafana Cloud instance to help monitor your system.
- vSphere clusters
- vSphere hosts
- vSphere logs
- vSphere overview
- vSphere virtual machines
vSphere overview

vSphere overview (hosts)

vSphere clusters

Alerts
The vSphere integration includes the following useful alerts:
| Alert | Description |
|---|---|
| VSphereHostInfoCpuUtilization | Info: CPU is approaching a high threshold of utilization for an ESXi host. High CPU utilization may lead to performance degradation and potential downtime for virtual machines running on a host. |
| VSphereHostWarningMemoryUtilization | Warning: Memory is approaching a high threshold of utilization for an ESXi host. High memory utilization may cause the host to become unresponsive and impact the performance of virtual machines running on this host. |
| VSphereDatastoreWarningDiskUtilization | Warning: Disk space is approaching a warning threshold of utilization for a datastore. Low disk space may prevent virtual machines from functioning properly and cause data loss. |
| VSphereDatastoreCriticalDiskUtilization | Critical: Disk space is approaching a critical threshold of utilization for a datastore. Low disk space may prevent virtual machines from functioning properly and cause data loss. |
| VSphereHostWarningHighPacketErrors | Warning: High percentage of packet errors seen for ESXi host. High packet errors may indicate network issues that can lead to poor performance and connectivity problems for virtual machines running on this host. |
Metrics
The most important metrics provided by the vSphere integration, which are used on the pre-built dashboards and Prometheus alerts, are as follows:
- up
- vcenter_cluster_cpu_effective
- vcenter_cluster_cpu_limit
- vcenter_cluster_host_count
- vcenter_cluster_memory_effective_bytes
- vcenter_cluster_memory_limit_bytes
- vcenter_cluster_vm_count
- vcenter_cluster_vm_template_count
- vcenter_datastore_disk_usage_bytes
- vcenter_datastore_disk_utilization_percent
- vcenter_host_cpu_usage_MHz
- vcenter_host_cpu_utilization_percent
- vcenter_host_disk_latency_avg_milliseconds
- vcenter_host_disk_throughput
- vcenter_host_memory_usage_mebibytes
- vcenter_host_memory_utilization_percent
- vcenter_host_network_packet_error_rate
- vcenter_host_network_packet_rate
- vcenter_host_network_throughput
- vcenter_host_network_usage
- vcenter_resource_pool_cpu_shares
- vcenter_resource_pool_cpu_usage
- vcenter_resource_pool_memory_shares
- vcenter_resource_pool_memory_usage_mebibytes
- vcenter_vm_cpu_usage_MHz
- vcenter_vm_cpu_utilization_percent
- vcenter_vm_disk_latency_avg_milliseconds
- vcenter_vm_disk_throughput
- vcenter_vm_disk_usage_bytes
- vcenter_vm_disk_utilization_percent
- vcenter_vm_memory_ballooned_mebibytes
- vcenter_vm_memory_swapped_mebibytes
- vcenter_vm_memory_usage_mebibytes
- vcenter_vm_memory_utilization_percent
- vcenter_vm_network_packet_drop_rate
- vcenter_vm_network_packet_rate
- vcenter_vm_network_throughput_bytes_per_sec
- vcenter_vm_network_usage
Changelog
# 1.0.2 - November 2024

- Update status panel check queries

# 1.0.1 - September 2024

- Make selector variables persist after using a dashboard link
- Update logging documentation to clarify options for collecting syslog with Alloy

# 1.0.0 - July 2024

- Initial release
Cost
By connecting your vSphere instance to Grafana Cloud, you might incur charges. To view information on the number of active series that your Grafana Cloud account uses for metrics included in each Cloud tier, see Active series and dpm usage and Cloud tier pricing.


