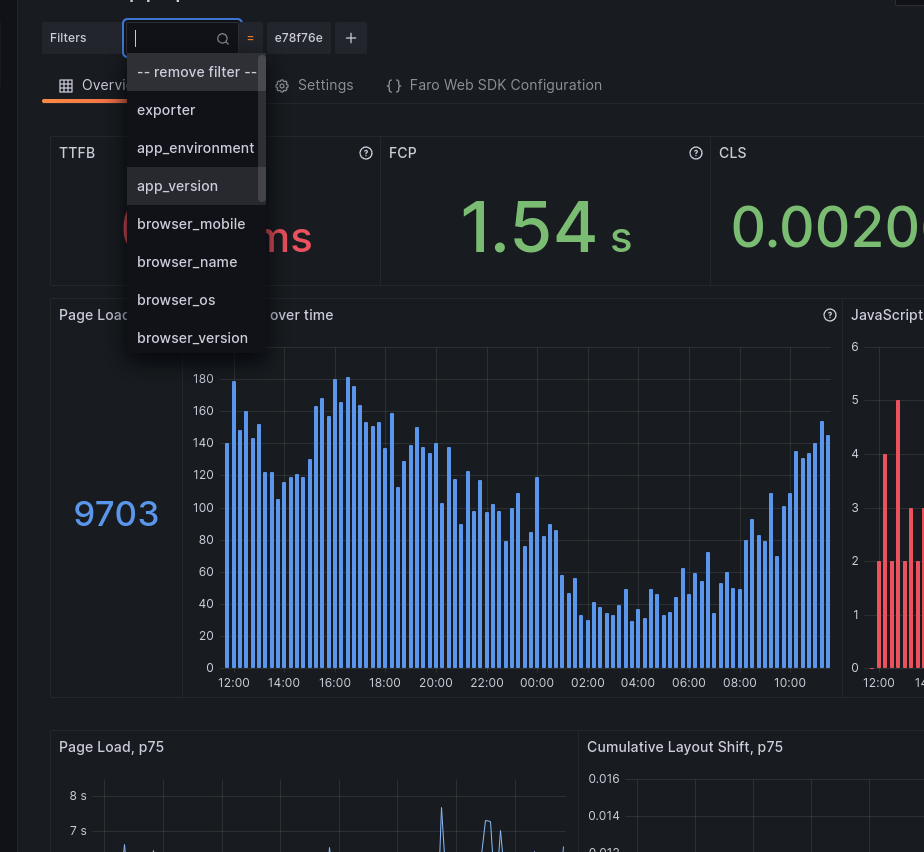
Application errors overview
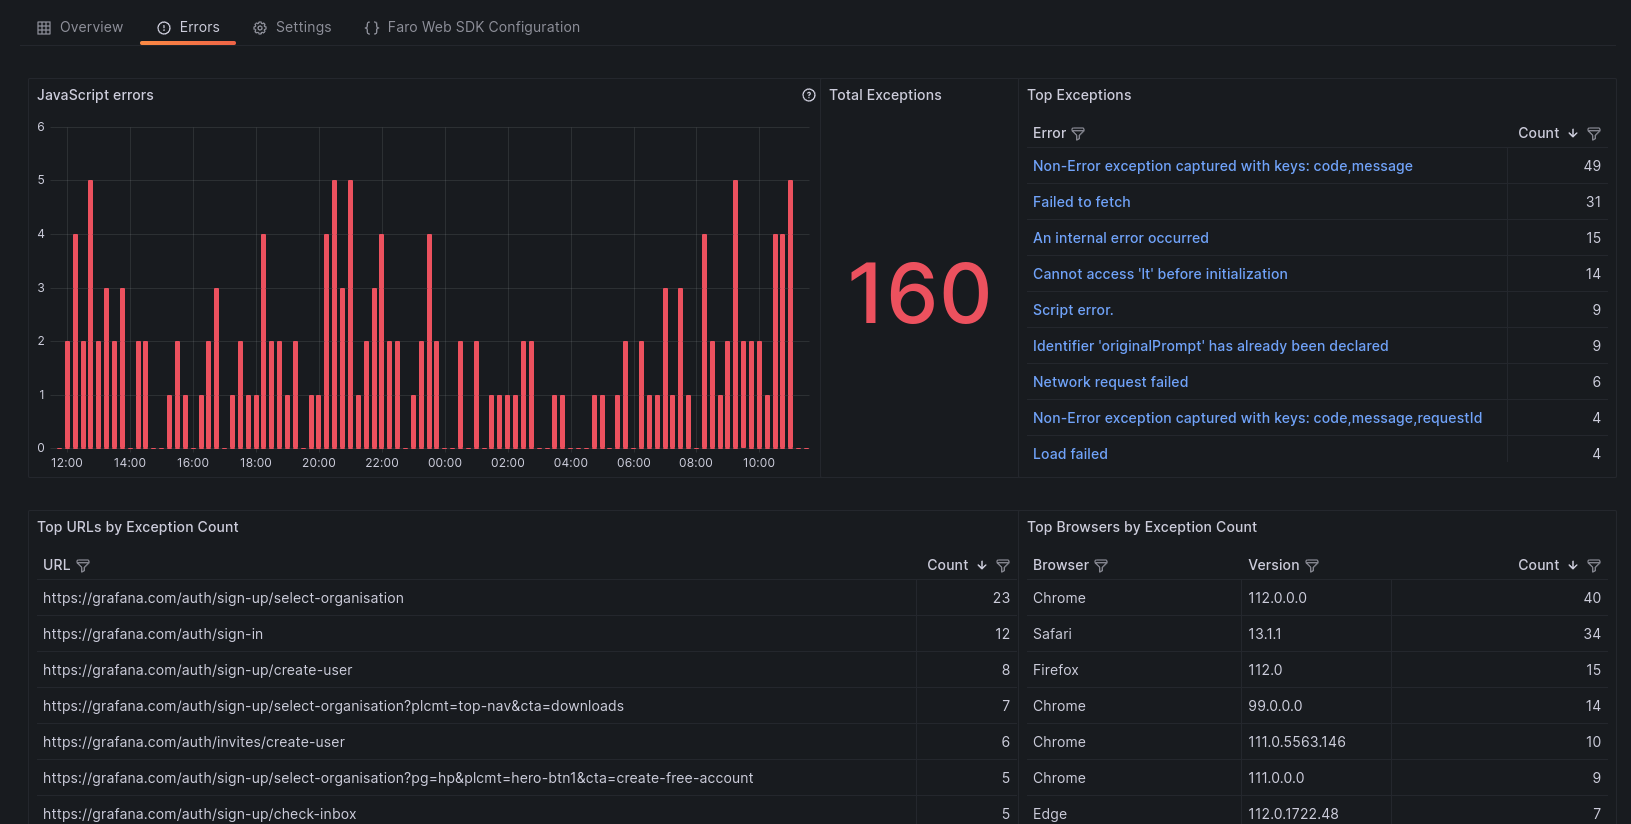
The Errors Overview page gives insights into your application’s errors:
- View how many errors your application is generating within a given time frame
- Filter results based on an error
- Filter out noisy errors
- Inspect error context: stack trace, session ids, metadata
- Identify dominant exceptions
- Identify URLs that are generating errors
- Segregate error count based on browsers
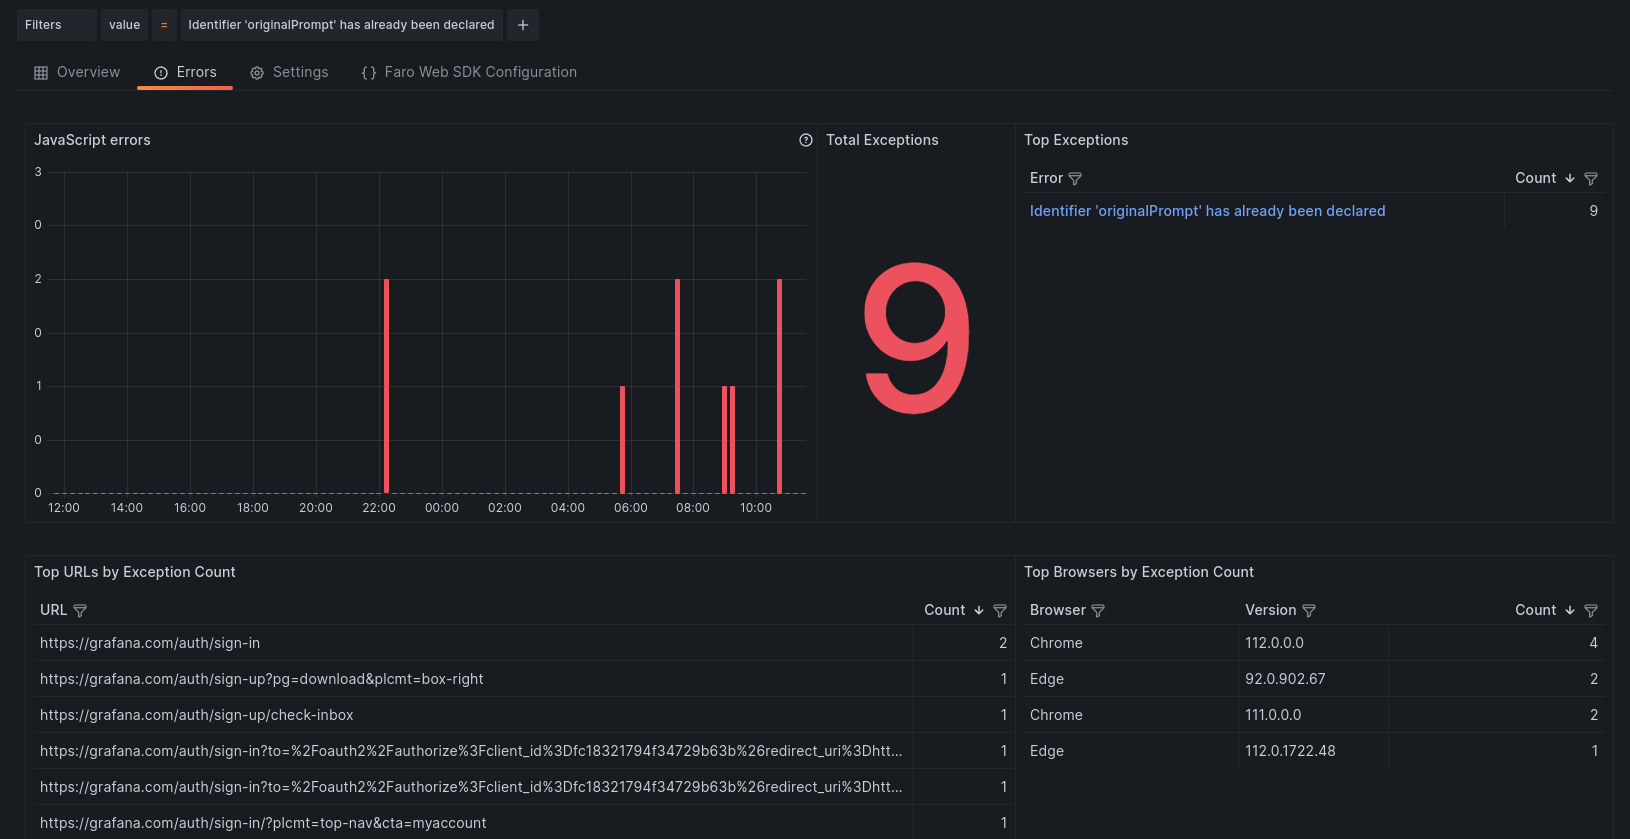
Filter results based on an Error
To isolate the panels based on a specific errors:
- Navigate into the Top Exceptions panel
- Find the Error that you want to filter
- Click the ‘+’ sign, magnifying glass

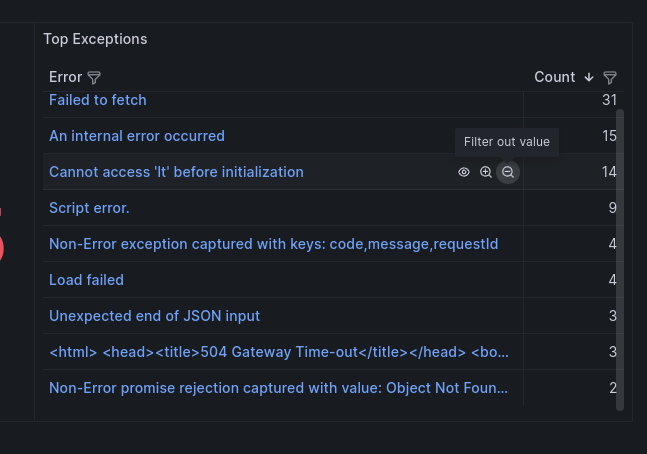
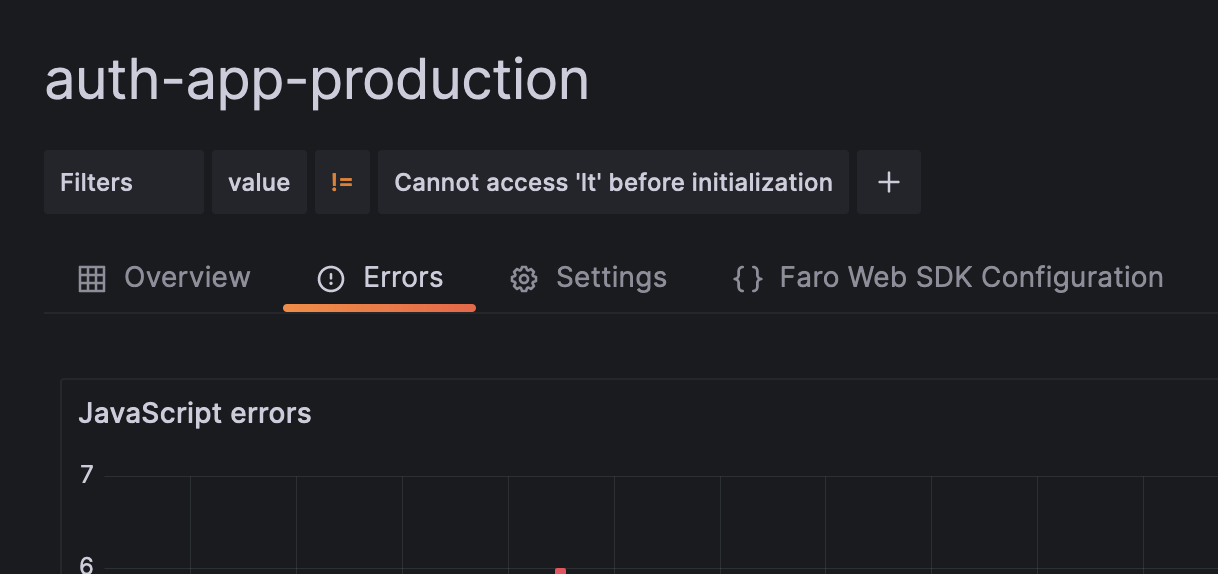
Filter out an Error
To remove an error from the results:
- Navigate into the Top Exceptions panel
- Find the Error that you want to filter
- Click the ‘-’ sign, magnifying glass
View Error context
To expand the Error and context: stack trace, browser, OS, and other metadata.
- Navigate into the Top Exceptions panel
- Find the Error that you want to filter
- Click the name of the blue colored error

You can follow the process above to filter based on:
- URL paths on the Top URLs by Exception Count panel
- Browser Name on the Browser column of the Top Browsers by Exception Count
- Browser Version on the Version column of the Top Browsers by Exception Count
Adding a meta filter
You can also add other metadata filters as you would in the Performance Overview page. To add a meta filter:
- Click the ‘+’ button
- Select the meta label that you want from the drop-down
- Select the value from the drop-down

To edit a meta filter value:
- Click the value of the filter you want to change
- Select the new value from the drop-down
To remove a meta filter
- Click the label of the filter you want to remove
- Select ‘–remove filter–’ from top the drop-down list
