CloudWatch metrics
Send your Amazon CloudWatch data from multiple AWS regions to Grafana Cloud. Metrics data is stored in Prometheus format. You can:
- Query and alert on metrics data using the power of PromQL.
- Ingest the tags from your AWS instance to make them available for querying and alerting. This allows you to identify what a particular resource is, without visiting your AWS Management Console.
After configuration, CloudWatch metrics:
- Continuously pulls metrics that have tags applied to them from CloudWatch
- Pushes these metrics to your hosted metrics instance in Grafana Cloud
Then you can drill into your data and identify issues.
Note
For AWS to ingest metrics from CloudWatch into Grafana Cloud, you must set at least one tag on a resource in AWS.
With CloudWatch metrics, you can:
- Pull CloudWatch metrics from multiple AWS accounts and regions, without installing the Grafana Agent.
- Create multiple scrape jobs to separate data. A scrape job is a set of configurations that dictate which services, regions, and AWS accounts to collect data from.
- Ingest the tags from your AWS instance, and make them available for querying and alerting.
- Query and alert on metrics data using the Prometheus query language (PromQL).
- Use out-of-the-box dashboards for different services, so you don’t need to build them.
How it works
CloudWatch metrics processes metrics in the following way.
Scrape jobs
When you create scrape jobs to collect data, you can specify jobs that logically split your data, and scrape any number of AWS accounts to better organize your data.
CloudWatch data access
When you create a scrape job, Grafana needs access to the CloudWatch data available in your account. CloudWatch metrics uses AWS account delegation to grant this access. Grafana can then assume a role that has access only to your CloudWatch data, with no need to share access and secret keys.
Metrics collection and storage
For every scrape job, an open source exporter continually pulls metrics from CloudWatch and stores them in a Prometheus format in Grafana Cloud.
Then you can use PromQL to query metrics later at no additional cost.
PromQL allows you to run familiar expressions, such as aws_ec2_cpuutilization_maximum{region=“eu-west-2”, scrape_job=”myEC2Job”}.
Included services
You can use Grafana Cloud to connect over 60 of the most popular AWS services, including EC2, Lambda, EBS, RDS, S3, ECS, ELB, and Billing. Refer to Services for a complete list of services and what is gathered for each one.
Timestamps in Grafana Cloud and CloudWatch metrics
The timestamp of a metric pulled by CloudWatch metrics is set to the time the metric is pulled. This might seem counterintuitive, but its intent is to simplify the writing of alert queries. The timestamps from CloudWatch metrics always appear more delayed than they actually are.
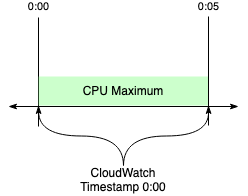
As an example, assume you are looking at a single metric, CPU Maximum, pulled every five minutes. This leads to CloudWatch metrics pulling data with a CloudWatch period of five minutes.
CloudWatch timestamps mark the beginning of a period, not the end.
CloudWatch samples are visible at the beginning of a period and aggregated through the period window.
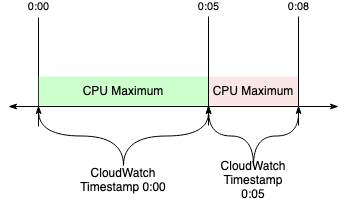
CloudWatch metrics pulls on a consistent interval, and only requests data which has been fully aggregated.
This results in a Grafana Cloud timestamp of 0:08 for a metric CloudWatch stamped at 0:00.
If the CloudWatch timestamp was used instead:
- Metrics would appear to be eight minutes old when ingested.
- Any alert queries written would need to consider this extra variable delay.
The pull timestamp gives the appearance of an eight-minute delay. But actually, only three minutes have passed since the value stopped being updated. This means your alert queries can remain simple.


