Understand your Grafana Cloud Kubernetes Monitoring invoice
Grafana Cloud calculates Kubernetes Monitoring usage based on active host and container hours in a calendar month.
When does host-hours pricing apply?
If you are a self-serve or contract customer and began using Kubernetes Monitoring in Grafana Cloud after September 17, 2024, host-hours billing applies to your Kubernetes Monitoring account.
If you have been using Kubernetes Monitoring in Grafana Cloud prior to September 17, 2024, and you are:
- A self-serve customer, you are billed for active billable series based on the underlying metrics generated. You will remain on this billing model unless you want to migrate to the hourly pricing model. Contact the support team to request moving to the hourly billing model.
- A contract customer, your account team will work with you to transition to the new model.
How does host-hours pricing work?
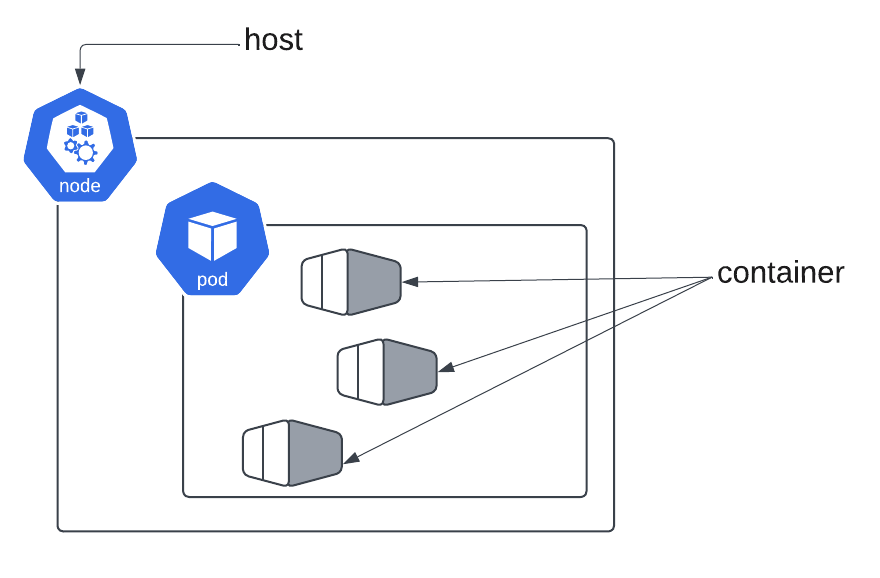
Hourly pricing occurs whenever a host (a node) or a container sends kube-state-metrics to Grafana Cloud.
What is a host?
In a Kubernetes environment, the host is the Kubernetes node as reported by kube-state-metrics.
What is not considered a host?
A Pod (a group of one or more containers) is not considered a host. Pods run within Nodes, which are the actual hosts. For more details, refer to Host-hours pricing for Kubernetes Monitoring.
What is Kubernetes Monitoring usage?
Usage within Kubernetes Monitoring means gathering metrics for Kubernetes infrastructure components, such as:
- Whether a Pod or container is running and healthy
- Whether the workload replicas match the actual replicas
- CPU, memory, network, and storage for Clusters, Nodes, and so on
What is not Kubernetes Monitoring usage?
Usage in Kubernetes Monitoring related to additional functionality is not considered usage within the app. Some examples include using:
- An integration such as Nginx
- An application running within a container that is being monitored by Application Observability
- Frontend Observability
How are host and container hours calculated?
As soon as one minute of host or container activity is captured, your billing begins. The minumum Grafana tracks activity is 15 minutes plus the active time of the host or container. For example, a host that is active for 2 minutes is billed for 17 minutes. The following are some examples:
- Container A: Monitored for 2 minutes. Total billed time = 15 (initial) + 2 (active) = 17 minutes
- Container B: Monitored for 43 minutes. Total billed time = 15 (initial) + 43 (active) = 58 minutes
- Node C: Monitored for 70 minutes. Total billed time = 15 (initial) + 70 (active) = 85 minutes
A host or container is considered active if kube-state-metrics has reported data for the host or container within the last 15 minutes.
Grafana tracks active Kubernetes hosts and containers based on collected kube-state-metrics.
Grafana calculates hours you are billed by multiplying the number of hosts or containers by the number of hours the host or container is active. For example, one host that is active for 24 hours every day for the month is calculated as: 1 host x 24 hours x 30 days = 720 host hours
This example is based on the default of scraping one data point per minute.
Kubernetes Monitoring usage is billed during a calendar month at:
- $0.015 per active host hour
- $0.001 per active container hour
Example pricing table
The following table provides a billing example assuming a month with 30 days for a total of 720 hours. (On your bill, the number of days varies based on the number of days each month.)
| Cluster Name | Hosts | Containers | Active hours per month | Host hours | Container hours | Price per month |
|---|---|---|---|---|---|---|
| Production | 5 | 100 | 100% | 3,600 | 72,000 | $126.00 |
| Staging | 3 | 60 | 50% | 1,080 | 21,600 | $37.80 |
| Development | 1 | 20 | 10% | 72 | 1,440 | $2.52 |
| Total | 4,752 | 95,040 | $166.32 |
Inquire here for volume discounts.
What is included usage?
You may see included host hours or included container hours on your Billing and Usage dashboard. This is the usage included as part of Grafana Cloud professional and advance plans.
If you have a professional or advance plan and you exceed your included usage, standard pricing for metric ingestion are applied metrics that are gathered beyond the included usage amount.
Credit for active series
Kubernetes Monitoring is now established as a core Grafana Cloud application, and its usage is billed separately. Because you are already paying for metrics ingestion, we offset the charge for Kubernetes Monitoring by crediting your account.
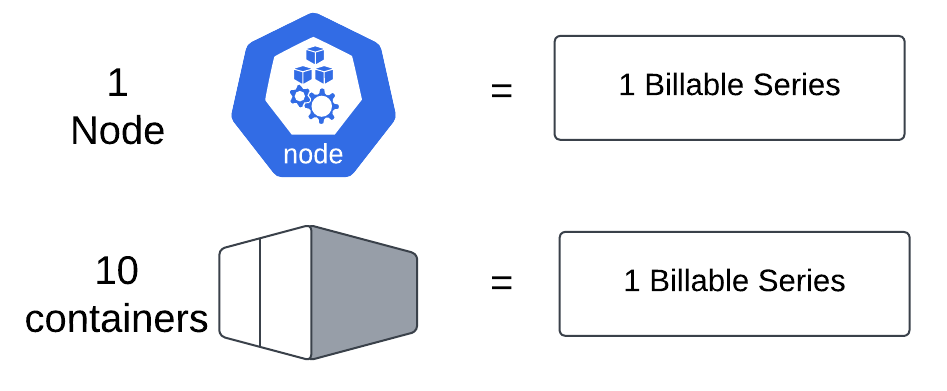
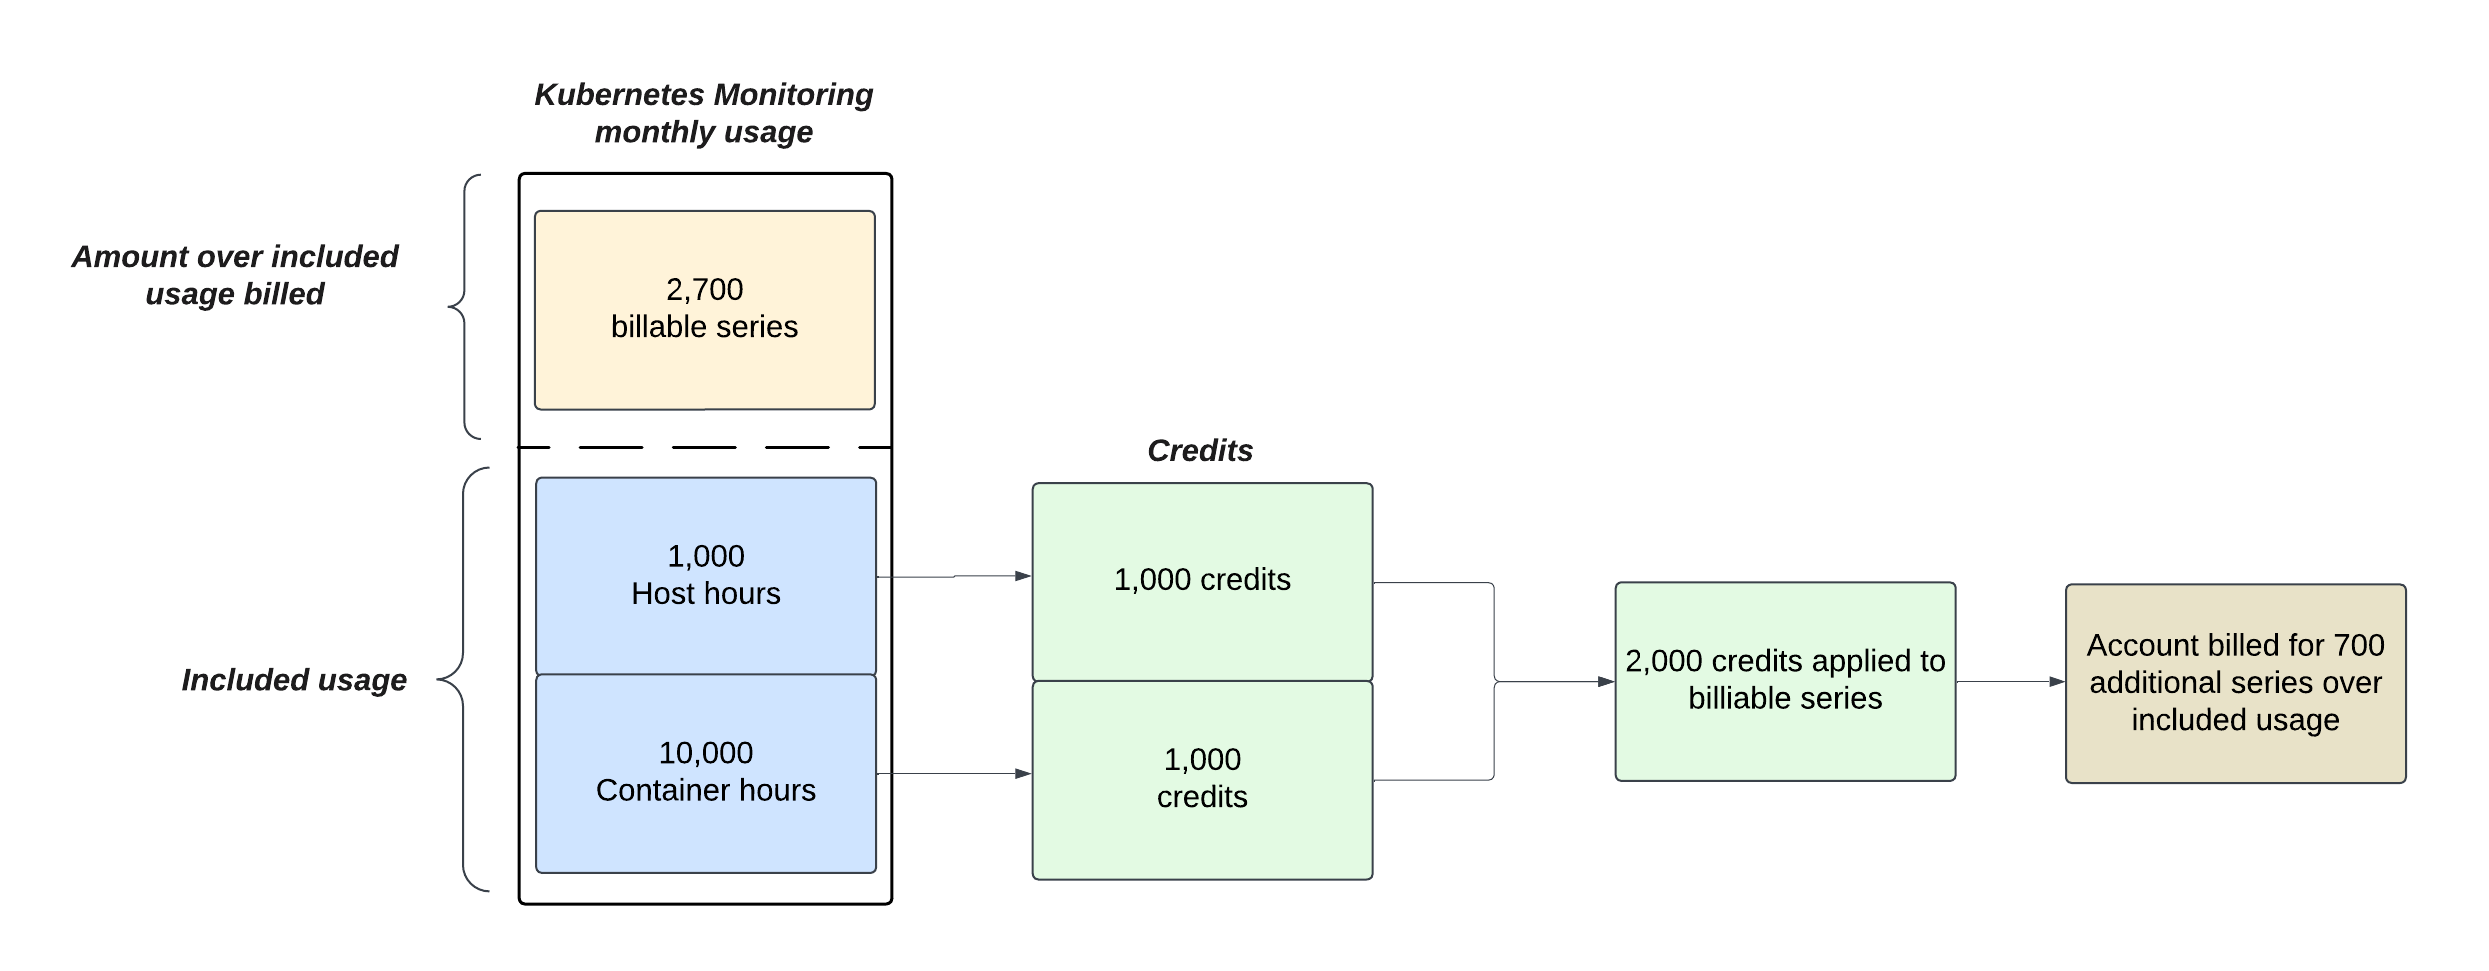
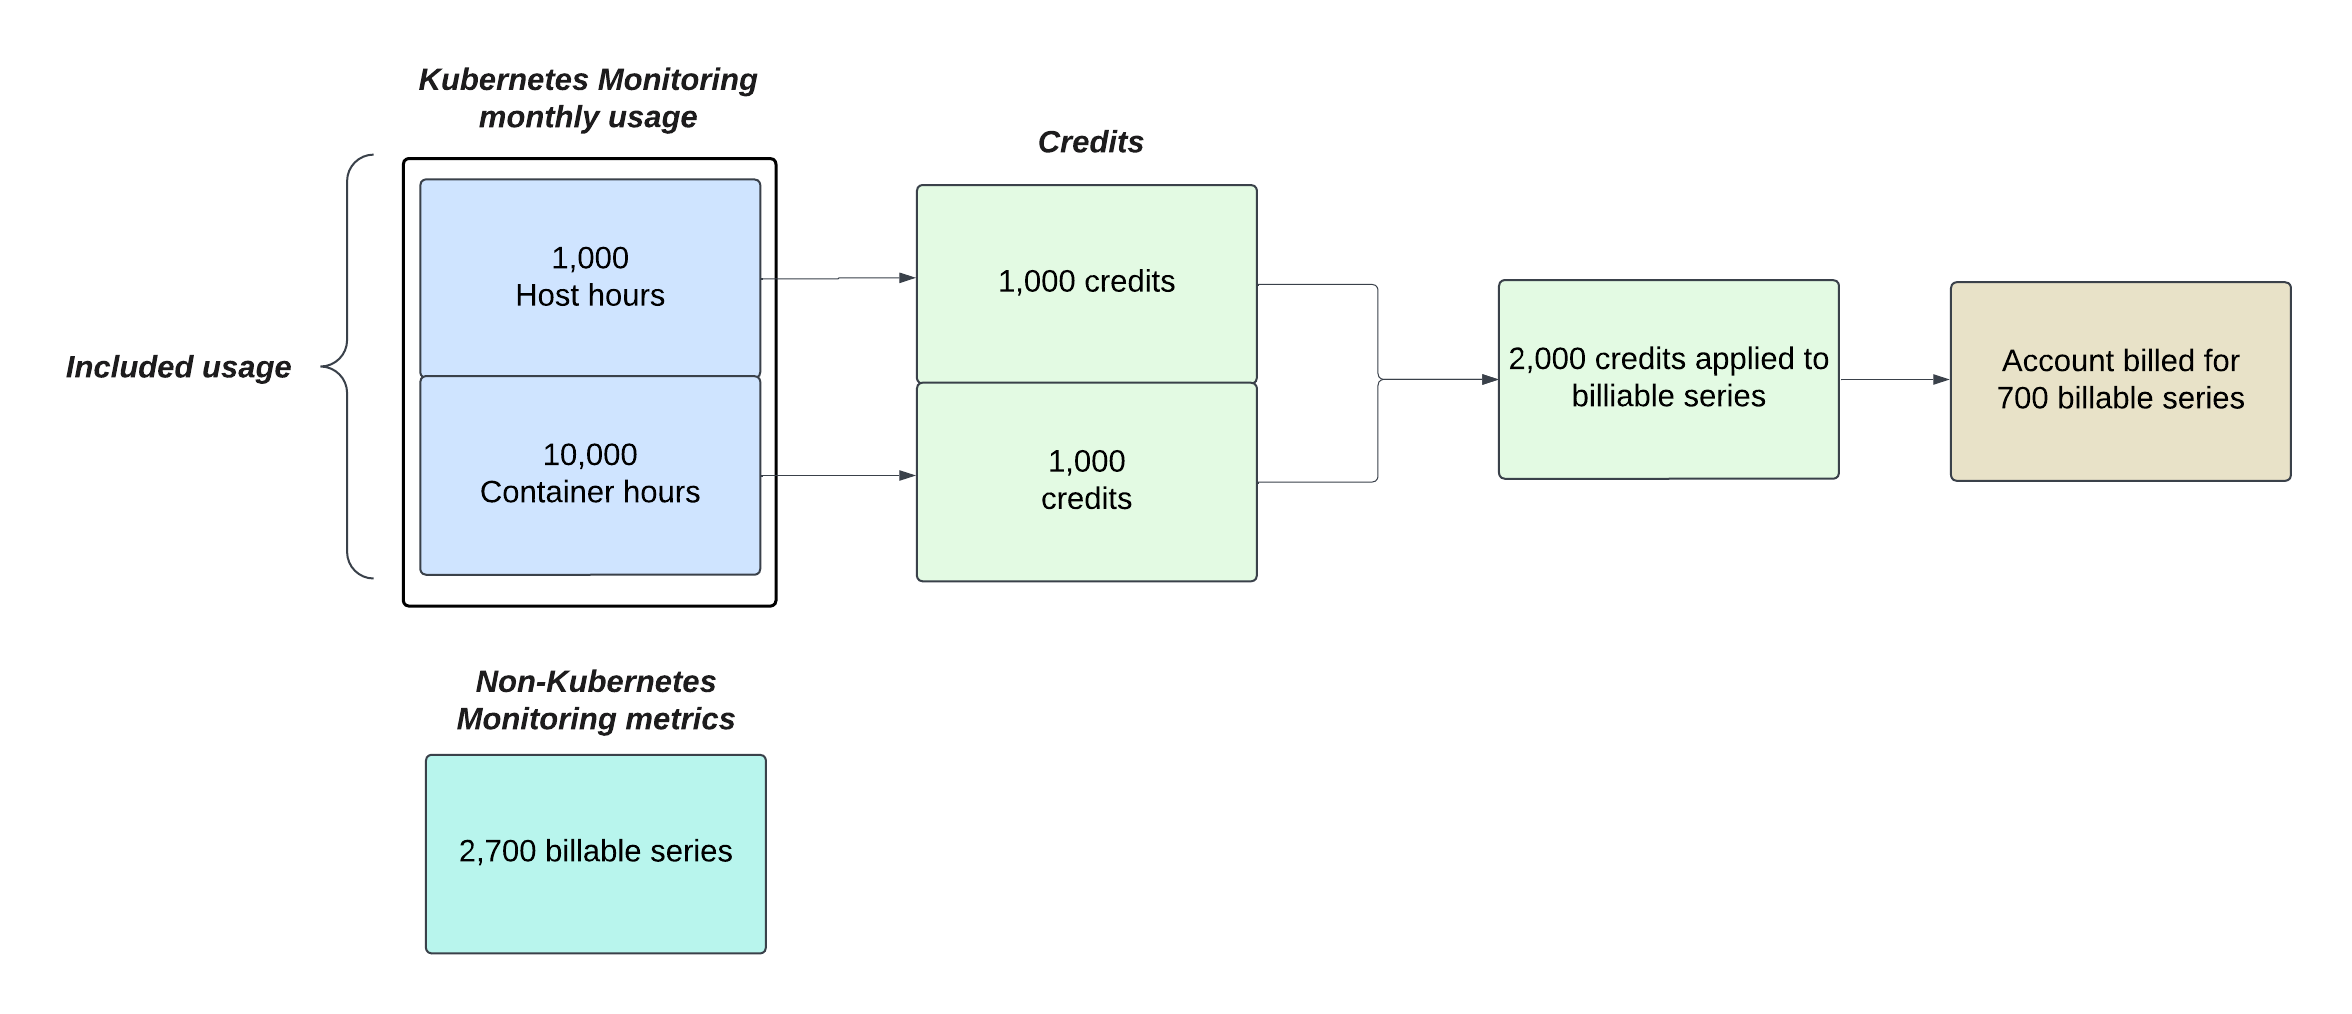
A credit of 1 billable series per active host hour and 0.10 billable series per active container hour is applied to your monthly invoice.
In the following example, this account had 2,700 billable series over the included usage. 2,000 credits is applied to this overage. These credits apply to any metrics ingestion.
In the following example, this account had 2,700 billable series that were not related to Kubernetes Monitoring.
View a usage summary
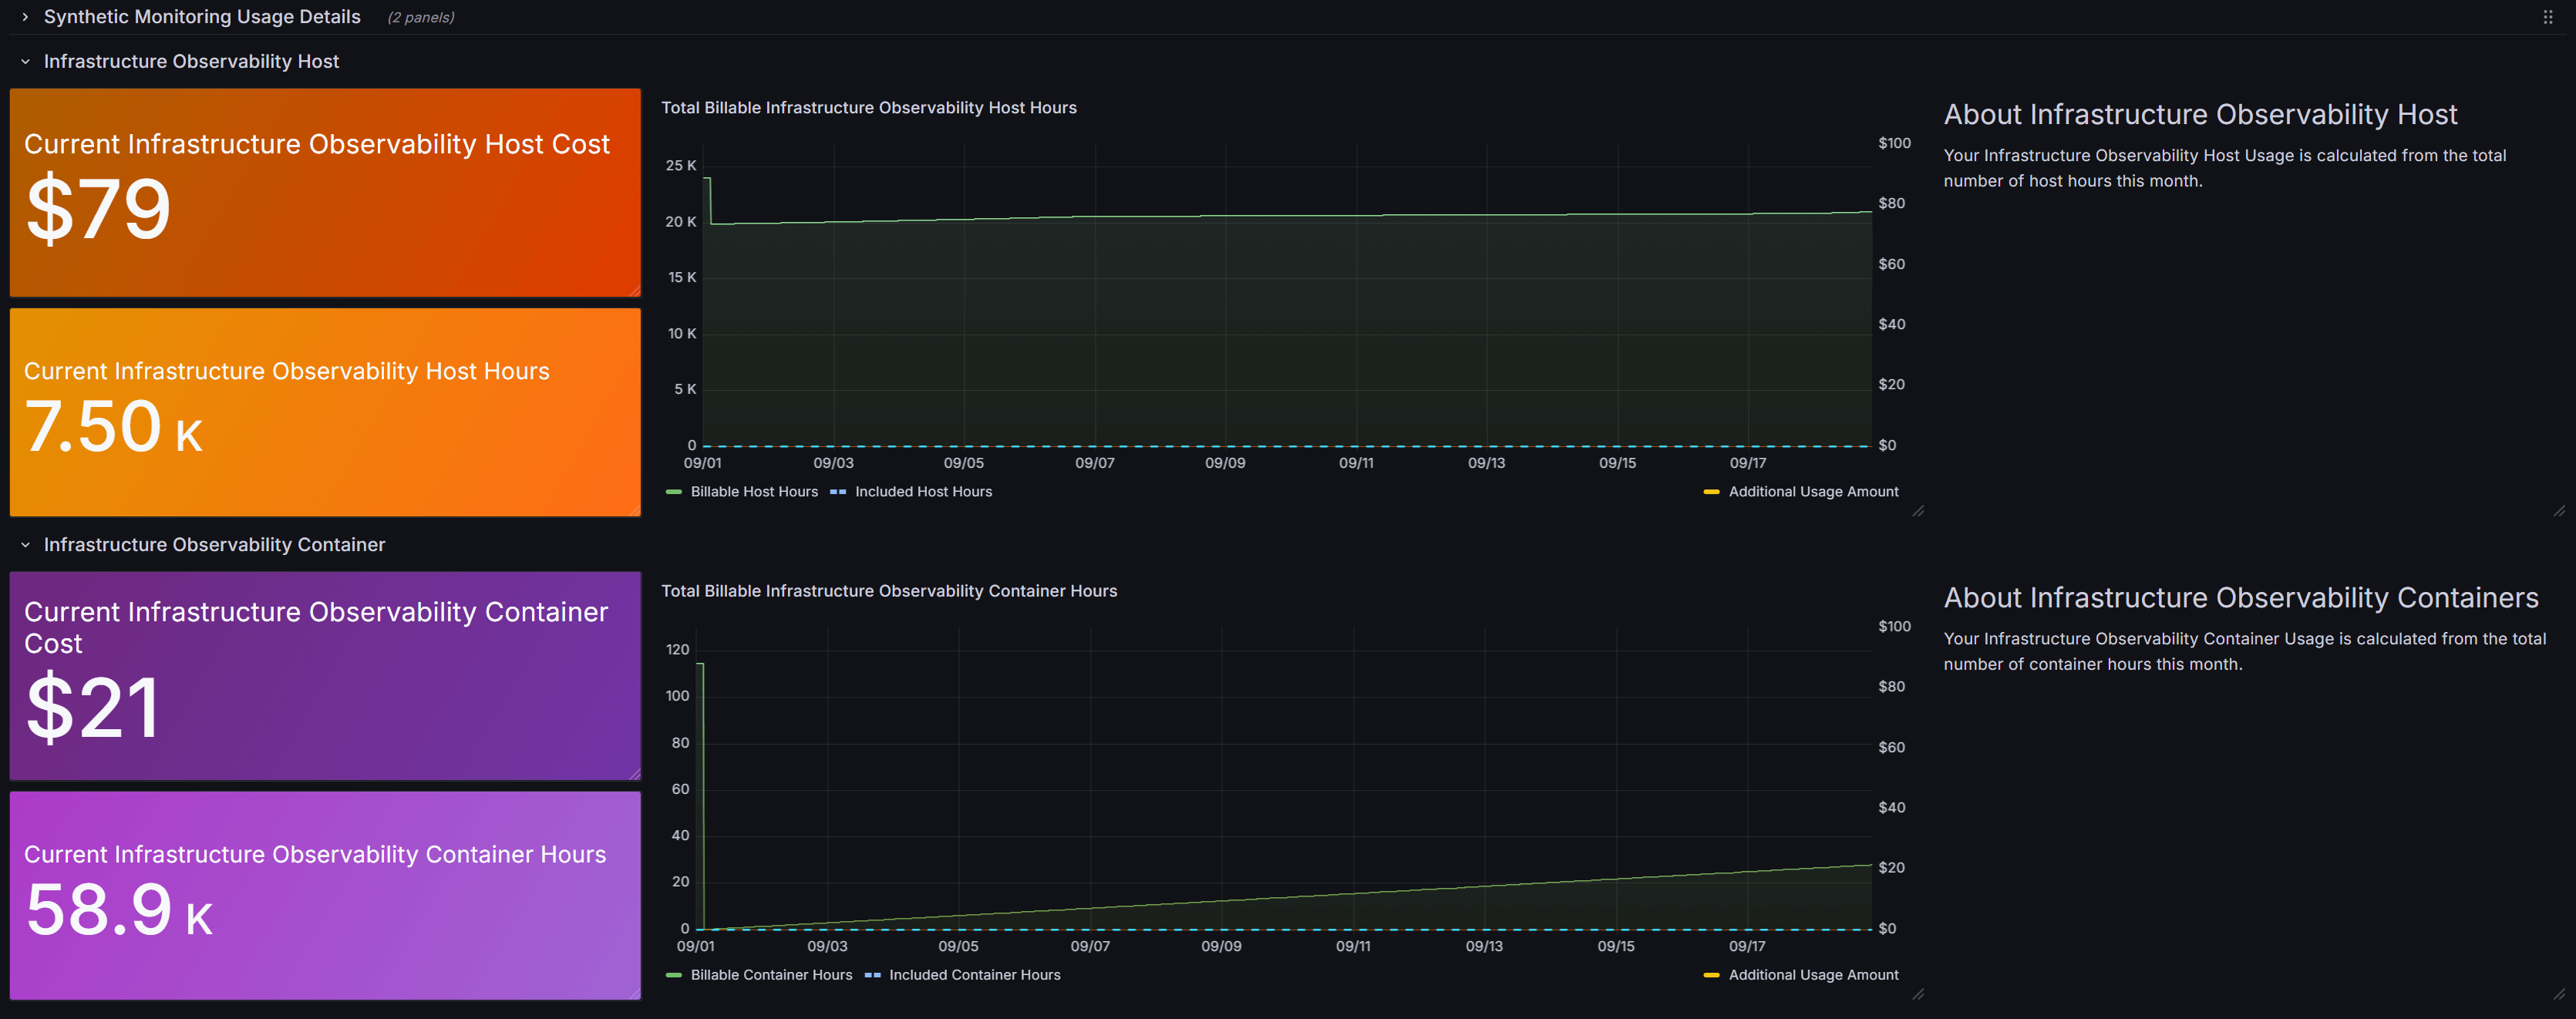
The Billing and Usage dashboard provides a usage summary for all Grafana Cloud services and billable data sources.
Usage details for Kubernetes Monitoring can be found on the panels titled Infrastructure Observability Host and Infrastructure Observability Container.
Find your invoice
You can view your invoice from your Cloud Portal.
To access your invoice:
- Sign in to Grafana Cloud.
- From the left navigation, select Billing > Invoices.
- Select an invoice to view.
The most recent invoice is listed first, and you can view and download it as a PDF or CSV file.
Also refer to Host-hours pricing for Kubernetes Monitoring.


