Set up usage alerts for Grafana Cloud billing
Set up billing usage alerts for Cloud Metrics, Cloud Logs, or Cloud Traces to get notified when your usage has exceeded a set threshold. This can help prevent unexpected charges.
It’s best to set up billing alerts for overall usage or product-level usage.
Before you begin
Make sure you understand how usage is billed:
- For Grafana Cloud Metrics, refer to Active series and DPM.
- For Grafana Cloud Logs, refer to Understand your Grafana Cloud Logs invoice.
Make sure you understand how Grafana alerting and alert routing works.
Set up a billing alert for overall or product usage
To set up billing alerts, the easiest way is to create alerts from panels in the Grafana Cloud billing dashboard.
In your Grafana Cloud instance, go to the Billing/Usage dashboard.
Create an alert:
For overall usage, go to the panel named Current Billable Usage Cost.
For product-level usage cost, go to one of the following panels:
- Current Metrics Usage Cost
- Current Logs Usage Cost
- Current Traces Usage Cost.
Select the vertical ellipsis > More… > New alert rule.
Follow the instructions within the UI.
Enter a name for your alert rule.
In the Define query and alert condition section, set a value for Threshold.
If you set a threshold to
10000in the IS ABOVE field, the alert fires after your month-to-date billable usage has exceeded $10,000.Optionally, you can modify an alert query and condition. For more information, refer to Define query and condition.
In the Set evaluation behavior section, define how the alert is evaluated, and select the evaluation group to put it in.
For more information, refer to Set alert evaluation behavior.
(Optional) In the Add annotations section, add annotations for your alert.
Doing so provides a summary and description about what happened and what the alert rules does.
For example:
- Summary (optional): If the current situation continues, the cost threshold that you set will be exceeded.
- Description (optional): Your usage consumption is currently higher than the alert threshold. To make sure that it’s not a result of very high cardinality or a misconfiguration, refer to the cardinality dashboard. Alternatively, revise your monthly budget.
For more information, refer to Labels and annotations.
In the Configure notifications section, define how your notifications are to be routed.
- Add custom labels to change the way your notifications are routed.
- Preview the routing results.
For more information, refer to Configure notifications.
In the upper right, click Save rule and exit.
Set up additional metrics-usage alerts
Grafana Cloud Metrics uses 95th percentile billing to avoid billing you for temporary spikes in metrics volumes. However, this also means that alerts based on billable series can be slower at detecting increases in metric usage.
If you want more forewarning about increases in metrics usage, we recommend configuring two additional alerts:
- Active series
- Data points per minute (DPM)
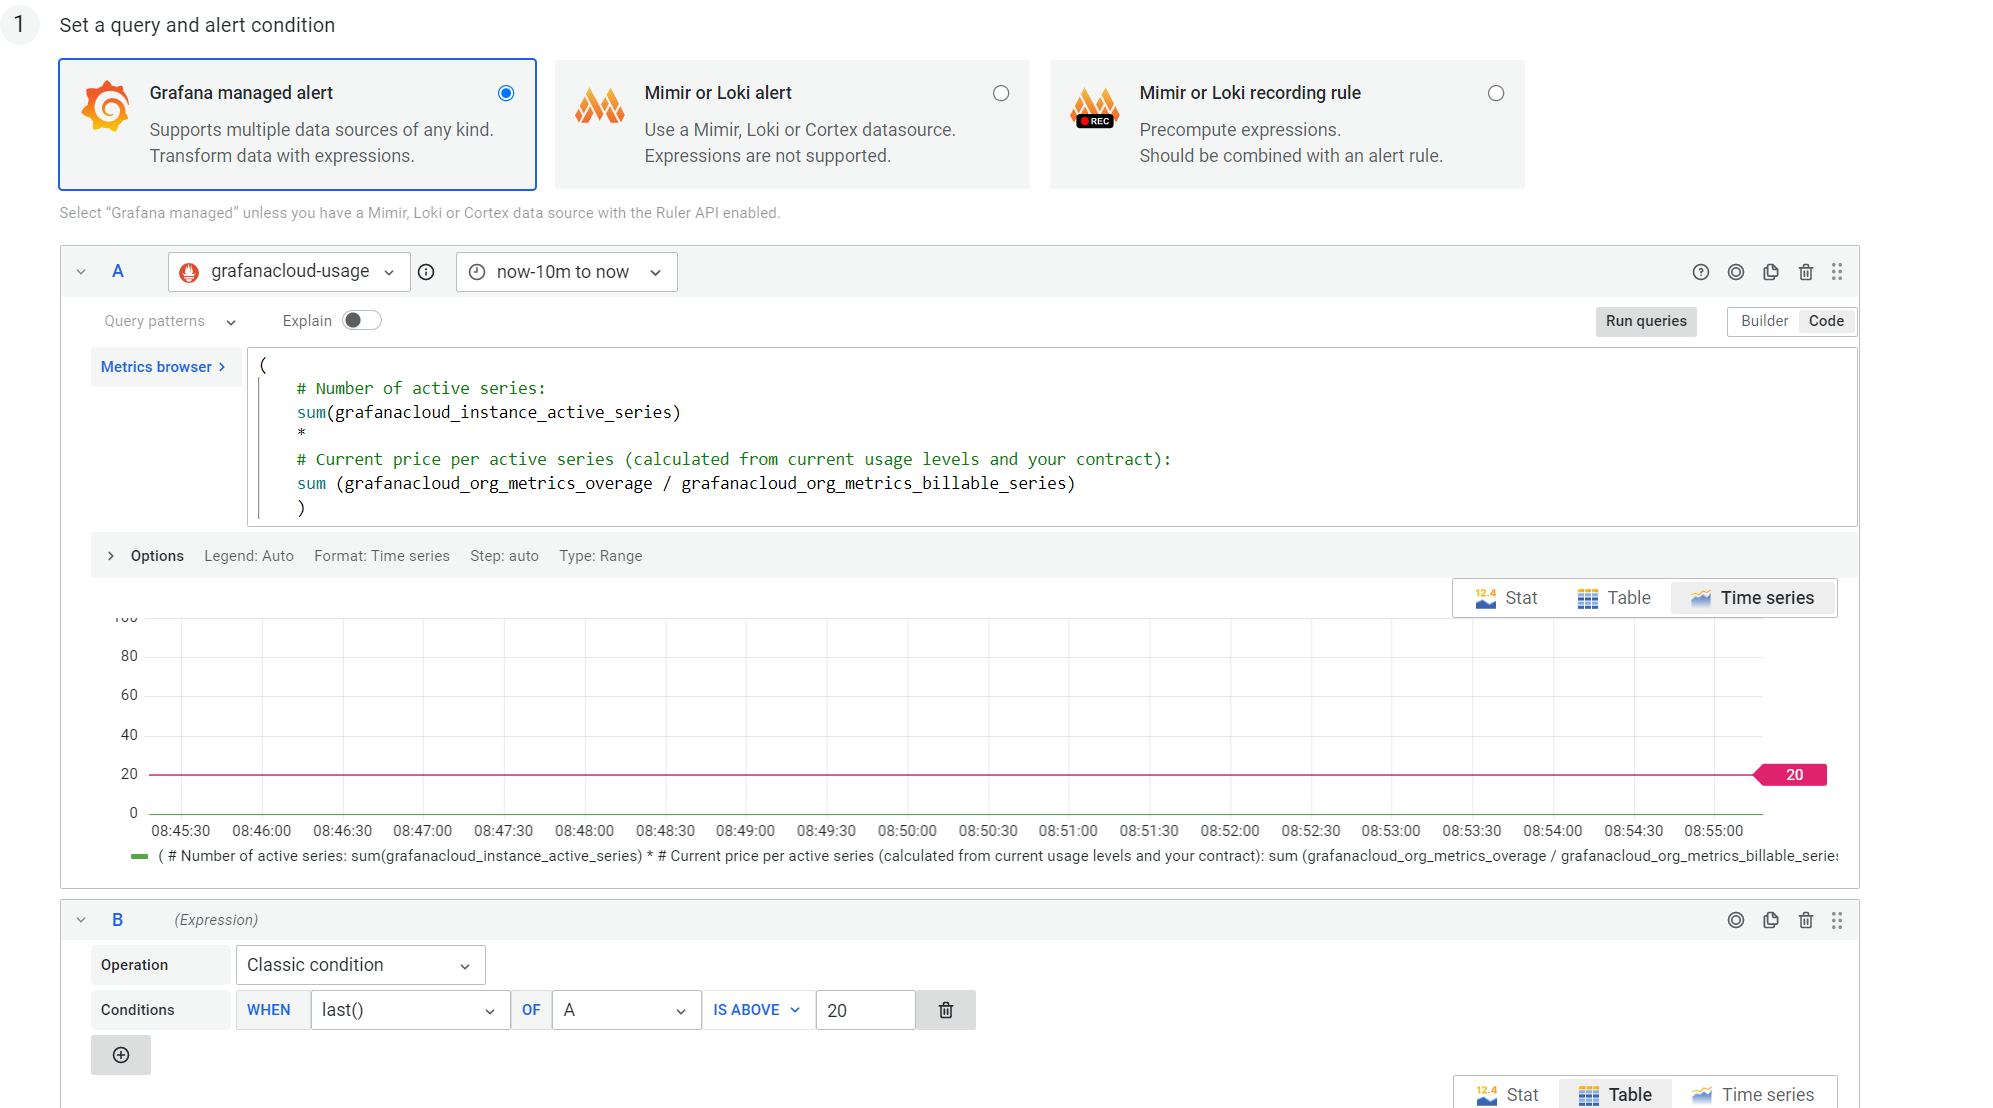
Set up an alert for active series usage
Follow these directions to set up an alert for active series usage.
In your Grafana Cloud instance, navigate to the Alerts & IRM > Alerting > Alert rules.
Click Create alert rule.
Select Grafana managed alert.
In query panel A, select grafanacloud-usage from the data source dropdown menu.
Select the Code option in the upper-right corner of the panel.
Enter the following query:
(
# Number of active series:
sum(grafanacloud_instance_active_series)
*
# Current price per billable-series (calculated from current usage levels and your contract):
sum (grafanacloud_org_metrics_overage) / sum (grafanacloud_org_metrics_billable_series)
)
Run the query if it hasn’t run yet; click Run queries.
Set your budget threshold by dragging the red tab at the right of the graph, or by setting an IS ABOVE condition in the panel that has this threshold setting. This is probably panel B or C.
![Alert setup Alert setup]()
Alert setup Add optional descriptive details to your alert, for example:
- Summary: If your current active series count continues, you will eventually exceed your monthly metrics budget.
- Description: Your active series usage is currently higher than the alert threshold. Consult the cardinality dashboard to ensure it is not a result of high cardinality or a misconfiguration, or reconsider your monthly budget.
![Alert details Alert details]()
Alert details
Set up an alert for data points per minute
The set up for an alert on (data points per minute) (DPM) as follows relates to a billable series:
In your Cloud instance, navigate to the Alerts & IRM > Alerting > Alert rules.
Click Create alert rule.
Select Grafana managed alert.
In query panel A, select grafanacloud-usage from the data source dropdown menu.
Select the Code option in the upper-right corner of the panel.
Enter the following query:
(
# Data points received per minute:
sum (grafanacloud_instance_samples_per_second*60)
/
# Divide by "Included DPM" to approximate billable-series
sum (grafanacloud_org_metrics_included_dpm_per_series)
*
# Current price per billable-series (calculated from current usage levels and your contract):
sum (grafanacloud_org_metrics_overage) / sum (grafanacloud_org_metrics_billable_series)
)
Set your budgeting threshold by dragging the red tab at the right of the graph, or by setting an IS ABOVE condition in panel B.
Add optional descriptive details to your alert, for example:
- Summary: If you continue at your current DPM usage level, you will eventually exceed your monthly metrics budget.
- Description: The billable series due to DPM (
total data points received / data points included per series) is currently higher than the alert threshold. If theActiveSeries Usagealert is not firing, then you likely have some series with a DPM higher than what’s included in your plan. To view the DPM of your metrics, use the following query:count_over_time(<METRIC NAME>[10m]).


