Service Graph and Service Graph view
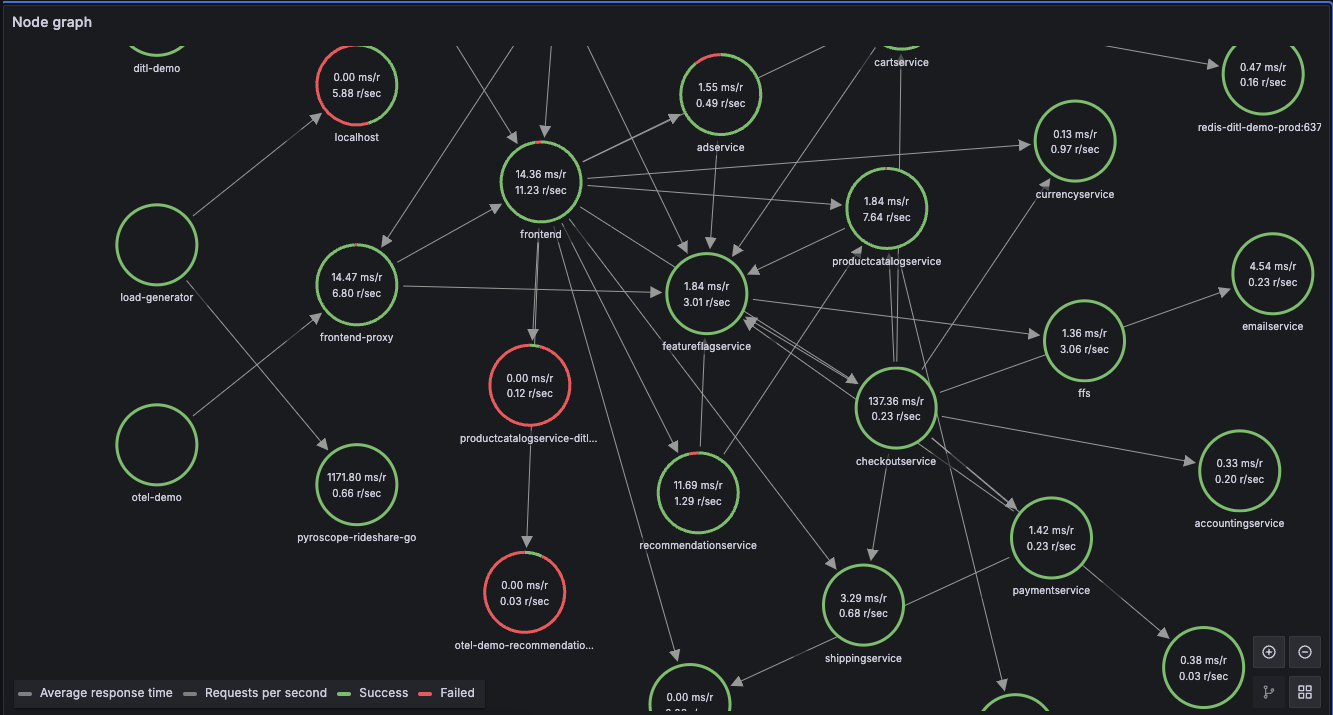
The Service Graph is a visual representation of the relationships between services. Each node on the graph represents a service such as an API or database.
You use the Service Graph to detect performance issues; track increases in error, fault, or throttle rates in services; and investigate root causes by viewing corresponding traces.

Display the Service Graph
- Configure Grafana Alloy or Tempo or GET to generate Service Graph data.
- Link a Prometheus data source in the Tempo data source’s Service Graph settings.
- Navigate to Explore.
- Select the Tempo data source.
- Select the Service Graph query type.
- Run the query.
- (Optional) Filter by service name.
For details, refer to Node Graph panel.
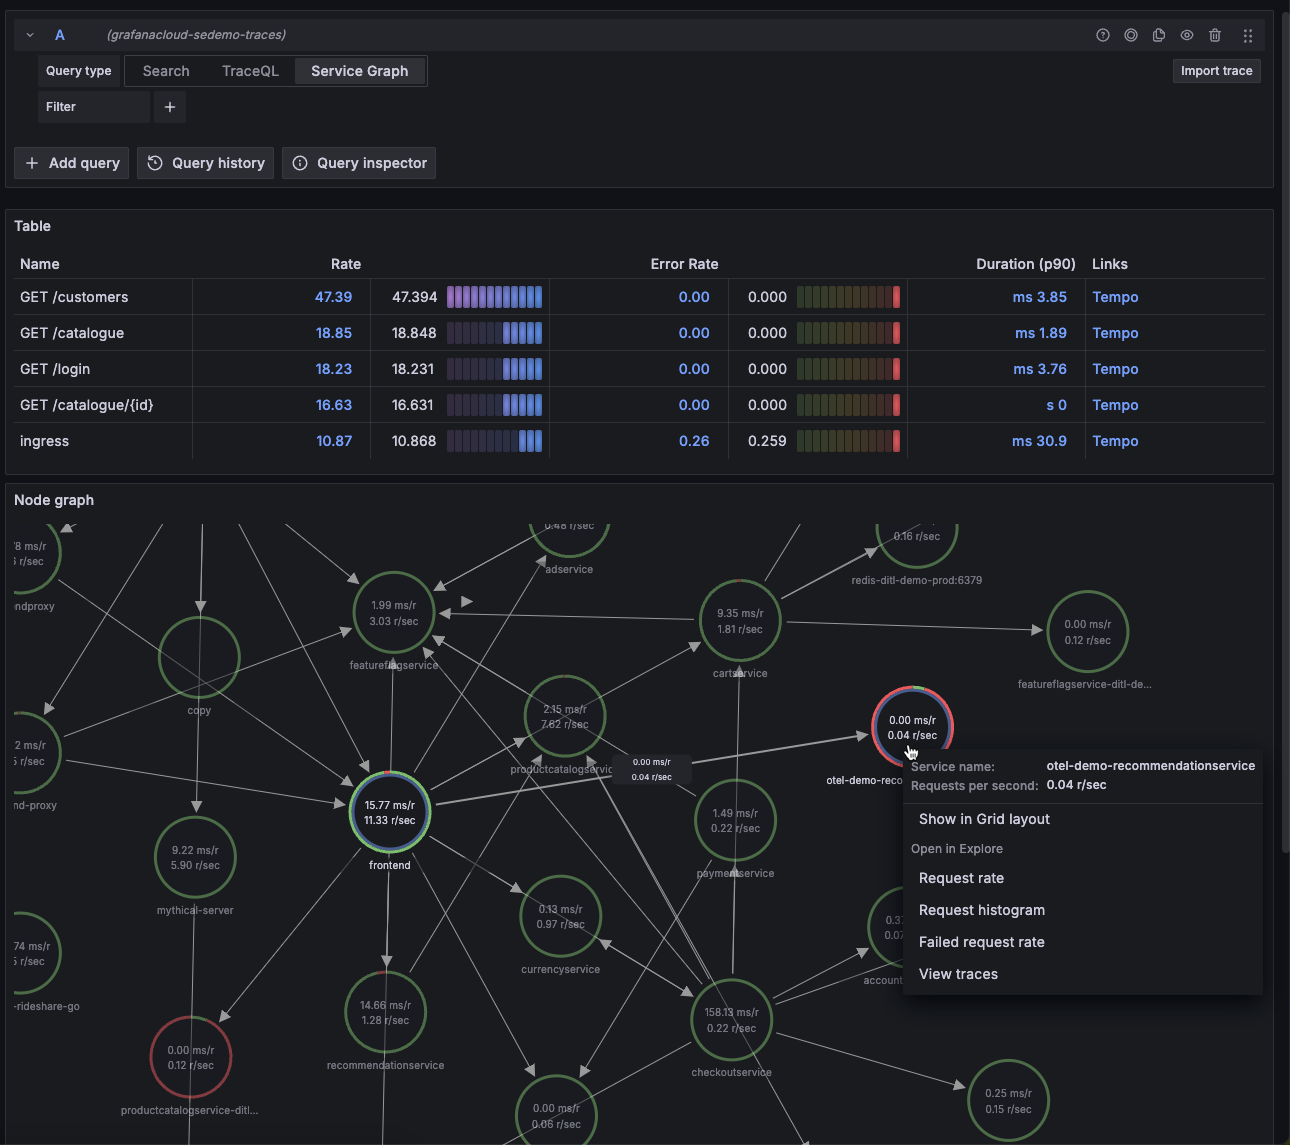
Each circle in the graph represents a service. To open a context menu with additional links for quick navigation to other relevant information, click a service.
Numbers inside the circles indicate the average time per request and requests per second.
Each circle’s color represents the percentage of requests in each state:
| Color | State |
|---|---|
| Green | Success |
| Red | Fault |
| Yellow | Errors |
| Purple | Throttled responses |
Open the Service Graph view
Service graph view displays a table of request rate, error rate, and duration metrics (RED) calculated from your incoming spans. It also includes a node graph view built from your spans.

For details, refer to the Service Graph view documentation.
To open the Service Graph view:
- Link a Prometheus data source in the Tempo data source settings.
- Navigate to Explore.
- Select the Tempo data source.
- Select the Service Graph query type.
- Run the query.
- (Optional) Filter your results.
Note
Grafana uses the
traces_spanmetrics_calls_totalmetric to display the name, rate, and error rate columns, andtraces_spanmetrics_latency_bucketto display the duration column. These metrics must exist in your Prometheus data source.
To open a query in Prometheus with the span name of that row automatically set in the query, click a row in the rate, error rate, or duration columns.

To open a query in Tempo with the span name of that row automatically set in the query, click a row in the links column.


