
PostgreSQL query editor
Grafana query editors are unique for each data source.
For general information on Grafana query editors, refer to Query editors.
For general information on querying data sources in Grafana, refer to Query and transform data.
The PostgreSQL query editor is located on the Explore page. You can also access the PostgreSQL query editor from a dashboard panel. Click the ellipsis in the upper right of the panel and select Edit.

PostgreSQL query editor components
The PostgreSQL query editor has two modes: Builder and Code.
Builder mode helps you build a query using a visual interface. Code mode allows for advanced querying and offers support for complex SQL query writing.
PostgreSQL Builder mode
The following components will help you build a PostgreSQL query:
- Format - Select a format response from the drop-down for the PostgreSQL query. The default is Table. If you use the Time series format option, one of the columns must be
time. Refer to Time series queries for more information. - Table - Select a table from the drop-down. Tables correspond to the chosen database.
- Data operations - Optional Select an aggregation from the drop-down. You can add multiple data operations by clicking the + sign. Click the garbage can icon to remove data operations.
- Column - Select a column on which to run the aggregation.
- Alias - Optional Add an alias from the drop-down. You can also add your own alias by typing it in the box and clicking Enter. Remove an alias by clicking the X.
- Filter - Toggle to add filters.
- Filter by column value - Optional If you toggle Filter you can add a column to filter by from the drop-down. To filter on more columns, click the + sign to the right of the condition drop-down. You can choose a variety of operators from the drop-down next to the condition. When multiple filters are added you can add an
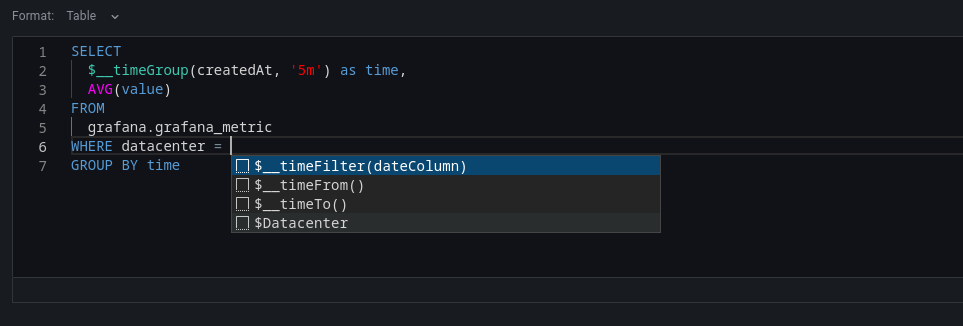
ANDoperator to display all true conditions or anORoperator to display any true conditions. Use the second drop-down to choose a filter. To remove a filter, click theXbutton next to that filter’s drop-down. After selecting a date type column, you can choose Macros from the operators list and selecttimeFilterwhich will add the$\_\_timeFiltermacro to the query with the selected date column. - Group - Toggle to add Group by column.
- Group by column - Select a column to filter by from the drop-down. Click the +sign to filter by multiple columns. Click the X to remove a filter.
- Order - Toggle to add an
ORDER BYstatement. - Order by - Select a column to order by from the drop-down. Select ascending (
ASC) or descending (DESC) order. - Limit - You can add an optional limit on the number of retrieved results. Default is 50.
- Preview - Toggle for a preview of the SQL query generated by the query builder. Preview is toggled on by default.
PostgreSQL Code mode
To create advanced queries, switch to Code mode by clicking Code in the upper right of the editor window. Code mode supports the auto-completion of tables, columns, SQL keywords, standard SQL functions, Grafana template variables, and Grafana macros. Columns cannot be completed before a table has been specified.
Select Table or Time Series as the format. Click the {} in the bottom right to format the query. Click the downward caret to expand the Code mode editor. CTRL/CMD + Return serves as a keyboard shortcut to execute the query.
Warning
Changes made to a query in Code mode will not transfer to Builder mode and will be discarded. You will be prompted to copy your code to the clipboard to save any changes.
Macros
You can add macros to your queries to simplify the syntax and enable dynamic elements, such as date range filters.
| Macro example | Description |
|---|---|
$__time(dateColumn) | Replaces the value with an expression to convert to a UNIX timestamp and renames the column to time_sec. Example: UNIX_TIMESTAMP(dateColumn) AS time_sec. |
$__timeEpoch(dateColumn) | Replaces the value with an expression to convert to a UNIX Epoch timestamp and renames the column to time_sec. Example: UNIX_TIMESTAMP(dateColumn) AS time_sec. |
$__timeFilter(dateColumn) | Replaces the value a time range filter using the specified column name. Example: dateColumn BETWEEN FROM_UNIXTIME(1494410783) AND FROM_UNIXTIME(1494410983) |
$__timeFrom() | Replaces the value with the start of the currently active time selection. Example: FROM_UNIXTIME(1494410783) |
$__timeTo() | Replaces the value with the end of the currently active time selection. Example: FROM_UNIXTIME(1494410983) |
$__timeGroup(dateColumn,'5m') | Replaces the value with an expression suitable for use in a GROUP BY clause. Example: cast(cast(UNIX_TIMESTAMP(dateColumn)/(300) AS signed)*300 AS signed) |
$__timeGroup(dateColumn,'5m', 0) | Same as the $__timeGroup(dateColumn,'5m') macro, but includes a fill parameter to ensure missing points in the series are added by Grafana, using 0 as the default value. This applies only to time series queries. |
$__timeGroup(dateColumn,'5m', NULL) | Same as the $__timeGroup(dateColumn,'5m', 0) but NULL is used as the value for missing points. This applies only to time series queries. |
$__timeGroup(dateColumn,'5m', previous) | Same as the $__timeGroup(dateColumn,'5m', previous) macro, but uses the previous value in the series as the fill value. If no previous value exists, it uses NULL. This applies only to time series queries. |
$__timeGroupAlias(dateColumn,'5m') | Replaces the value identical to $__timeGroup but with an added column alias. |
$__unixEpochFilter(dateColumn) | Replaces the value by a time range filter using the specified column name with times represented as a UNIX timestamp. Example: dateColumn > 1494410783 AND dateColumn < 1494497183 |
$__unixEpochFrom() | Replaces the value with the start of the currently active time selection as a UNIX timestamp. Example: 1494410783 |
$__unixEpochTo() | Replaces the value with the end of the currently active time selection as a UNIX timestamp. Example: 1494497183 |
$__unixEpochNanoFilter(dateColumn) | Replaces the value with a time range filter using the specified column name with time represented as a nanosecond timestamp. Example: dateColumn > 1494410783152415214 AND dateColumn < 1494497183142514872 |
$__unixEpochNanoFrom() | Replaces the value with the start of the currently active time selection as a nanosecond timestamp. Example: 1494410783152415214 |
$__unixEpochNanoTo() | Replaces the value with the end of the currently active time selection as nanosecond timestamp. Example: 1494497183142514872 |
$__unixEpochGroup(dateColumn,'5m', [fillmode]) | Same as $__timeGroup but for times stored as Unix timestamp. fillMode only works with time series queries. |
$__unixEpochGroupAlias(dateColumn,'5m', [fillmode]) | Same as $__timeGroup but also adds a column alias. fillMode only works with time series queries. |
Table SQL queries
If the Format option is set to Table, you can execute virtually any type of SQL query. The Table panel will automatically display the resulting columns and rows from your query.

You can change or customize the name of a Table panel column by using the SQL keyword AS syntax.
SELECT
  title as "Title",
  "user".login as "Created By",
  dashboard.created as "Created On"
FROM dashboard
INNER JOIN "user" on "user".id = dashboard.created_by
WHERE $__timeFilter(dashboard.created)
Time series queries
Set the Format option to Time series to create and run time series queries.
Note
To run a time series query you must include a column named
timethat returns either a SQLdatetimevalue or a numeric datatype representing the UNIX epoch time in seconds. Additionally, the query results must be sorted by thetimecolumn for proper visualization in panels.
The examples in this section refer to the data in the following table:
+---------------------+--------------+---------------------+----------+
| time_date_time      | value_double | CreatedAt           | hostname |
+---------------------+--------------+---------------------+----------+
| 2020-01-02 03:05:00 | 3.0          | 2020-01-02 03:05:00 | 10.0.1.1 |
| 2020-01-02 03:06:00 | 4.0          | 2020-01-02 03:06:00 | 10.0.1.2 |
| 2020-01-02 03:10:00 | 6.0          | 2020-01-02 03:10:00 | 10.0.1.1 |
| 2020-01-02 03:11:00 | 7.0          | 2020-01-02 03:11:00 | 10.0.1.2 |
| 2020-01-02 03:20:00 | 5.0          | 2020-01-02 03:20:00 | 10.0.1.2 |
+---------------------+--------------+---------------------+----------+
Time series query results are returned in wide data frame format. In the data frame query result, any column, except for time or string-type columns, transforms into value fields. String columns, on the other hand, become field labels.
Note
For backward compatibility, an exception to this rule applies to queries that return three columns, one of which is a string column named
metric. Instead of converting the metric column into field labels, it is used as the field name, while the series name is set to its value. See the following example for reference.
Example with metric column:
SELECT
  $__timeGroupAlias("time_date_time",'5m'),
  min("value_double"),
  'min' as metric
FROM test_data
WHERE $__timeFilter("time_date_time")
GROUP BY time
ORDER BY time
Data frame result:
+---------------------+-----------------+
| Name: time          | Name: min       |
| Labels:             | Labels:         |
| Type: []time.Time   | Type: []float64 |
+---------------------+-----------------+
| 2020-01-02 03:05:00 | 3               |
| 2020-01-02 03:10:00 | 6               |
+---------------------+-----------------+
To customize default series name formatting, refer to Standard options definitions.
Following are time series query examples.
Example using the fill parameter in the $__timeGroupAlias macro to convert null values to be zero instead:
SELECT
  $__timeGroupAlias("createdAt",'5m',0),
  sum(value) as value,
  hostname
FROM test_data
WHERE
  $__timeFilter("createdAt")
GROUP BY time, hostname
ORDER BY time
Based on the data frame result in the following example, the time series panel will generate two series named value 10.0.1.1 and value 10.0.1.2. To display the series names as 10.0.1.1 and 10.0.1.2, use the Standard options definitions display value ${__field.labels.hostname}.
Data frame result:
+---------------------+---------------------------+---------------------------+
| Name: time          | Name: value               | Name: value               |
| Labels:             | Labels: hostname=10.0.1.1 | Labels: hostname=10.0.1.2 |
| Type: []time.Time   | Type: []float64           | Type: []float64           |
+---------------------+---------------------------+---------------------------+
| 2020-01-02 03:05:00 | 3                         | 4                         |
| 2020-01-02 03:10:00 | 6                         | 7                         |
+---------------------+---------------------------+---------------------------+
Example with multiple columns:
SELECT
  $__timeGroupAlias("time_date_time",'5m'),
  min("value_double") as "min_value",
  max("value_double") as "max_value"
FROM test_data
WHERE $__timeFilter("time_date_time")
GROUP BY time
ORDER BY time
Data frame result:
+---------------------+-----------------+-----------------+
| Name: time          | Name: min_value | Name: max_value |
| Labels:             | Labels:         | Labels:         |
| Type: []time.Time   | Type: []float64 | Type: []float64 |
+---------------------+-----------------+-----------------+
| 2020-01-02 03:04:00 | 3               | 4               |
| 2020-01-02 03:05:00 | 6               | 7               |
+---------------------+-----------------+-----------------+
Templating
Instead of hard coding values like server, application, or sensor names in your metric queries, you can use variables. Variables appear as drop-down select boxes at the top of the dashboard. These drop-downs make it easy to change the data being displayed in your dashboard.
Refer to Templates for an introduction to creating template variables as well as the different types.
Query variable
If you add a Query template variable you can write a PostgreSQL query to retrieve items such as measurement names, key names, or key values, which will be displayed in the drop-down menu.
For example, you can use a variable to retrieve all the values from the hostname column in a table by creating the following query in the templating variable Query setting.
SELECT hostname FROM hostA query can return multiple columns, and Grafana will automatically generate a list based on the query results. For example, the following query returns a list with values from hostname and hostname2.
SELECT host.hostname, other_host.hostname2 FROM host JOIN other_host ON host.city = other_host.cityTo use time range dependent macros like $__timeFilter(column) in your query, you must set the template variable’s refresh mode to On Time Range Change.
SELECT event_name FROM event_log WHERE $__timeFilter(time_column)Another option is a query that can create a key/value variable. The query should return two columns that are named __text and __value. The __text column must contain unique values (if not, only the first value is used). This allows the drop-down options to display a text-friendly name as the text while using an ID as the value. For example, a query could use hostname as the text and id as the value:
SELECT hostname AS __text, id AS __value FROM hostYou can also create nested variables. For example, if you have a variable named region, you can configure the hosts variable to display only the hosts within the currently selected region as shown in the following example. If region is a multi-value variable, use the IN operator instead of = to match multiple values.
SELECT hostname FROM host WHERE region IN($region)Using __searchFilter to filter results in Query Variable
Using __searchFilter in the query field allows the query results to be filtered based on the user’s input in the drop-down selection box. If you do not enter anything, the default value for __searchFilter is %.
Note that you must enclose the __searchFilter expression in quotes as Grafana does not add them automatically.
The following example demonstrates how to use __searchFilter in the query field to enable real-time searching for hostname as the user type in the drop-down selection box.
SELECT hostname FROM my_host WHERE hostname LIKE '$__searchFilter'Using Variables in Queries
Template variable values are only quoted when the template variable is a multi-value.
If the variable is a multi-value variable, use the IN comparison operator instead of = to match against multiple values.
You can use two different syntaxes:
$<varname> Example with a template variable named hostname:
SELECT
  atimestamp as time,
  aint as value
FROM table
WHERE $__timeFilter(atimestamp) and hostname in($hostname)
ORDER BY atimestamp ASC
[[varname]] Example with a template variable named hostname:
SELECT
  atimestamp as time,
  aint as value
FROM table
WHERE $__timeFilter(atimestamp) and hostname in([[hostname]])
ORDER BY atimestamp ASC
Disabling quoting for multi-value variables
Grafana automatically formats multi-value variables as a quoted, comma-separated string. For example, if server01 and server02 are selected, they are formatted as 'server01', 'server02'. To remove the quotes, enable the CSV formatting option for the variables:
${servers:csv}
Read more about variable formatting options in the Variables documentation.
Annotations
Annotations allow you to overlay rich event information on top of graphs. Add annotation queries via the Dashboard settings > Annotations view.
Example query using a time column with epoch values:
SELECT
  epoch_time as time,
  metric1 as text,
  concat_ws(', ', metric1::text, metric2::text) as tags
FROM
  public.test_data
WHERE
  $__unixEpochFilter(epoch_time)
Example region query using time and timeend columns with epoch values:
SELECT
  epoch_time as time,
  epoch_time_end as timeend,
  metric1 as text,
  concat_ws(', ', metric1::text, metric2::text) as tags
FROM
  public.test_data
WHERE
  $__unixEpochFilter(epoch_time)
Example query using a time column with a native SQL date/time data type:
SELECT
  native_date_time as time,
  metric1 as text,
  concat_ws(', ', metric1::text, metric2::text) as tags
FROM
  public.test_data
WHERE
$__timeFilter(native_date_time)| Name | Description |
|---|---|
time | The name of the date/time field, which can be a column with a native SQL date/time data type or epoch value. |
timeend | Optional name of the end date/time field, which can be a column with a native SQL date/time data type or epoch value. |
text | Event description field. |
tags | Optional field name to use for event tags as a comma-separated string. |
Alerting
Use time series queries to create alerts. Table formatted queries aren’t yet supported in alert rule conditions.
For more information regarding alerting refer to the following:
Was this page helpful?
Related resources from Grafana Labs


