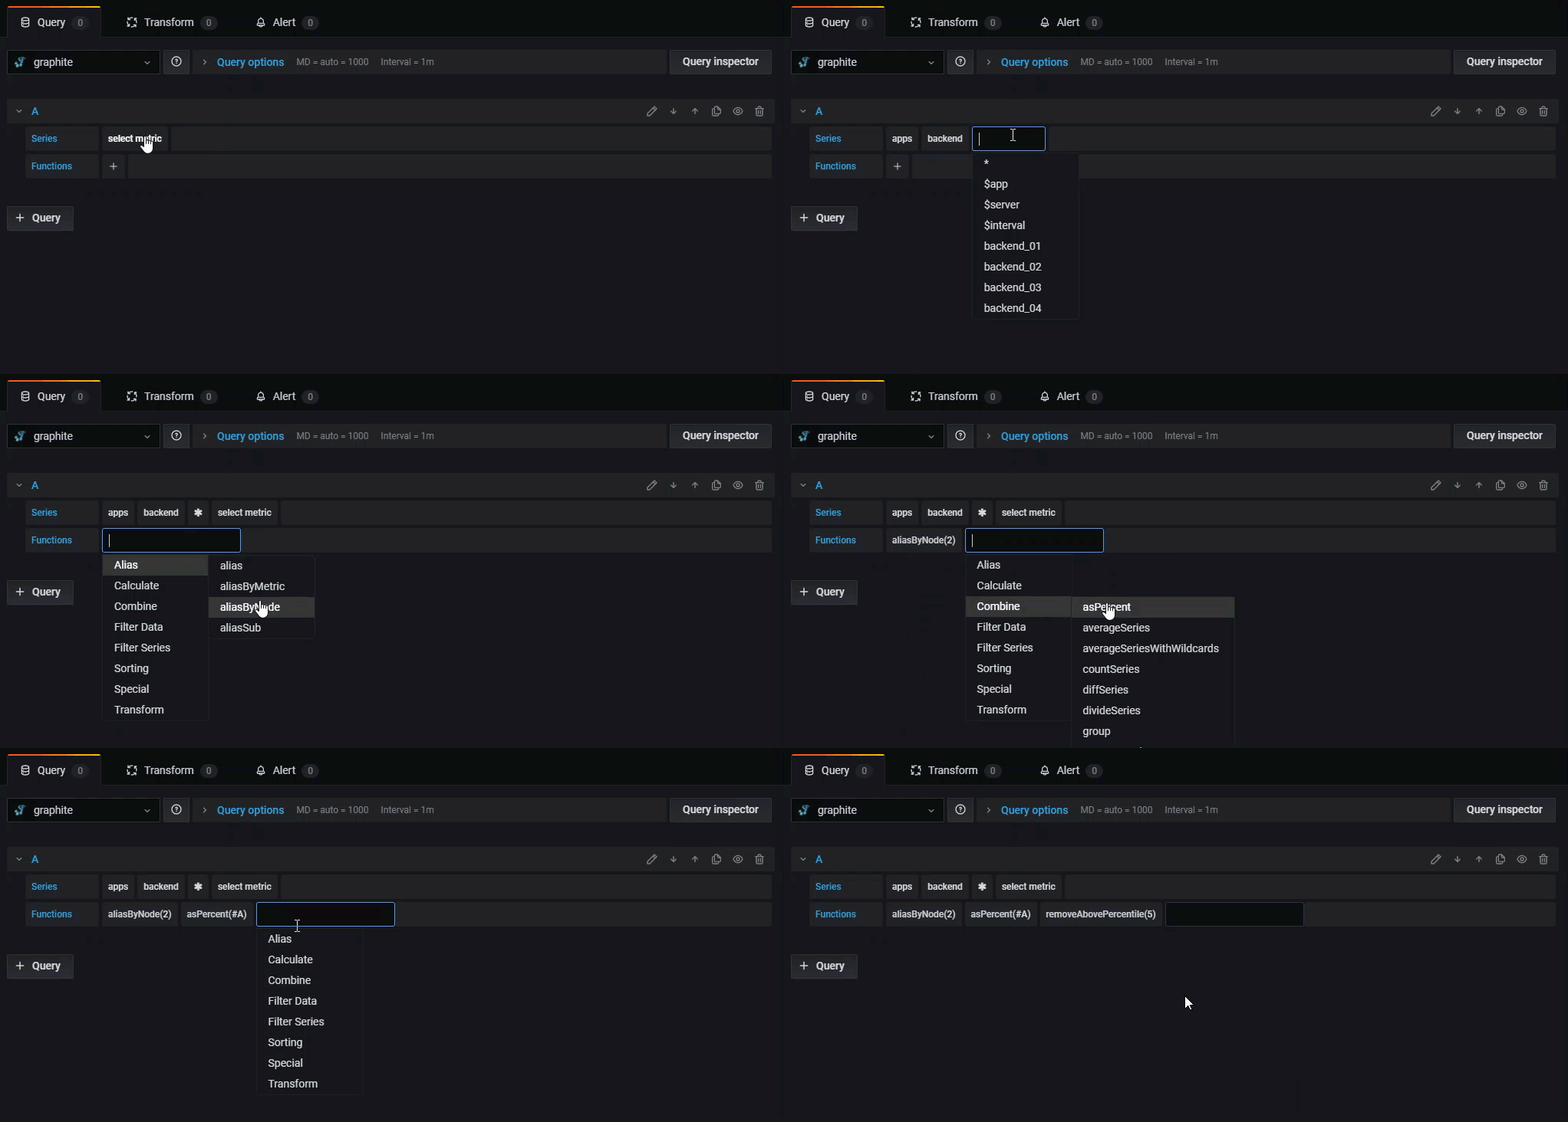
Graphite query editor
Grafana includes a Graphite-specific query editor to help you build queries. The query editor helps you quickly navigate the metric space, add functions, and change function parameters. It can handle all types of Graphite queries, including complex nested queries through the use of query references.
For general documentation on querying data sources in Grafana, see Query and transform data.
View the raw query
To see the raw text of the query that Grafana sends to Graphite, click the Toggle text edit mode (pencil) icon.
Choose metrics to query
Click Select metric to navigate the metric space. Once you begin, you can use the mouse or keyboard arrow keys. You can also select a wildcard and still continue.
Functions
Click the plus icon next to Function to add a function. You can search for the function or select it from the menu. Once a function is selected, it will be added and your focus will be in the text box of the first parameter.
- To edit or change a parameter, click on it and it will turn into a text box.
- To delete a function, click the function name followed by the x icon.
Some functions like aliasByNode support an optional second argument. To add an argument, hover your mouse over the first argument and then click the + symbol that appears. To remove the second optional parameter, click on it and leave it blank and the editor will remove it.
To learn more, refer to Graphite’s documentation on functions.
Warning
Some functions take a second argument that may be a function that returns a series. If you are adding a second argument that is a function, it is suggested to use a series reference from a second query instead of the function itself. The query editor does not currently support parsing of a second argument that is a function when switching between the query editor and the code editor.
Sort labels
If you have the same labels on multiple graphs, they are both sorted differently and use different colors.
To avoid this and consistently order labels by name, use the sortByName() function.
Modify the metric name in my tables or charts
Use alias functions, such as aliasByNode() or aliasSub(), to change metric names on Grafana tables or graphs.
Consolidate data points
Grafana consolidates all Graphite metrics so that Graphite doesn’t return more data points than there are pixels in the graph.
By default, Grafana consolidates data points using the avg function.
To control how Graphite consolidates metrics, use the Graphite consolidateBy() function.
Note
Legend summary values (max, min, total) can’t all be correct at the same time because they are calculated client-side by Grafana. Depending on your consolidation function, only one or two can be correct at the same time.
Combine time series
To combine time series, click Combine in the Functions list.
Select and explor data with tags
In Graphite, everything is a tag.
When exploring data, previously selected tags filter the remaining result set.
To select data, use the seriesByTag function, which takes tag expressions (=, !=, =~, !=~) to filter timeseries.
The Grafana query builder does this for you automatically when you select a tag.
Note
The regular expression search can be slow on high-cardinality tags, so try to use other tags to reduce the scope first. To help reduce the results, start by filtering on a particular name or namespace.
Nest queries
You can reference a query by the “letter” of its row, similar to a spreadsheet.
If you add a second query to a graph, you can reference the first query by entering #A.
This helps you build compounded queries.
Use wildcards to make fewer queries
To view multiple time series plotted on the same graph, use wildcards in your search to return all of the matching time series in one query.
For example, to see how the CPU is being utilized on a machine, you can create a graph and use the single query cpu.percent.*.g to retrieve all time series that match that pattern.
This is more efficient than adding a query for each time series, such as cpu.percent.user.g, cpu.percent.system.g, and so on, which results in many queries to the data source.
Apply annotations
Annotations overlay rich event information on top of graphs. You can add annotation queries in the Dashboard menu’s Annotations view.
Graphite supports two ways to query annotations:
- A regular metric query, using the
Graphite querytextbox. - A Graphite events query, using the
Graphite event tagstextbox with a tag, wildcard, or empty value
Get Grafana metrics into Graphite
Grafana exposes metrics for Graphite on the /metrics endpoint.
For detailed instructions, refer to Internal Grafana metrics.
Integration with Loki
Graphite queries get converted to Loki queries when the data source selection changes in Explore. Loki label names and values are extracted from the Graphite queries according to mappings information provided in Graphite data source configuration. Queries using tags with seriesByTags() are also transformed without any additional setup.
Refer to the Graphite data source settings for more details.


