Azure Monitor data source
Grafana ships with built-in support for Azure Monitor, the Azure service to maximize the availability and performance of applications and services in the Azure Cloud. This topic explains configuring and querying specific to the Azure Monitor data source.
For instructions on how to add a data source to Grafana, refer to the administration documentation. Only users with the organization administrator role can add data sources.
Once you’ve added the Azure Monitor data source, you can configure it so that your Grafana instance’s users can create queries in its query editor when they build dashboards and use Explore.
The Azure Monitor data source supports visualizing data from four Azure services:
- Azure Monitor Metrics: Collect numeric data from resources in your Azure account.
- Azure Monitor Logs: Collect log and performance data from your Azure account, and query using the Kusto Query Language (KQL).
- Azure Resource Graph: Query your Azure resources across subscriptions.
- Azure Monitor Application Insights: Collect trace logging data and other application performance metrics.
Configure the data source
To access the data source configuration page:
Click Connections in the left-side menu.
Under Your connections, click Data sources.
Enter
Azure Monitorin the search bar.Click Azure Monitor.
The Settings tab of the data source is displayed.
Configure Azure Active Directory (AD) authentication
You must create an app registration and service principal in Azure AD to authenticate the data source. For configuration details, refer to the Azure documentation for service principals.
The app registration you create must have the Reader role assigned on the subscription.
For more information, refer to Azure documentation for role assignments.
If you host Grafana in Azure, such as in App Service or Azure Virtual Machines, you can configure the Azure Monitor data source to use Managed Identity for secure authentication without entering credentials into Grafana. For details, refer to Configuring using Managed Identity.
You can configure the Azure Monitor data source to use Workload Identity for secure authentication without entering credentials into Grafana if you host Grafana in a Kubernetes environment, such as AKS, and require access to Azure resources. For details, refer to Configuring using Workload Identity.
| Name | Description |
|---|---|
| Authentication | Enables Managed Identity. Selecting Managed Identity hides many of the other fields. For details, see Configuring using Managed Identity. |
| Azure Cloud | Sets the national cloud for your Azure account. For most users, this is the default “Azure”. For details, see the Azure documentation. |
| Directory (tenant) ID | Sets the directory/tenant ID for the Azure AD app registration to use for authentication. For details, see the Azure tenant and app ID docs. |
| Application (client) ID | Sets the application/client ID for the Azure AD app registration to use for authentication. |
| Client secret | Sets the application client secret for the Azure AD app registration to use for authentication. For details, see the Azure application secret docs. |
| Default subscription | (Optional) Sets a default subscription for template variables to use. |
| Enable Basic Logs | Allows this data source to execute queries against Basic Logs tables in supported Log Analytics Workspaces. These queries may incur additional costs. |
Provision the data source
You can define and configure the data source in YAML files as part of Grafana’s provisioning system. For more information about provisioning, and for available configuration options, refer to Provisioning Grafana.
Provisioning examples
Azure AD App Registration (client secret):
apiVersion: 1 # config file version

datasources:
  - name: Azure Monitor
    type: grafana-azure-monitor-datasource
    access: proxy
    jsonData:
      azureAuthType: clientsecret
      cloudName: azuremonitor # See table below
      tenantId: <tenant-id>
      clientId: <client-id>
      subscriptionId: <subscription-id> # Optional, default subscription
    secureJsonData:
      clientSecret: <client-secret>
    version: 1
Managed Identity:
apiVersion: 1 # config file version

datasources:
  - name: Azure Monitor
    type: grafana-azure-monitor-datasource
    access: proxy
    jsonData:
      azureAuthType: msi
      subscriptionId: <subscription-id> # Optional, default subscription
    version: 1
Workload Identity:
apiVersion: 1 # config file version

datasources:
  - name: Azure Monitor
    type: grafana-azure-monitor-datasource
    access: proxy
    jsonData:
      azureAuthType: workloadidentity
      subscriptionId: <subscription-id> # Optional, default subscription
    version: 1
Current User:
Note
The
oauthPassThruproperty is required for current user authentication to function. Additionally,disableGrafanaCacheis necessary to prevent the data source returning cached responses for resources users don’t have access to.
apiVersion: 1 # config file version

datasources:
  - name: Azure Monitor
    type: grafana-azure-monitor-datasource
    access: proxy
    jsonData:
      azureAuthType: currentuser
      oauthPassThru: true
      disableGrafanaCache: true
      subscriptionId: <subscription-id> # Optional, default subscription
    version: 1
Supported cloud names
| Azure Cloud | cloudName Value |
|---|---|
| Microsoft Azure public cloud | azuremonitor (Default) |
| Microsoft Chinese national cloud | chinaazuremonitor |
| US Government cloud | govazuremonitor |
Note
Cloud names for current user authentication differ to the
cloudNamevalues in the preceding table. The public cloud name isAzureCloud, the Chinese national cloud name isAzureChinaCloud, and the US Government cloud name isAzureUSGovernment.
Configure Managed Identity
Note
Managed Identity is available only in Azure Managed Grafana or Grafana OSS/Enterprise when deployed in Azure. It is not available in Grafana Cloud.
You can use managed identity to configure Azure Monitor in Grafana if you host Grafana in Azure (such as an App Service or with Azure Virtual Machines) and have managed identity enabled on your VM. This lets you securely authenticate data sources without manually configuring credentials via Azure AD App Registrations. For details on Azure managed identities, refer to the Azure documentation.
To enable managed identity for Grafana:
Set the
managed_identity_enabledflag in the[azure]section of the Grafana server configuration.[azure] managed_identity_enabled = trueIn the Azure Monitor data source configuration, set Authentication to Managed Identity.
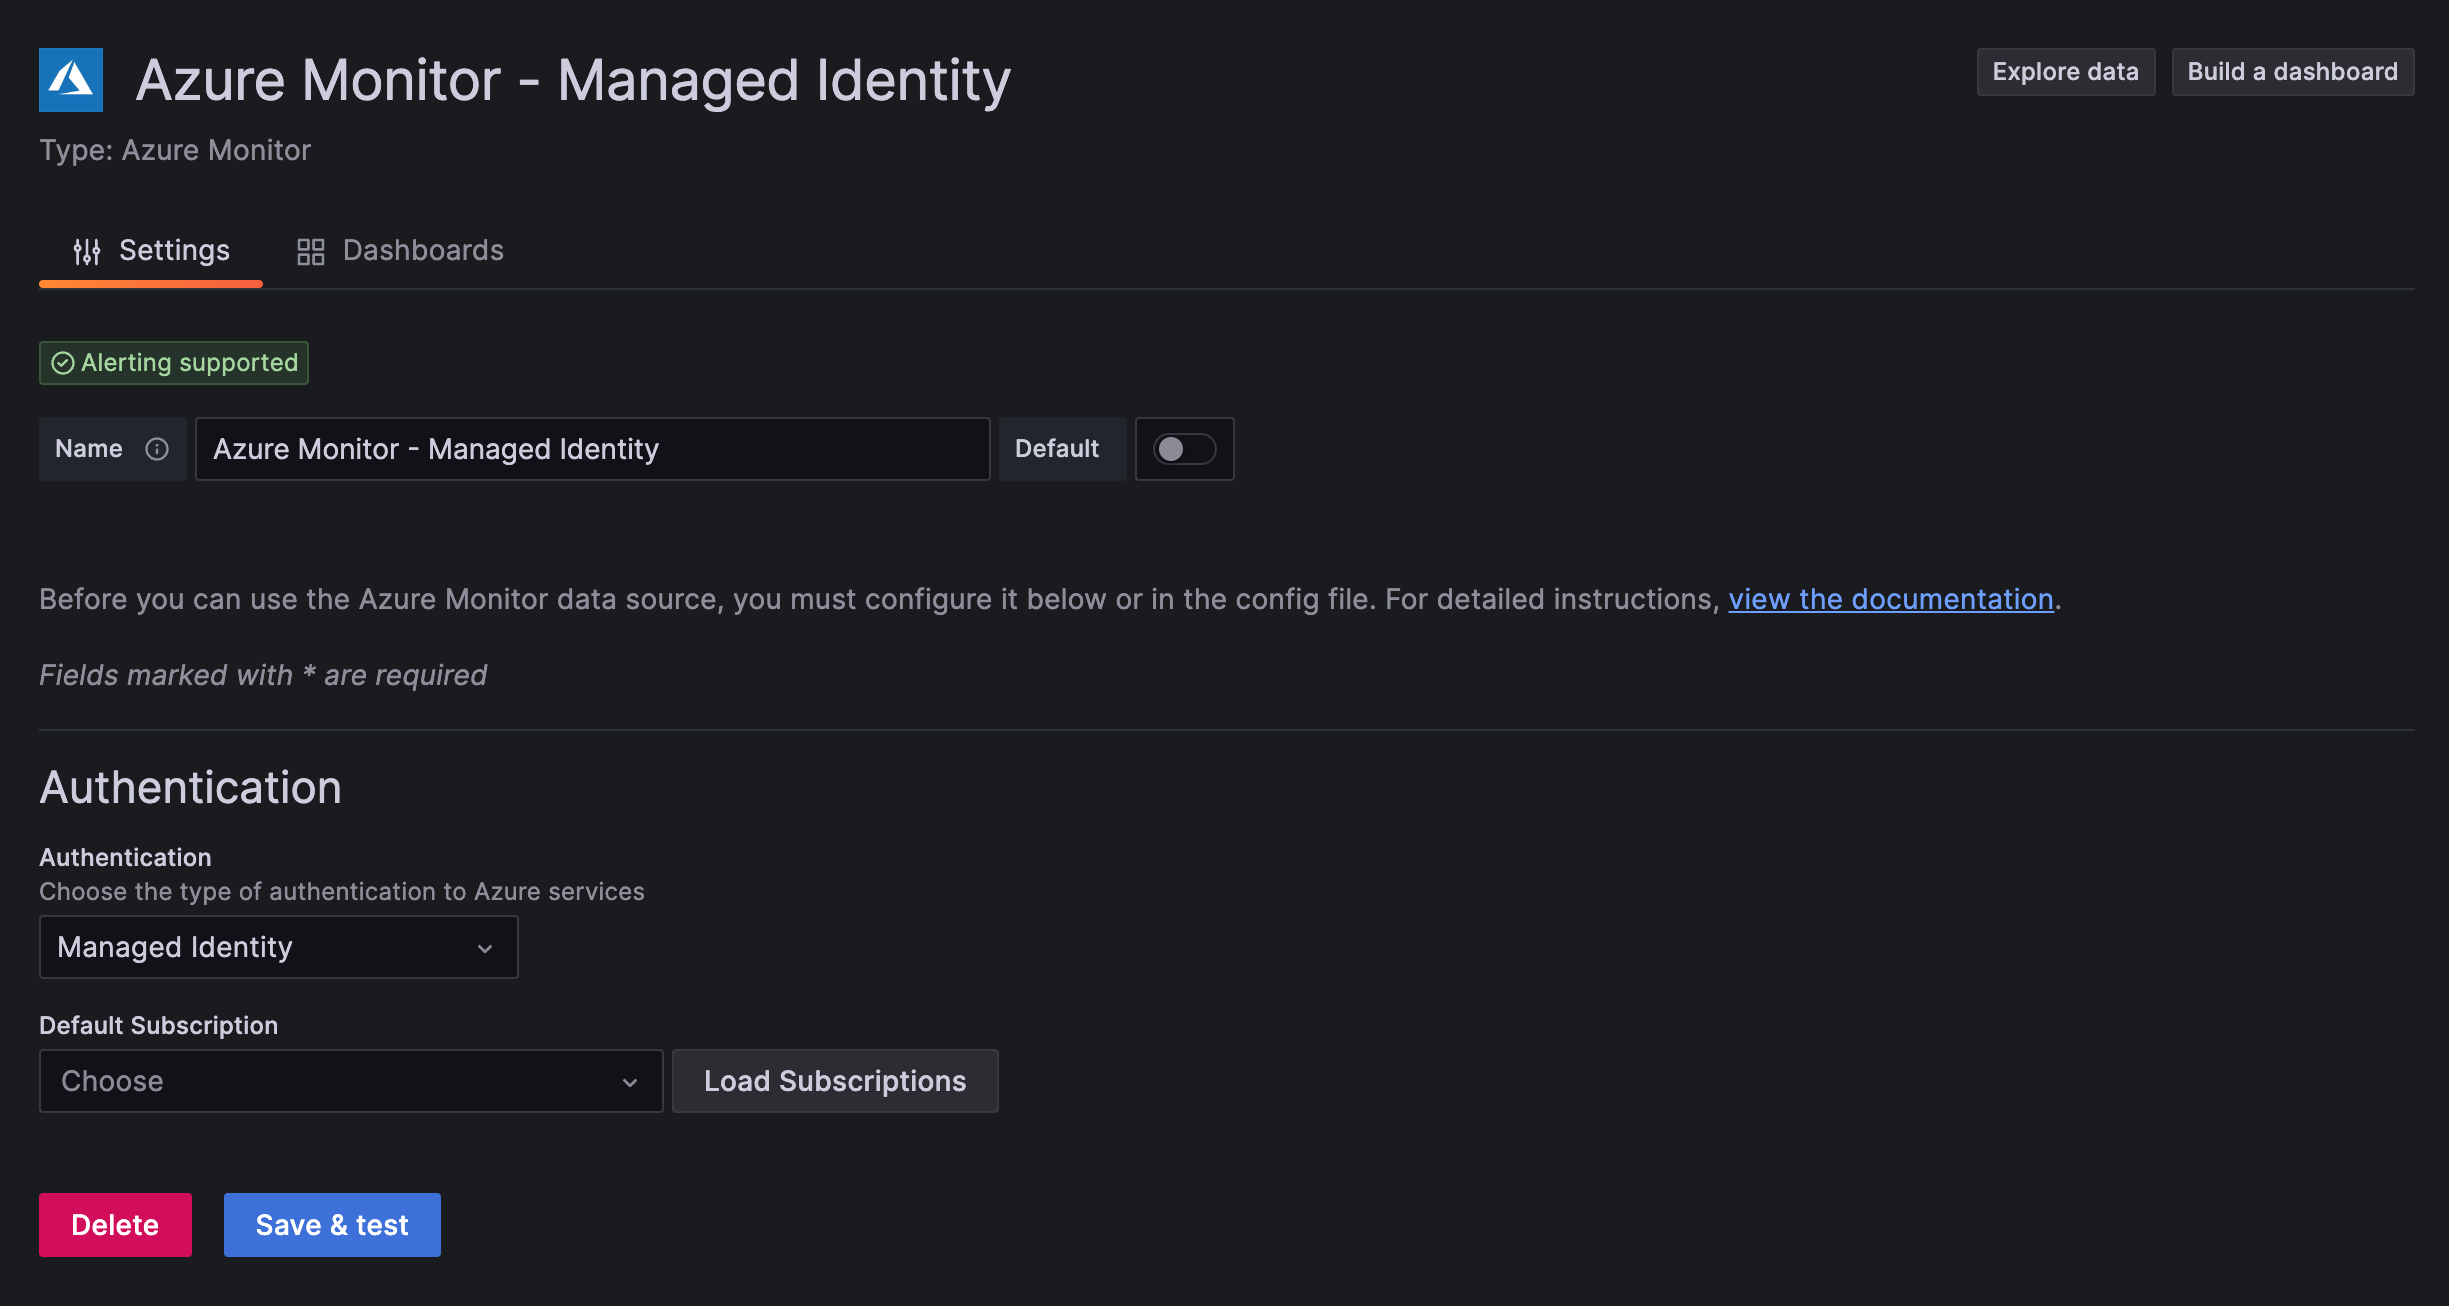
This hides the directory ID, application ID, and client secret fields, and the data source uses managed identity to authenticate to Azure Monitor Metrics and Logs, and Azure Resource Graph.
![Azure Monitor screenshot showing Managed Identity authentication Azure Monitor screenshot showing Managed Identity authentication]()
Azure Monitor screenshot showing Managed Identity authentication You can set the
managed_identity_client_idfield in the[azure]section of the Grafana server configuration to allow a user-assigned managed identity to be used instead of the default system-assigned identity.
[azure]
managed_identity_enabled = true
managed_identity_client_id = USER_ASSIGNED_IDENTITY_CLIENT_IDConfigure Workload Identity
You can use workload identity to configure Azure Monitor in Grafana if you host Grafana in a Kubernetes environment, such as AKS, in conjunction with managed identities. This lets you securely authenticate data sources without manually configuring credentials via Azure AD App Registrations. For details on workload identity, refer to the Azure workload identity documentation.
To enable workload identity for Grafana:
Set the
workload_identity_enabledflag in the[azure]section of the Grafana server configuration.[azure] workload_identity_enabled = trueIn the Azure Monitor data source configuration, set Authentication to Workload Identity.
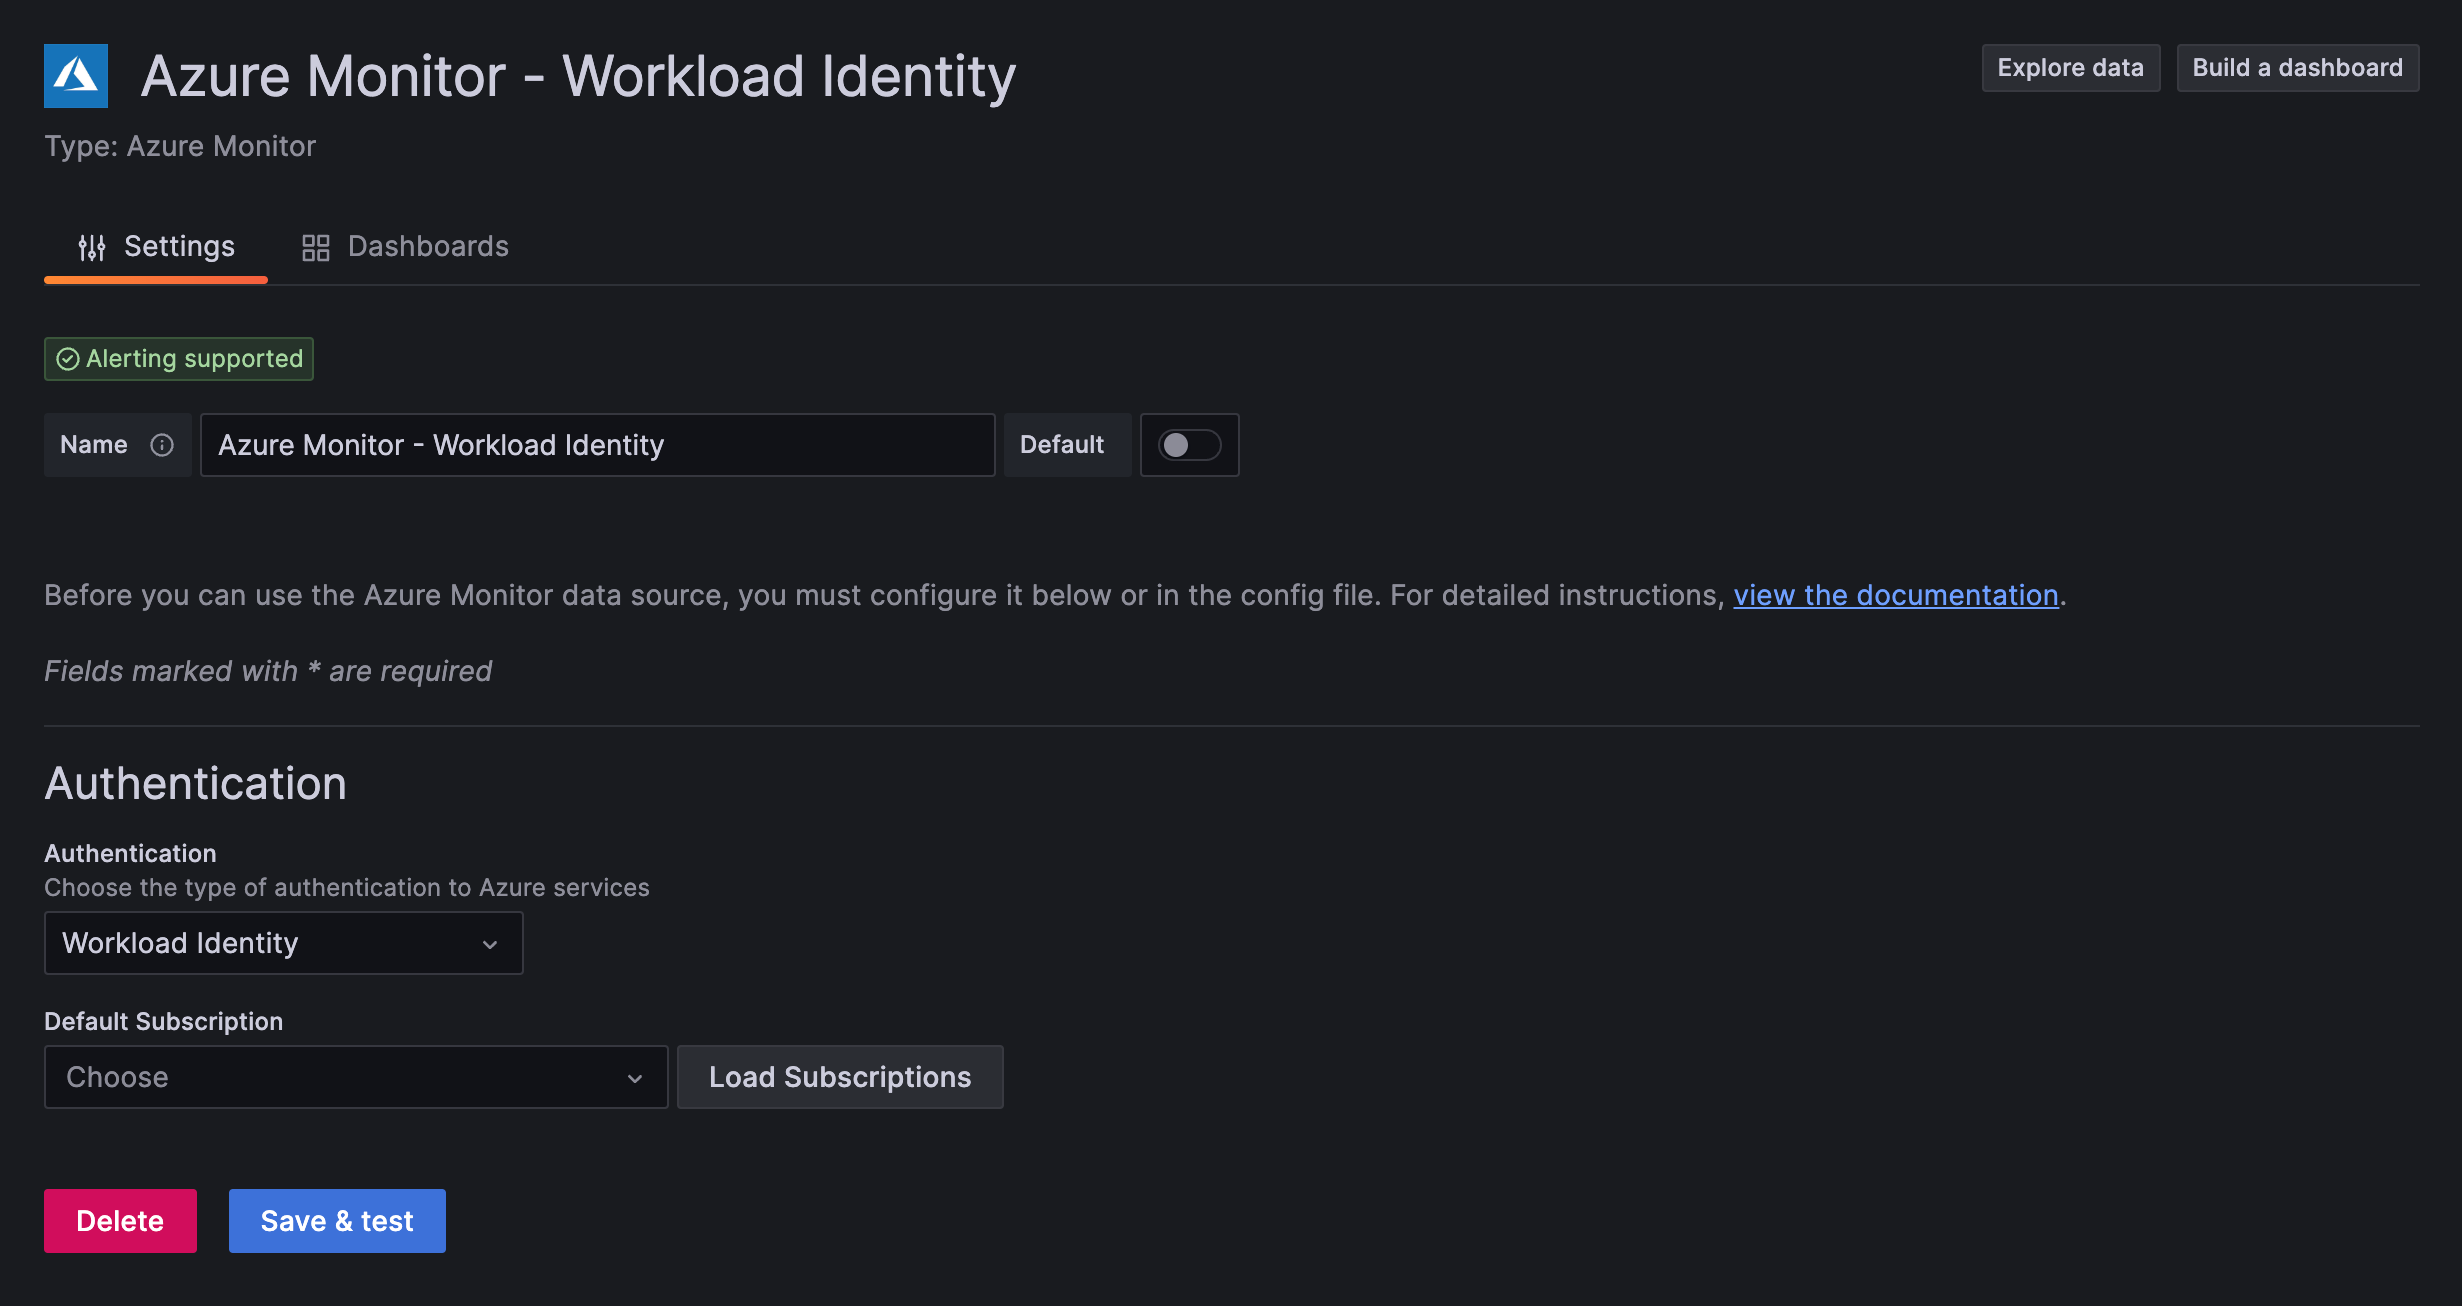
This hides the directory ID, application ID, and client secret fields, and the data source uses workload identity to authenticate to Azure Monitor Metrics and Logs, and Azure Resource Graph.
![Azure Monitor screenshot showing Workload Identity authentication Azure Monitor screenshot showing Workload Identity authentication]()
Azure Monitor screenshot showing Workload Identity authentication There are additional configuration variables that can control the authentication method.
workload_identity_tenant_idrepresents the Azure AD tenant that contains the managed identity,workload_identity_client_idrepresents the client ID of the managed identity if it differs from the default client ID,workload_identity_token_filerepresents the path to the token file. Refer to the documentation for more information on what values these variables should use, if any.[azure] workload_identity_enabled = true workload_identity_tenant_id = IDENTITY_TENANT_ID workload_identity_client_id = IDENTITY_CLIENT_ID workload_identity_token_file = TOKEN_FILE_PATH
Configure Current User authentication
Note
Current user authentication is an experimental feature. Engineering and on-call support is not available. Documentation is either limited or not provided outside of code comments. No SLA is provided. Contact Grafana Support to enable this feature in Grafana Cloud. Aspects of Grafana may not work as expected when using this authentication method.
If your Grafana instance is configured with Azure Entra (formerly Active Directory) authentication for login, this authentication method can be used to forward the currently logged in user’s credentials to the data source. The users credentials will then be used when requesting data from the data source. For details on how to configure your Grafana instance using Azure Entra refer to the documentation.
Note
Additional configuration is required to ensure that the App Registration used to login a user via Azure provides an access token with the permissions required by the data source.
The App Registration must be configured to issue both Access Tokens and ID Tokens.
- In the Azure Portal, open the App Registration that requires configuration.
- Select Authentication in the side menu.
- Under Implicit grant and hybrid flows check both the Access tokens and ID tokens boxes.
- Save the changes to ensure the App Registration is updated.
The App Registration must also be configured with additional API Permissions to provide authenticated users with access to the APIs utilised by the data source.
- In the Azure Portal, open the App Registration that requires configuration.
- Select API Permissions in the side menu.
- Ensure the
openid,profile,offline_accesspermissions are present under the Microsoft Graph section. If not, they must be added.- Select Add a permission and choose the following permissions. They must be added individually. Refer to the Azure documentation for more information.
- Select Azure Service Management > Delegated permissions >
user_impersonation> Add permissions- Select APIs my organization uses > Search for Log Analytics API and select it > Delegated permissions >
Date.Read> Add permissionsOnce all permissions have been added, the Azure authentication section in Grafana must be updated. The
scopessection must be updated to include the.defaultscope to ensure that a token with access to all APIs declared on the App Registration is requested by Grafana. Once updated the scopes value should equal:.default openid email profile.
This method of authentication doesn’t inherently support all backend functionality as a user’s credentials won’t be in scope. Affected functionality includes alerting, reporting, and recorded queries. In order to support backend queries when using a data source configured with current user authentication, you can configure service credentials. Also, note that query and resource caching is disabled by default for data sources using current user authentication.
Note
To configure fallback service credentials the feature toggle
idForwardingmust be set totrueanduser_identity_fallback_credentials_enabledmust be enabled in the Azure configuration section (enabled by default whenuser_identity_enabledis set totrue).
Permissions for fallback credentials may need to be broad to appropriately support backend functionality. For example, an alerting query created by a user is dependent on their permissions. If a user tries to create an alert for a resource that the fallback credentials can’t access, the alert will fail.
To enable current user authentication for Grafana:
Set the
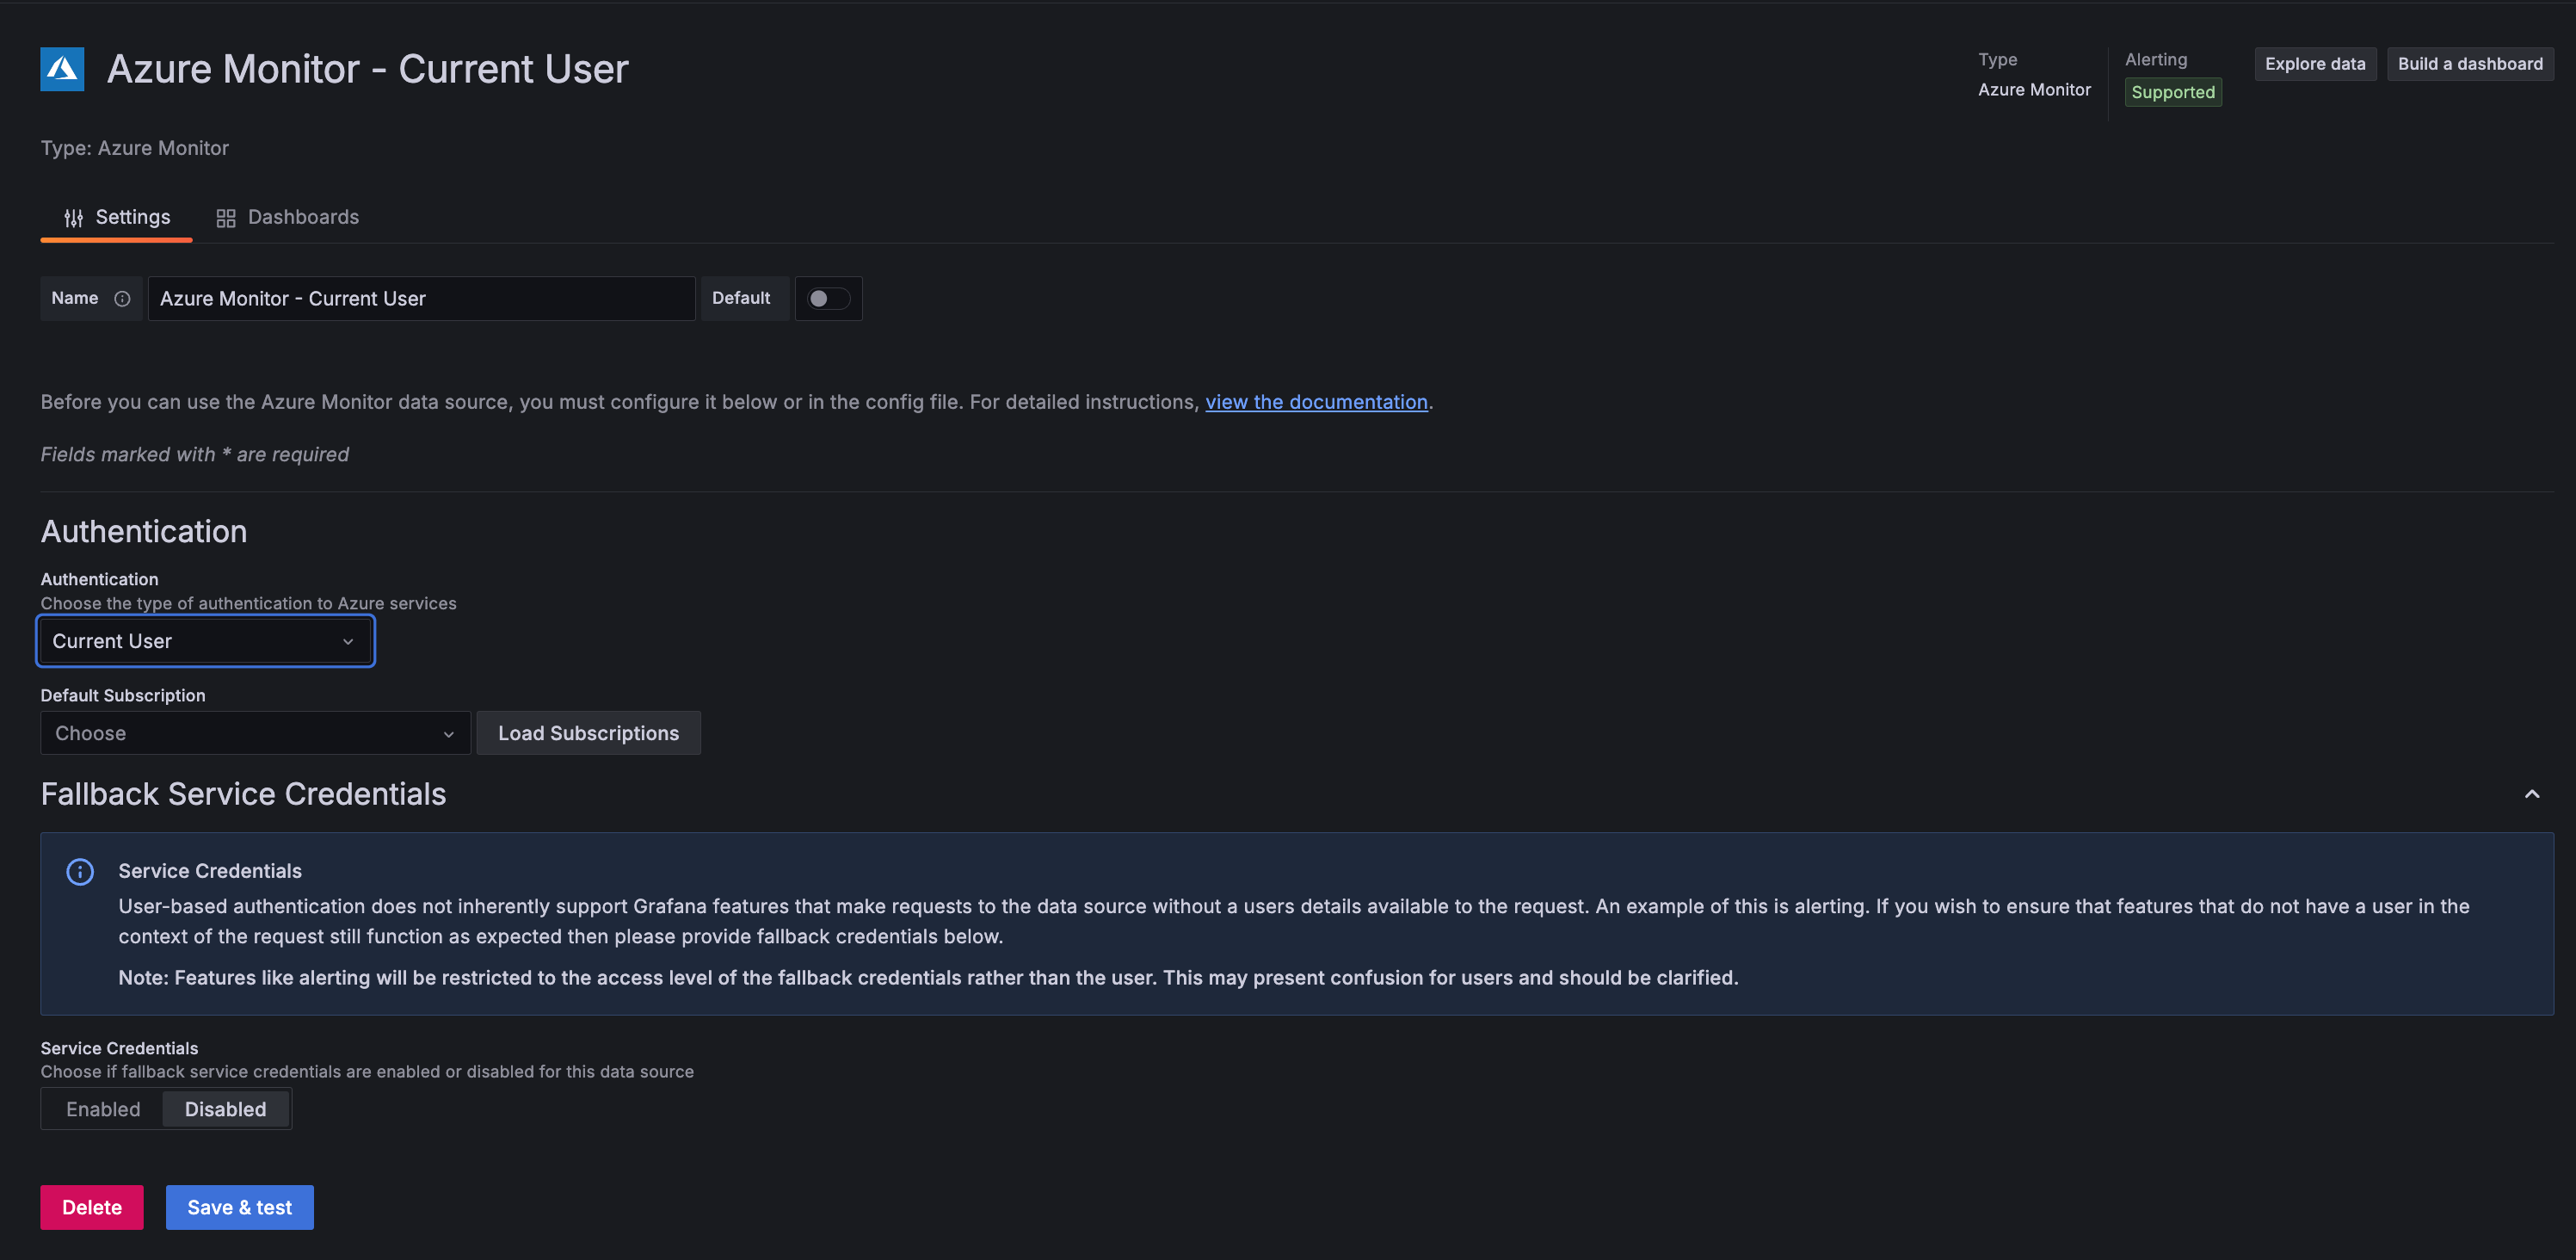
user_identity_enabledflag in the[azure]section of the Grafana server configuration. By default this will also enable fallback service credentials. If you want to disable service credentials at the instance level setuser_identity_fallback_credentials_enabledto false.[azure] user_identity_enabled = trueIn the Azure Monitor data source configuration, set Authentication to Current User. If fallback service credentials are enabled at the instance level, an additional configuration section is visible that you can use to enable or disable using service credentials for this data source.
![Azure Monitor screenshot showing Current User authentication Azure Monitor screenshot showing Current User authentication]()
Azure Monitor screenshot showing Current User authentication If you want backend functionality to work with this data source, enable service credentials and configure the data source using the most applicable credentials for your circumstances.
Query the data source
The Azure Monitor data source can query data from Azure Monitor Metrics and Logs, the Azure Resource Graph, and Application Insights Traces. Each source has its own specialized query editor.
For details, see the query editor documentation.
Use template variables
Instead of hard-coding details such as server, application, and sensor names in metric queries, you can use variables. Grafana lists these variables in dropdown select boxes at the top of the dashboard to help you change the data displayed in your dashboard. Grafana refers to such variables as template variables.
For details, see the template variables documentation.
Application Insights and Insights Analytics (removed)
Until Grafana v8.0, you could query the same Azure Application Insights data using Application Insights and Insights Analytics.
These queries were deprecated in Grafana v7.5. In Grafana v8.0, Application Insights and Insights Analytics were made read-only in favor of querying this data through Metrics and Logs. These query methods were completely removed in Grafana v9.0.
If you’re upgrading from a Grafana version prior to v9.0 and relied on Application Insights and Analytics queries, refer to the Grafana v9.0 documentation for help migrating these queries to Metrics and Logs queries.


