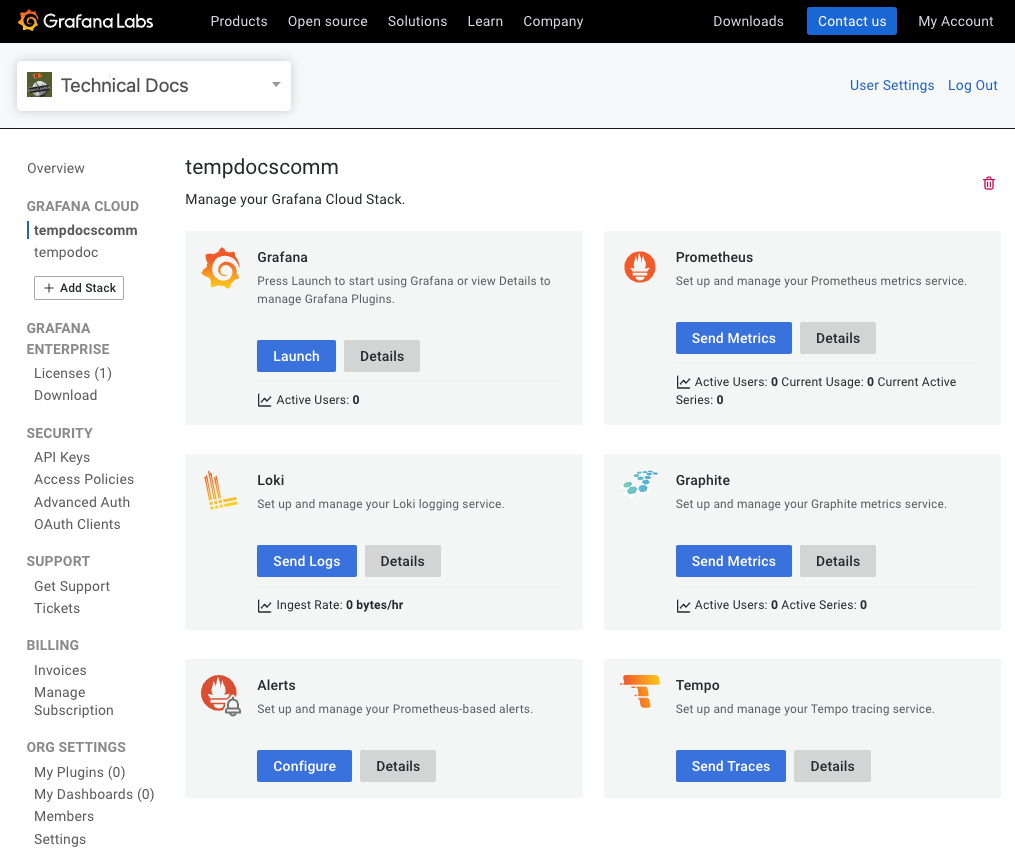
Your Grafana Cloud Stack
The main section of the Cloud Portal shows your currently selected stack. A stack groups together individual instances of all the services Grafana Labs offers for observing your software and infrastructure. This includes:
- Grafana (for visualizing data)
- High scale, high performance observability data storage and querying, backed by Mimir, Loki, Tempo, and Pyroscope open source databases
- Load testing (powered by K6)
- Alerting, OnCall, and Incident Response Management
Each stack is completely isolated from all other stacks in your account. Features, configuration, and data are not shared across stacks.

Find instance endpoints
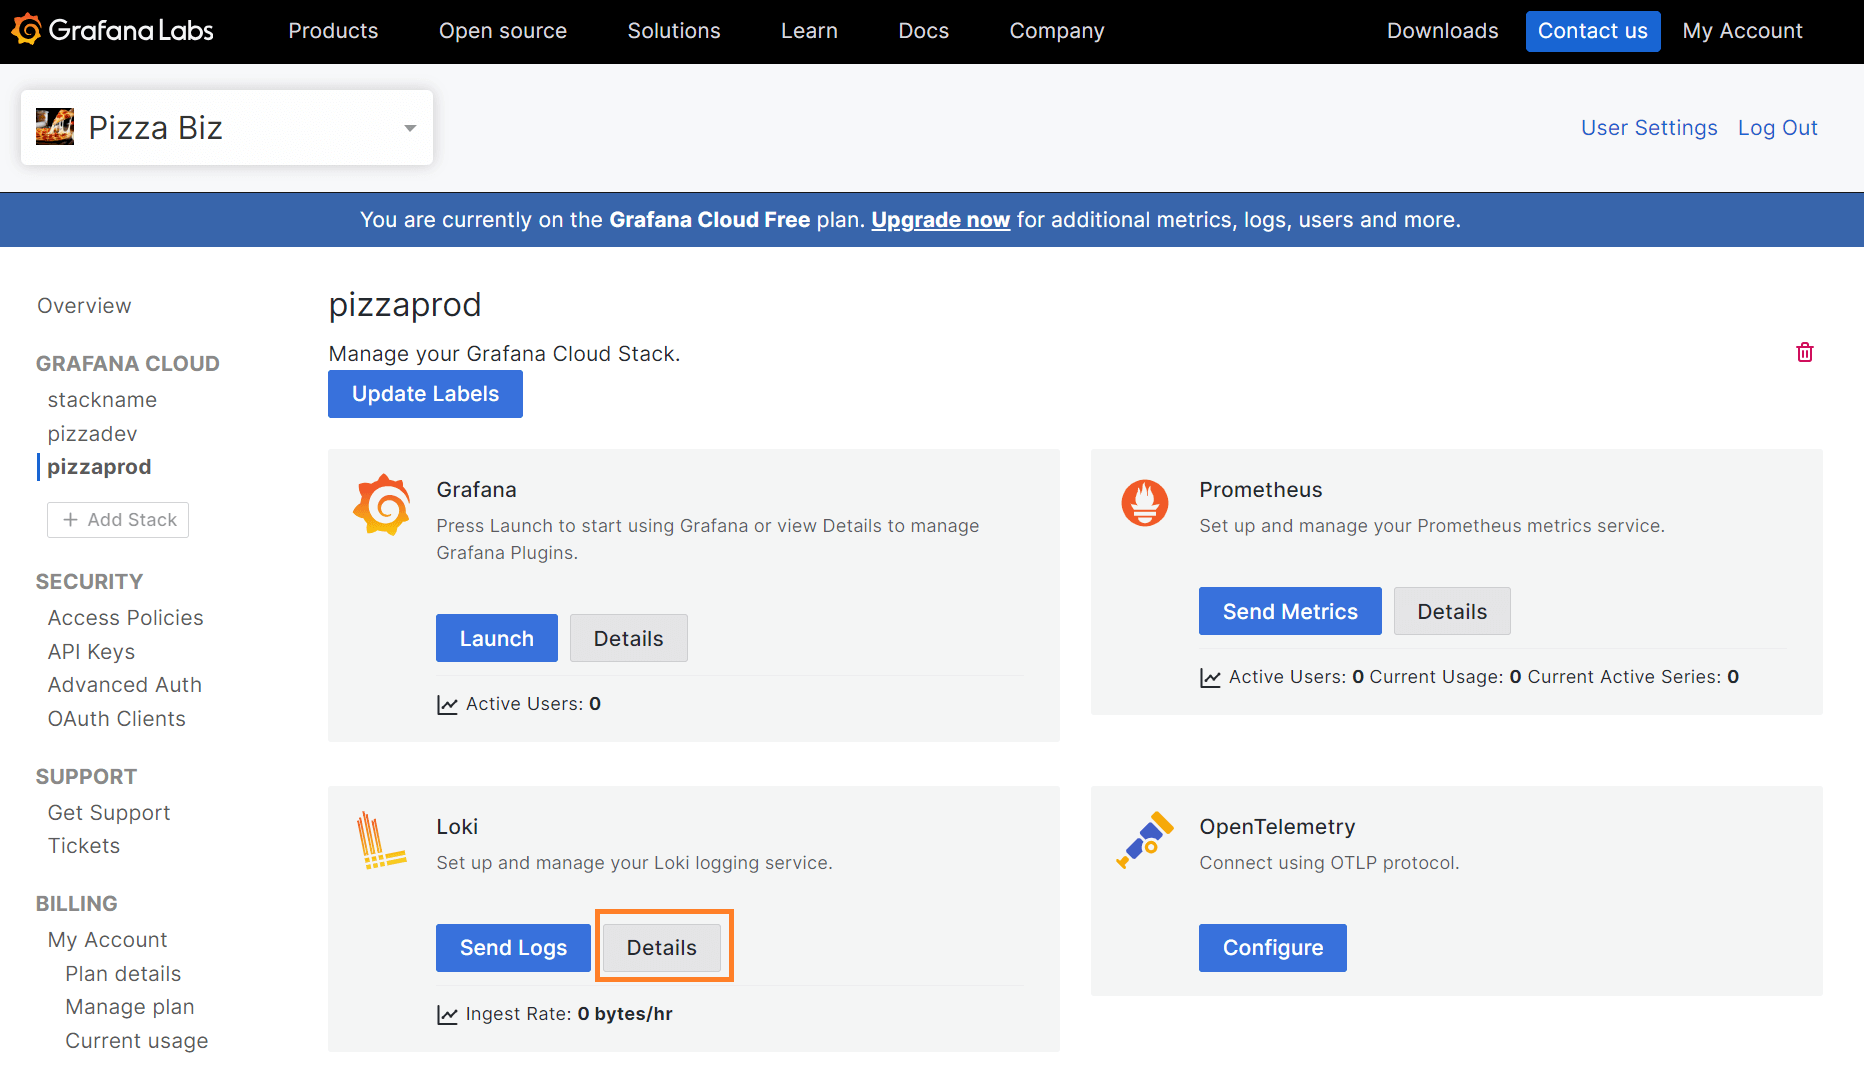
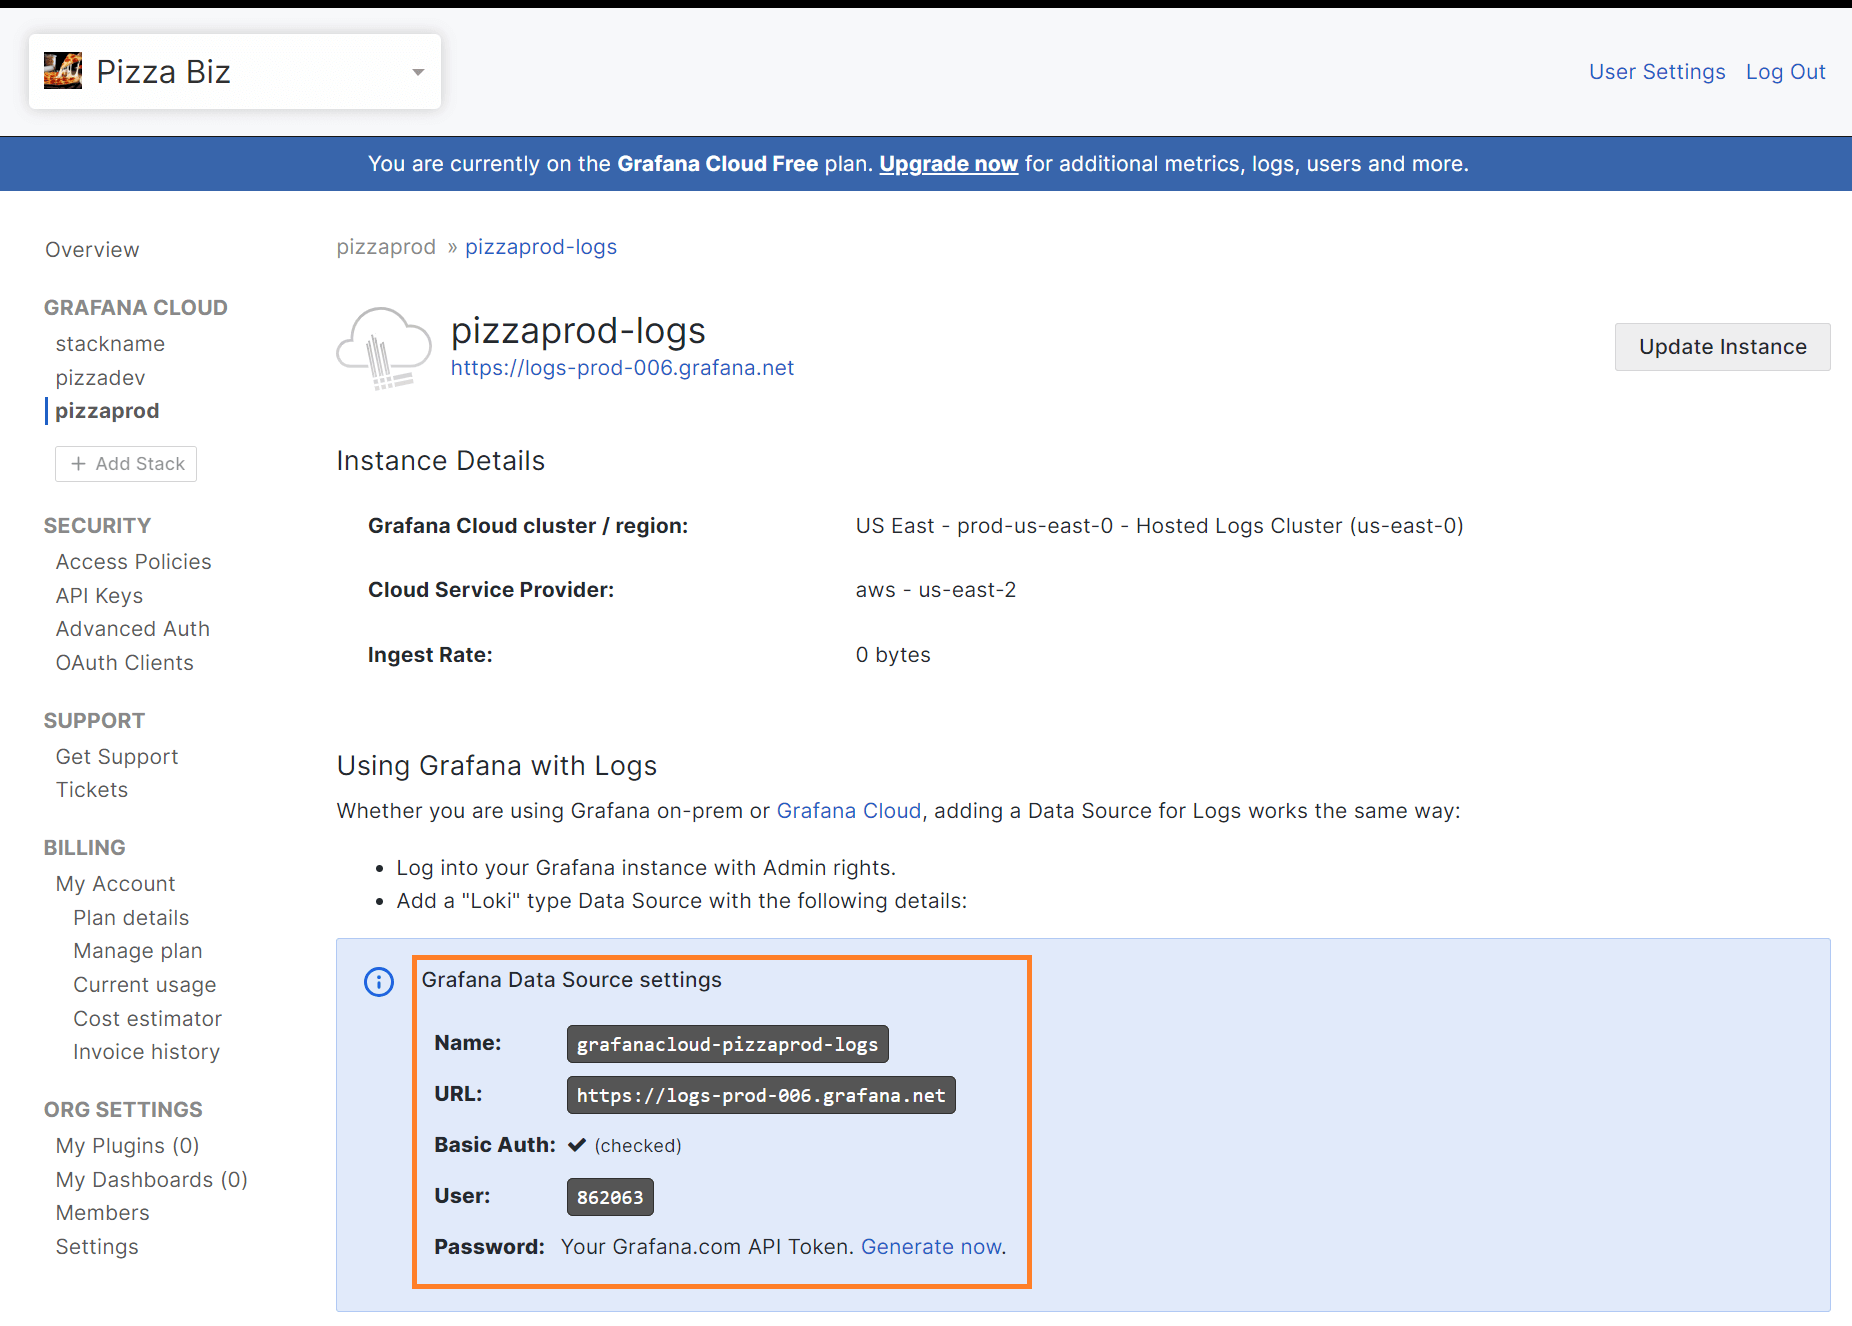
Select the stack name and click on the Details button to find the associated endpoint URL, instance ID, and configuration snippets. These snippets include example configurations for Grafana Alloy.
For example, to find the details needed to send logs to Grafana Cloud using Alloy select the stack name from the overview menu on the left, and then click on the Details button:

This page contains the hosted Loki data source details:

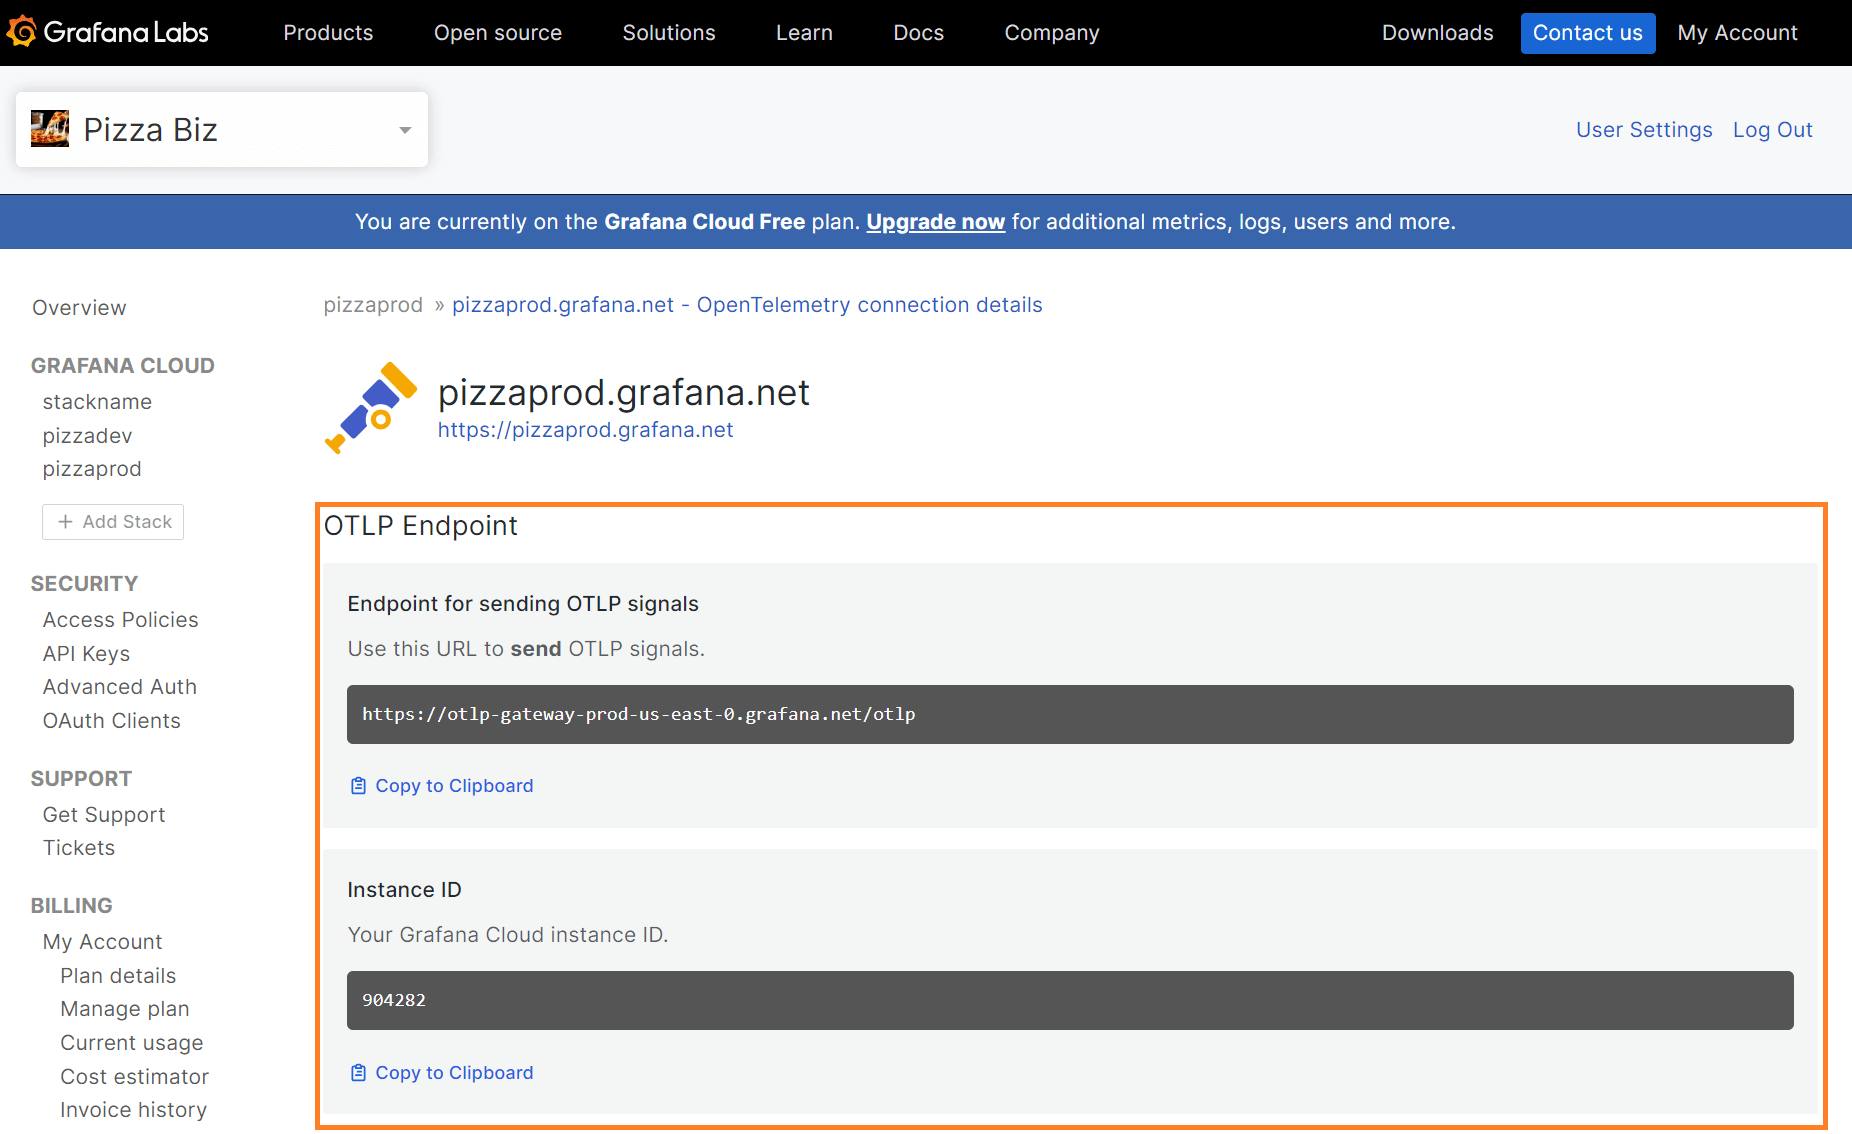
To locate the OpenTelemetry endpoint details, select the stack name from the overview menu on the left, then click on the Configure button and review the OTLP Endpoint information:


