Important: This documentation is about an older version. It's relevant only to the release noted, many of the features and functions have been updated or replaced. Please view the current version.
Beyla RED metrics dashboard
You could start composing your PromQL queries for better visualization of your auto-instrumented RED metrics; to save you time, we provide a sample public dashboard with some basic information.
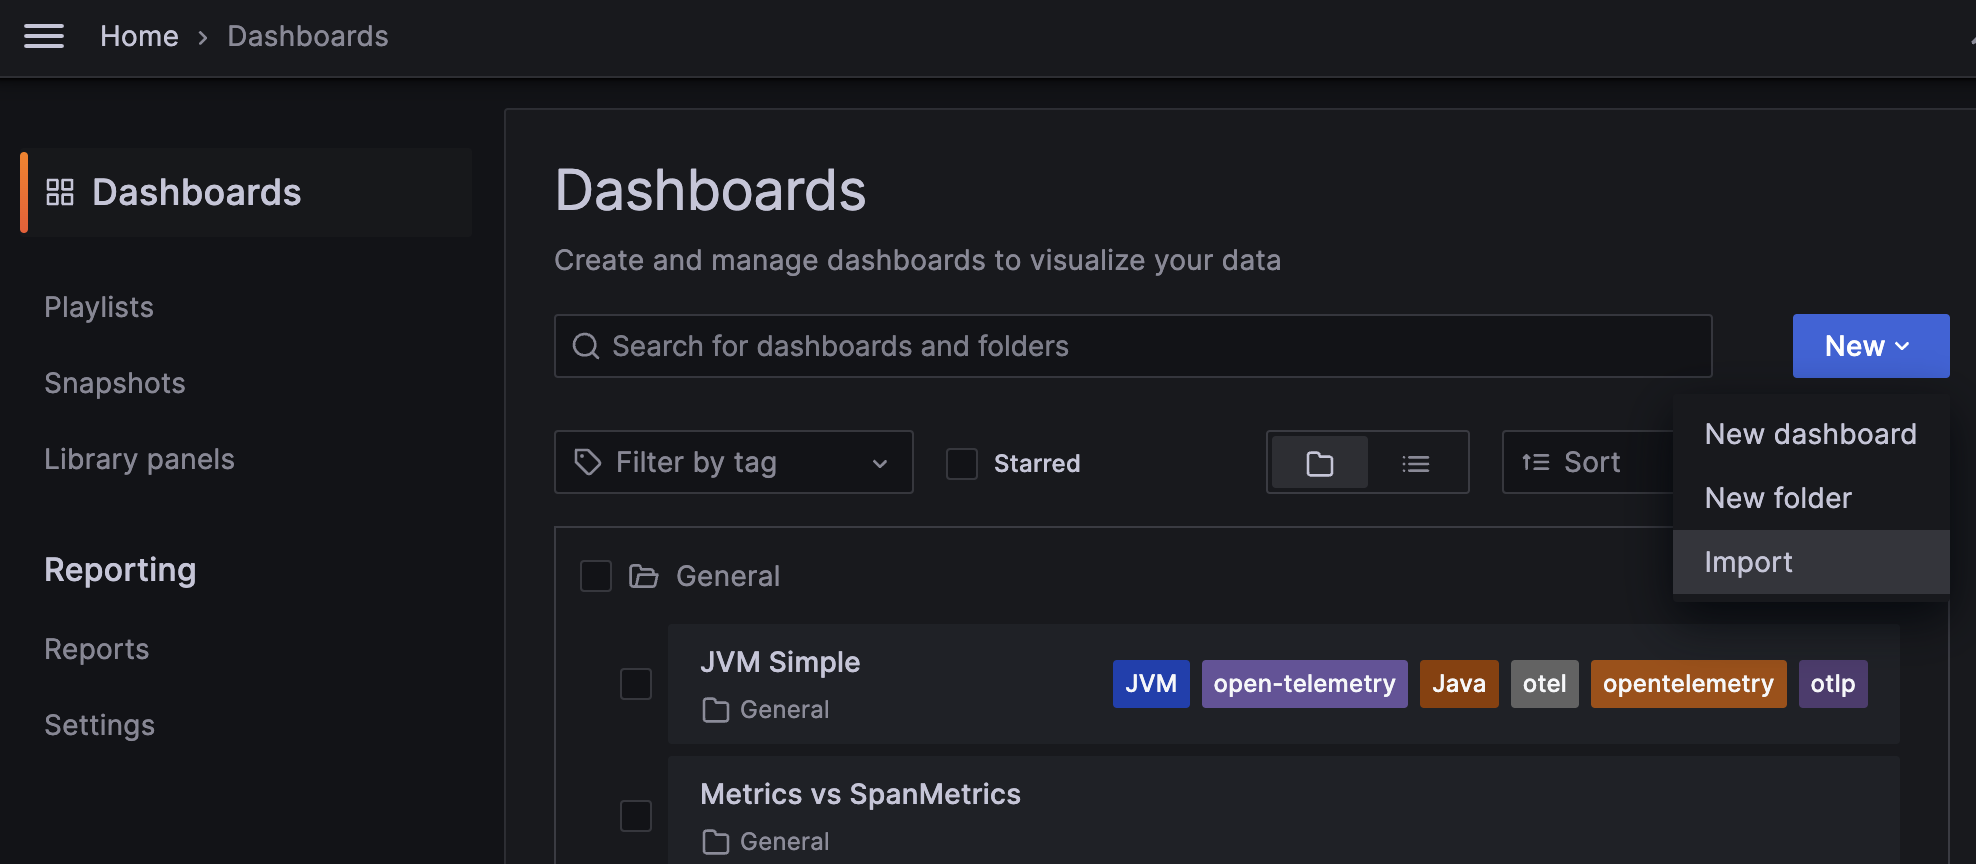
To import the sample dashboard into your Grafana instance, choose “Dashboards” in the Grafana left panel. Next, in the Dashboards page, click on the “New” drop-down menu and select “Import”:

In the “Import via grafana.com” textbox, copy the Grafana ID from the
Beyla RED Metrics
dashboard: 19923.
Rename the dashboard to match your service, select the folder and, most importantly, select the
data source in the prometheus-data-source drop-down at the bottom.
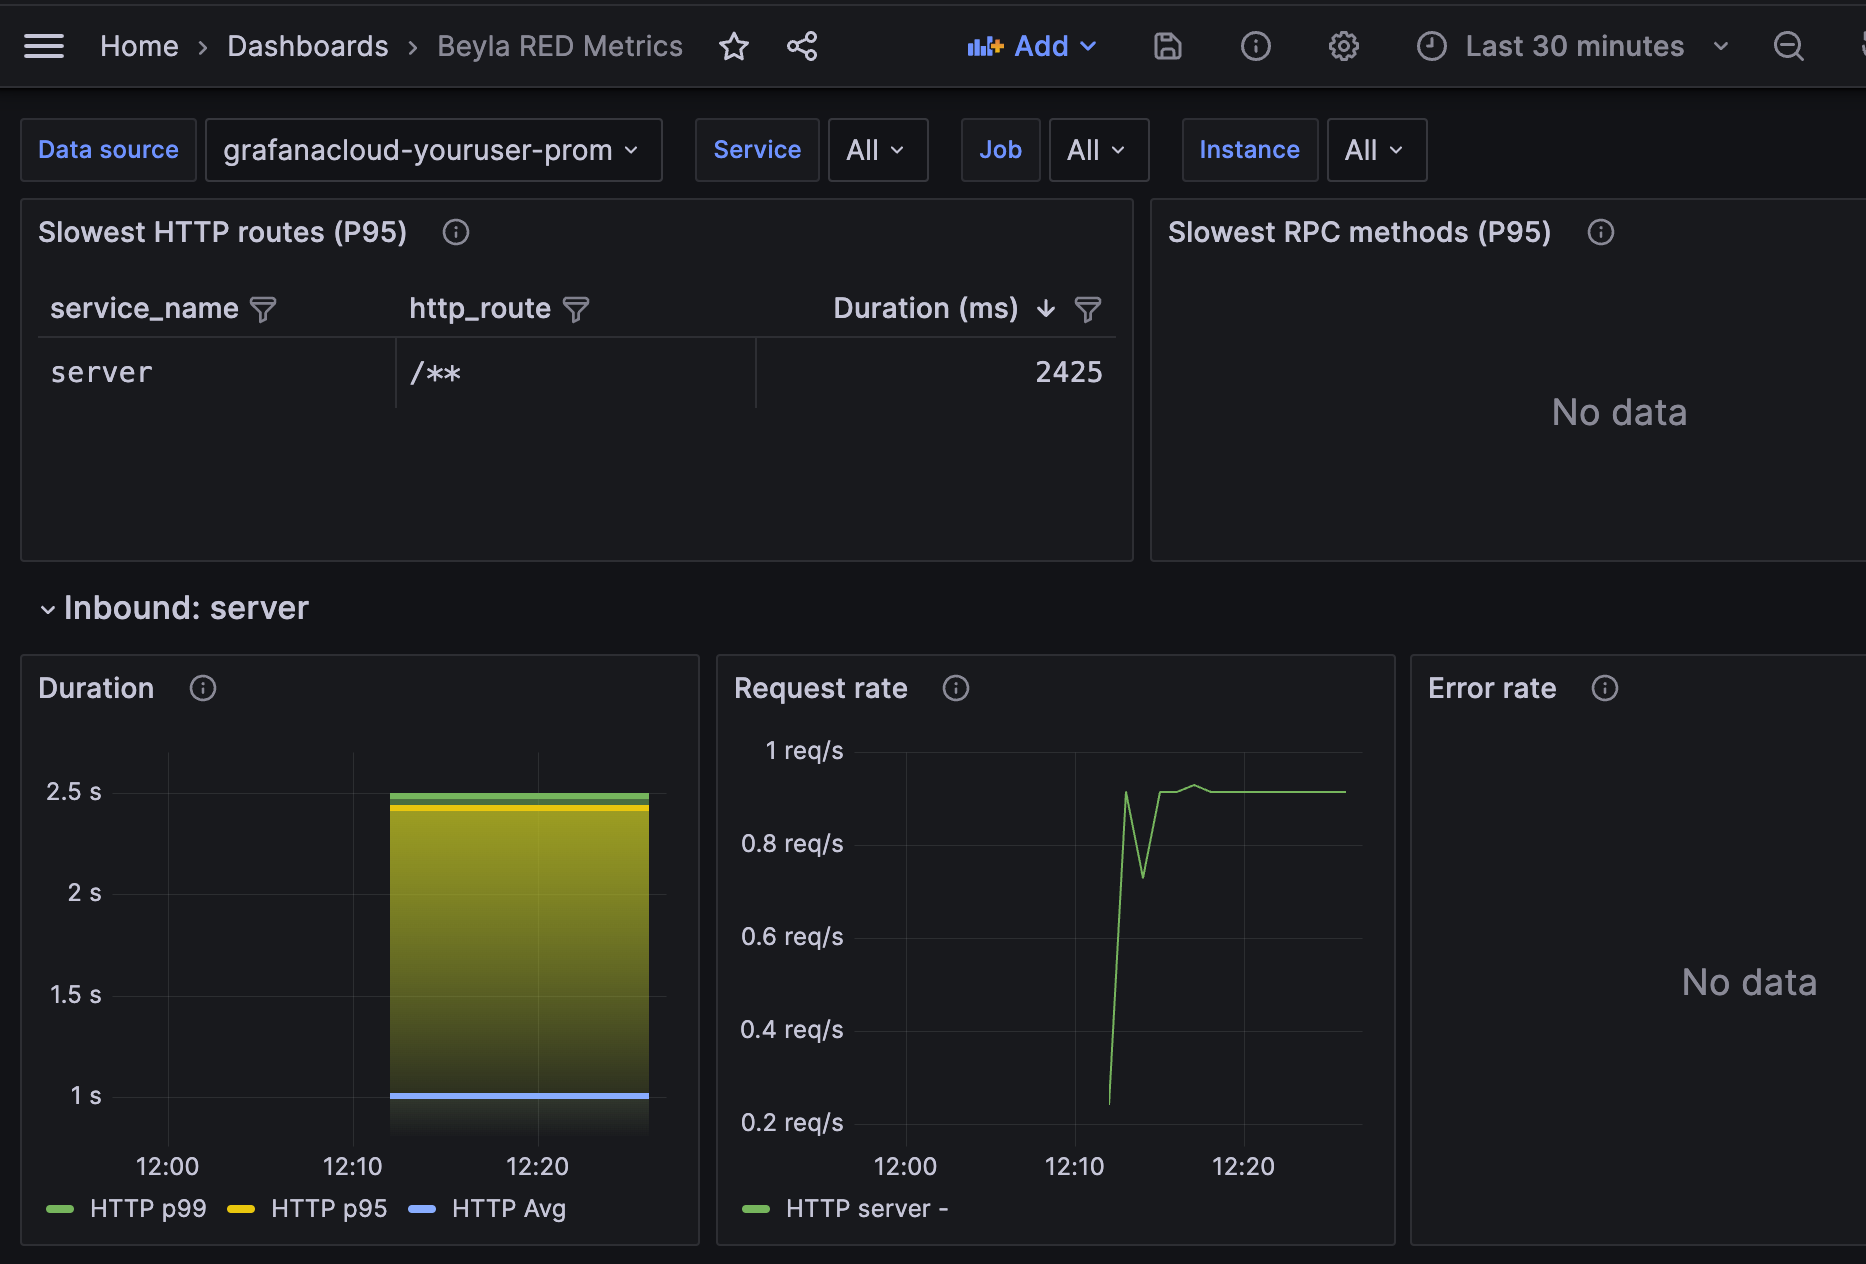
And voilà! you can see some of your test RED metrics:

The dashboard contains the following components:
- A list with the slowest HTTP routes for all instrumented services. Since you only have a single service, only one entry appears. If you configure Beyla to report the HTTP routes, many entries could appear there, one for each HTTP path seen by the server.
- A list with the slowest GRPC methods. Since the test service in this tutorial only serves HTTP, this table is empty.
- For each instrumented service, a list of RED metrics for the inbound (server) traffic. This includes:
- Duration: average and top percentiles for both HTTP and gRPC traffic.
- Request rate: number of requests per second, faceted by its HTTP or gRPC return code.
- Error rate as a percentage of 5xx HTTP responses or non-zero gRPC responses over the total of the requests. They are faceted by return code.
- For each instrumented service, a list of RED metrics for the outbound (client) traffic. In
the above screenshot they are empty because the test service does not perform HTTP or gRPC
calls to other services.
- The Duration, Request Rate and Errors charts are analogues to the inbound traffic charts, with the only difference that 4xx return codes are also considered errors on the client side.
At the top of the chart, you can use the “Service” dropdown to filter the services you want to visualize.


