Build a streaming data source plugin
This tutorial will teach you how to build a Grafana streaming data source plugin using the create-plugin tool and example source code.
A streaming data source plugin refreshes the data in your plugin only when new data is available in your data source. This approach is different than the typical method in which a dashboard is set to automatically refresh at a specified interval. The main advantage of streaming is that it eliminates the overhead of running your queries all over again each time the data needs updating.
This tutorial shows how to create a data source backend plugin with both a frontend and a backend. When you have completed the tutorial, you will have built a plugin that generates random numbers on the backend that are returned to the frontend as a visualization.
Example screenshot and code
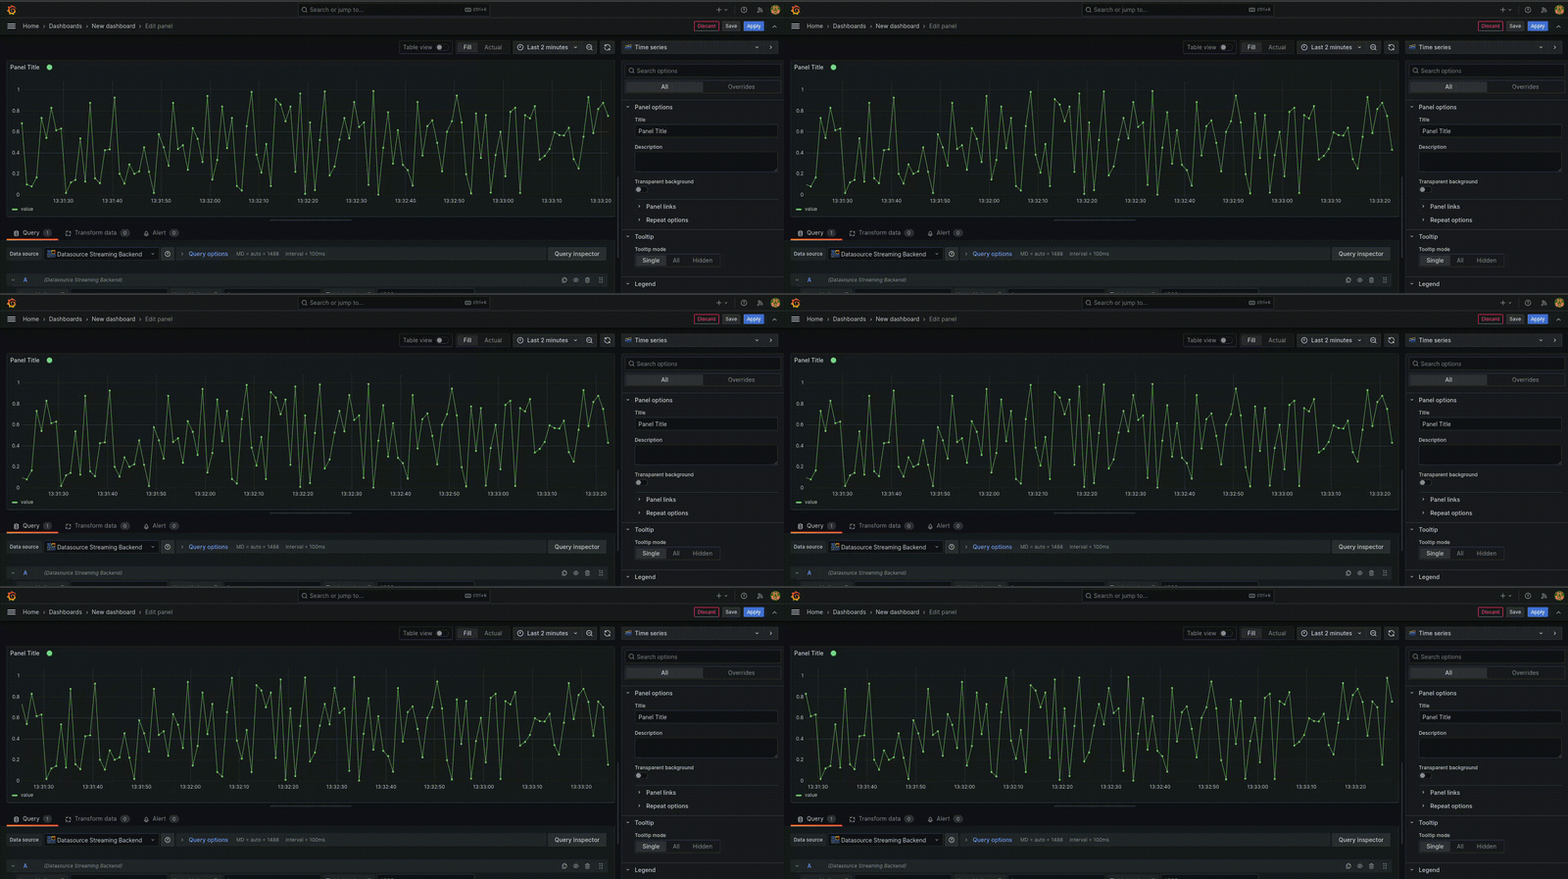
The following image shows a panel using this data source:

Step 1: Scaffold the plugin
It is possible to create all the plugin code from scratch, as long as you follow the Grafana plugins specification and implement all the necessary interfaces. However, the easiest way to create a plugin is using the @grafana/create-plugin tool that we provide.
- Go to the location where you want your plugin directory to be created and run:
npx @grafana/create-plugin@latest
For a complete list of prerequisites and suggestions for setting up your development environment, refer to Get started.
Create Plugin will prompt you with some questions about your plugin name and type, your organization, and many other options.
- For this tutorial, enter
data sourcefor the type of the plugin, and specify that it has a backend part.
The tool will create a skeleton with all the necessary code and dependencies to run a data source backend plugin. And, if you compile the code, you will have a very simple backend plugin. However, this generated code isn't a streaming plugin yet, and we need to make some modifications.
Step 2: Set up the frontend
As we want to pass some parameters to the backend part of the plugin, we first alter /src/components/QueryEditor.tsx. This component defines the inputs that the user can provide to the query. We will add three number inputs, used to generate our data:
tickInterval- the interval for generating the dataupperLimit- the upper limit for the random numberslowerLimit- the lower limit for the random numbers
To accomplish this, follow these steps.
- Replace the
QueryEditorfunction in/src/components/QueryEditor.tsxwith the following code:
export function QueryEditor({ query, onChange, onRunQuery }: Props) {
  const onLowerLimitChange = (event: ChangeEvent<HTMLInputElement>) => {
    onChange({ ...query, lowerLimit: event.target.valueAsNumber });
  };

  const onUpperLimitChange = (event: ChangeEvent<HTMLInputElement>) => {
    onChange({ ...query, upperLimit: event.target.valueAsNumber });
  };

  const onTickIntervalChange = (event: ChangeEvent<HTMLInputElement>) => {
    onChange({ ...query, tickInterval: event.target.valueAsNumber });
  };

  const { upperLimit, lowerLimit, tickInterval } = query;

  return (
    <>
      <InlineField label="Lower Limit" labelWidth={16} tooltip="Random numbers lower limit">
        <Input onChange={onLowerLimitChange} onBlur={onRunQuery} value={lowerLimit || ''} type="number" />
      </InlineField>
      <InlineField label="Upper Limit" labelWidth={16} tooltip="Random numbers upper limit">
        <Input onChange={onUpperLimitChange} onBlur={onRunQuery} value={upperLimit || ''} type="number" />
      </InlineField>
      <InlineField label="Tick interval" labelWidth={16} tooltip="Server tick interval">
        <Input onChange={onTickIntervalChange} onBlur={onRunQuery} value={tickInterval || ''} type="number" />
      </InlineField>
    <>
  );
}
- In the
src/datasource.tsfile, indicate a query through a stream channel. This file is where the query executed by the frontend part of your plugin is made. Add the following method to theDataSourceclass:
  query(request: DataQueryRequest<MyQuery>): Observable<DataQueryResponse> {
    const observables = request.targets.map((query, index) => {

      return getGrafanaLiveSrv().getDataStream({
        addr: {
          scope: LiveChannelScope.DataSource,
          namespace: this.uid,
          path: `my-ws/custom-${query.lowerLimit}-${query.upperLimit}-${query.tickInterval}`, // this will allow each new query to create a new connection
          data: {
            ...query,
          },
        },
      });
    });

    return merge(...observables);
  }
The call to getGrafanaLiveSrv() returns a reference to a Grafana backend, and the getDataStream call creates the stream. As shown in this code snippet, we need to provide some data to create the stream:
scope- defines how the channel is used and controlled (specifydata source)namespace- unique identifier for our specific data sourcepath- part that can distinguish between channels created by the same data source. In this example, we want to create a different channel for every query, so we will use the query parameters as part of the path.data- used to exchange information between the frontend and the backend
It's worth mentioning that the path can be used to exchange data with the backend part as well, but for complex formats, use the data property.
The stream is uniquely identified by a combination of parameters and it will have the format: ${scope}/${namespace}/${path}. This is only an implementation detail and you probably won't need to know this except for debugging.
Step 3: Set up the plugin backend
Now we need to add the necessary code to the backend. For that, we change pkg/plugin/datasource.go, this is where the backend part responsible for handling the queries created by the frontend is defined. In our case, as we want to handle a stream, we need to implement the backend.StreamHandler.
- Add the following part in the replacement of the
var:
var (
    _ backend.CheckHealthHandler    = (*Datasource)(nil)
    _ instancemgmt.InstanceDisposer = (*Datasource)(nil)
    _ backend.StreamHandler         = (*Datasource)(nil)
)
That means our DataSource will implement backend.CheckHealthHandler, instancemgmt.InstanceDisposer, and backend.StreamHandler. The methods necessary for the first two are already provided in the scaffold; therefore, we need to implement only the methods necessary for backend.StreamHandler.
- Let's start by adding the
SubscribeStreammethod:
func (d *Datasource) SubscribeStream(context.Context, *backend.SubscribeStreamRequest) (*backend.SubscribeStreamResponse, error) {
    return &backend.SubscribeStreamResponse{
        Status: backend.SubscribeStreamStatusOK,
    }, nil
}
This code will be called when the user tries to subscribe to a channel. You can implement permissions checking here, but in our case we just want the user to connect successfully in each attempt; therefore, we just return a backend: SubscribeStreamStatusOK.
- Implement the
PublishStreammethod:
func (d *Datasource) PublishStream(context.Context, *backend.PublishStreamRequest) (*backend.PublishStreamResponse, error) {
    return &backend.PublishStreamResponse{
        Status: backend.PublishStreamStatusPermissionDenied,
    }, nil
}
This code is called whenever a user tries to publish to a channel. As we don't want to receive any data from the frontend after the first connection is created, we will just return a backend.PublishStreamStatusPermissionDenied.
- To prevent a random error, change the
CheckHealthmethod provided by default for the following code:
  func (d *Datasource) CheckHealth(_ context.Context, req *backend.CheckHealthRequest) (*backend.CheckHealthResult, error) {
    return &backend.CheckHealthResult{
      Status:  backend.HealthStatusOk,
      Message: "Data source is working",
    }, nil
  }
Note that this code is not related to the streaming plugin itself. It's just to avoid a random error that will be caused by not changing the default.
- Finally, implement the
RunStreammethod:
func (d *Datasource) RunStream(ctx context.Context, req *backend.RunStreamRequest, sender *backend.StreamSender) error {
    q := Query{}
    json.Unmarshal(req.Data, &q)

    s := rand.NewSource(time.Now().UnixNano())
    r := rand.New(s)

    ticker := time.NewTicker(time.Duration(q.TickInterval) * time.Millisecond)
    defer ticker.Stop()

    for {
        select {
        case <-ctx.Done():
            return ctx.Err()
        case <-ticker.C:
            // we generate a random value using the intervals provided by the frontend
            randomValue := r.Float64()*(q.UpperLimit-q.LowerLimit) + q.LowerLimit

            err := sender.SendFrame(
                data.NewFrame(
                    "response",
                    data.NewField("time", nil, []time.Time{time.Now()}),
                    data.NewField("value", nil, []float64{randomValue})),
                data.IncludeAll,
            )

            if err != nil {
                Logger.Error("Failed send frame", "error", err)
            }
        }
    }
}
Once implemented, this method will be called once per connection and this is where we can parse the data sent by the frontend so that Grafana can send the data back continuously. In this specific example, we will use the data sent by the frontend to define the frequency at which we will be sending frames and the range of random numbers generated.
Therefore, the first part of the method parses the data and the query is defined as a struct.
- Add the following code to
./pkg/plugin/query.go:
  type Query struct {
      UpperLimit   float64 `json:"upperLimit"`
      LowerLimit   float64 `json:"lowerLimit"`
      TickInterval float64 `json:"tickInterval"`
  }
In this example, we are creating a ticker and an infinity loop based on this ticker. Whenever the ticker times out, we will enter the second case of the select and generate a random number randomValue. After we will create a data frame using data.NewFrame, that contains the randomValue and the current time, and send it using sender.SendFrame. This loop will run indefinitely until we close the channel.
You can remove the method QueryData that is created by the scaffold and all the code related to it since we are not implementing the backend.QueryDataHandler anymore.
Step 4: Modify plugin.json
Grafana needs to recognize that the new plugin is a streaming plugin when it's first loaded. To accomplish this, simply add the "streaming":true property to your src/plugin.json. It should look like this:
{
  ...
  "id": "grafana-streamingbackendexample-datasource",
  "metrics": true,
  "backend": true,
  ...
  "streaming": true
}
Step 5: Build the plugin
The coding part of the plugin development process is done. Now we need to generate our plugin package to be able to run it in Grafana. Since our plugin has both a frontend and a backend part, we do this in two steps.
- Build the frontend:
npm install
npm run build
This should download all the dependencies and create the frontend plugin files in the ./dist directory.
- Compile the backend code and generate the plugin binaries. For that you should have
mageinstalled and then you simply need to run:
mage -v
This command compiles the Go code and generate binaries for all Grafana-supported platforms in ./dist.
Step 6: Run the plugin
Once the plugin is built, you can copy ./dist together with its content, rename it to the id of your plugin, put it in the plugin's path of your Grafana instance, and test it.
However, there is an easier way of doing all this.
- Simply run:
npm run server
This command runs a Grafana container using docker compose and puts the built plugins in the right place.
- To verify the build, go to Grafana at
https://localhost:3000.
Step 7: Test the plugin
-
From Grafana at
https://localhost:3000, use the default credentials: usernameadminand passwordadmin. If you're not presented with a login page, click Sign in in the top of the page and insert the credentials. -
Add the data source. Since we are running in our
docker composeenvironment, we don't need to install it, and it will be directly available for usage. Go to Connections > Data sources, using the left menu as shown in the following image: -
A new page opens, and then click Add data source. Grafana opens another page where you can search for the data source name that we've just created.
-
Click the data source's card, and then click Save & test on the next page.
-
Click Build a dashboard in the right upper corner. On the next page, click a button to + Add visualization. On the dialog box, click the newly added data source. Data begins to appear like so:
-
To visualize the data better, change the visualization time range to something like 1 minute from now and apply it.
At that point, you should start seeing data in real-time. You can change the upper and lower limit or the tick interval if you want. This will generate a new query and the panel will be updated. You can also add more queries if you want.

You have successfully created a Grafana streaming data source plugin with both a frontend and backend. The plugin is ready for you to customize to suit your specific needs.