Include dashboards with an app plugin
This guide explains how to add pre-configured dashboards into app plugins. By integrating pre-configured dashboards into your plugin, you can provide your users with a ready-to-use template, freeing them from having to build a dashboard from scratch.
We'll walk you through the process of bundling dashboards into plugins. The process involves creating a dashboard, adding it to your plugin, and then importing it into the plugin. You can also optionally add navigation links to make it easier for users to discover all its features.
Step 1: Create a dashboard
Start by creating the dashboard you want to bundle with your plugin. The development environment provided by create-plugin can aid with creating and testing dashboards.
Set up a data source variable
To facilitate user customization, create a dashboard data source variable. This allows users to link their own data source instances easily once imported.
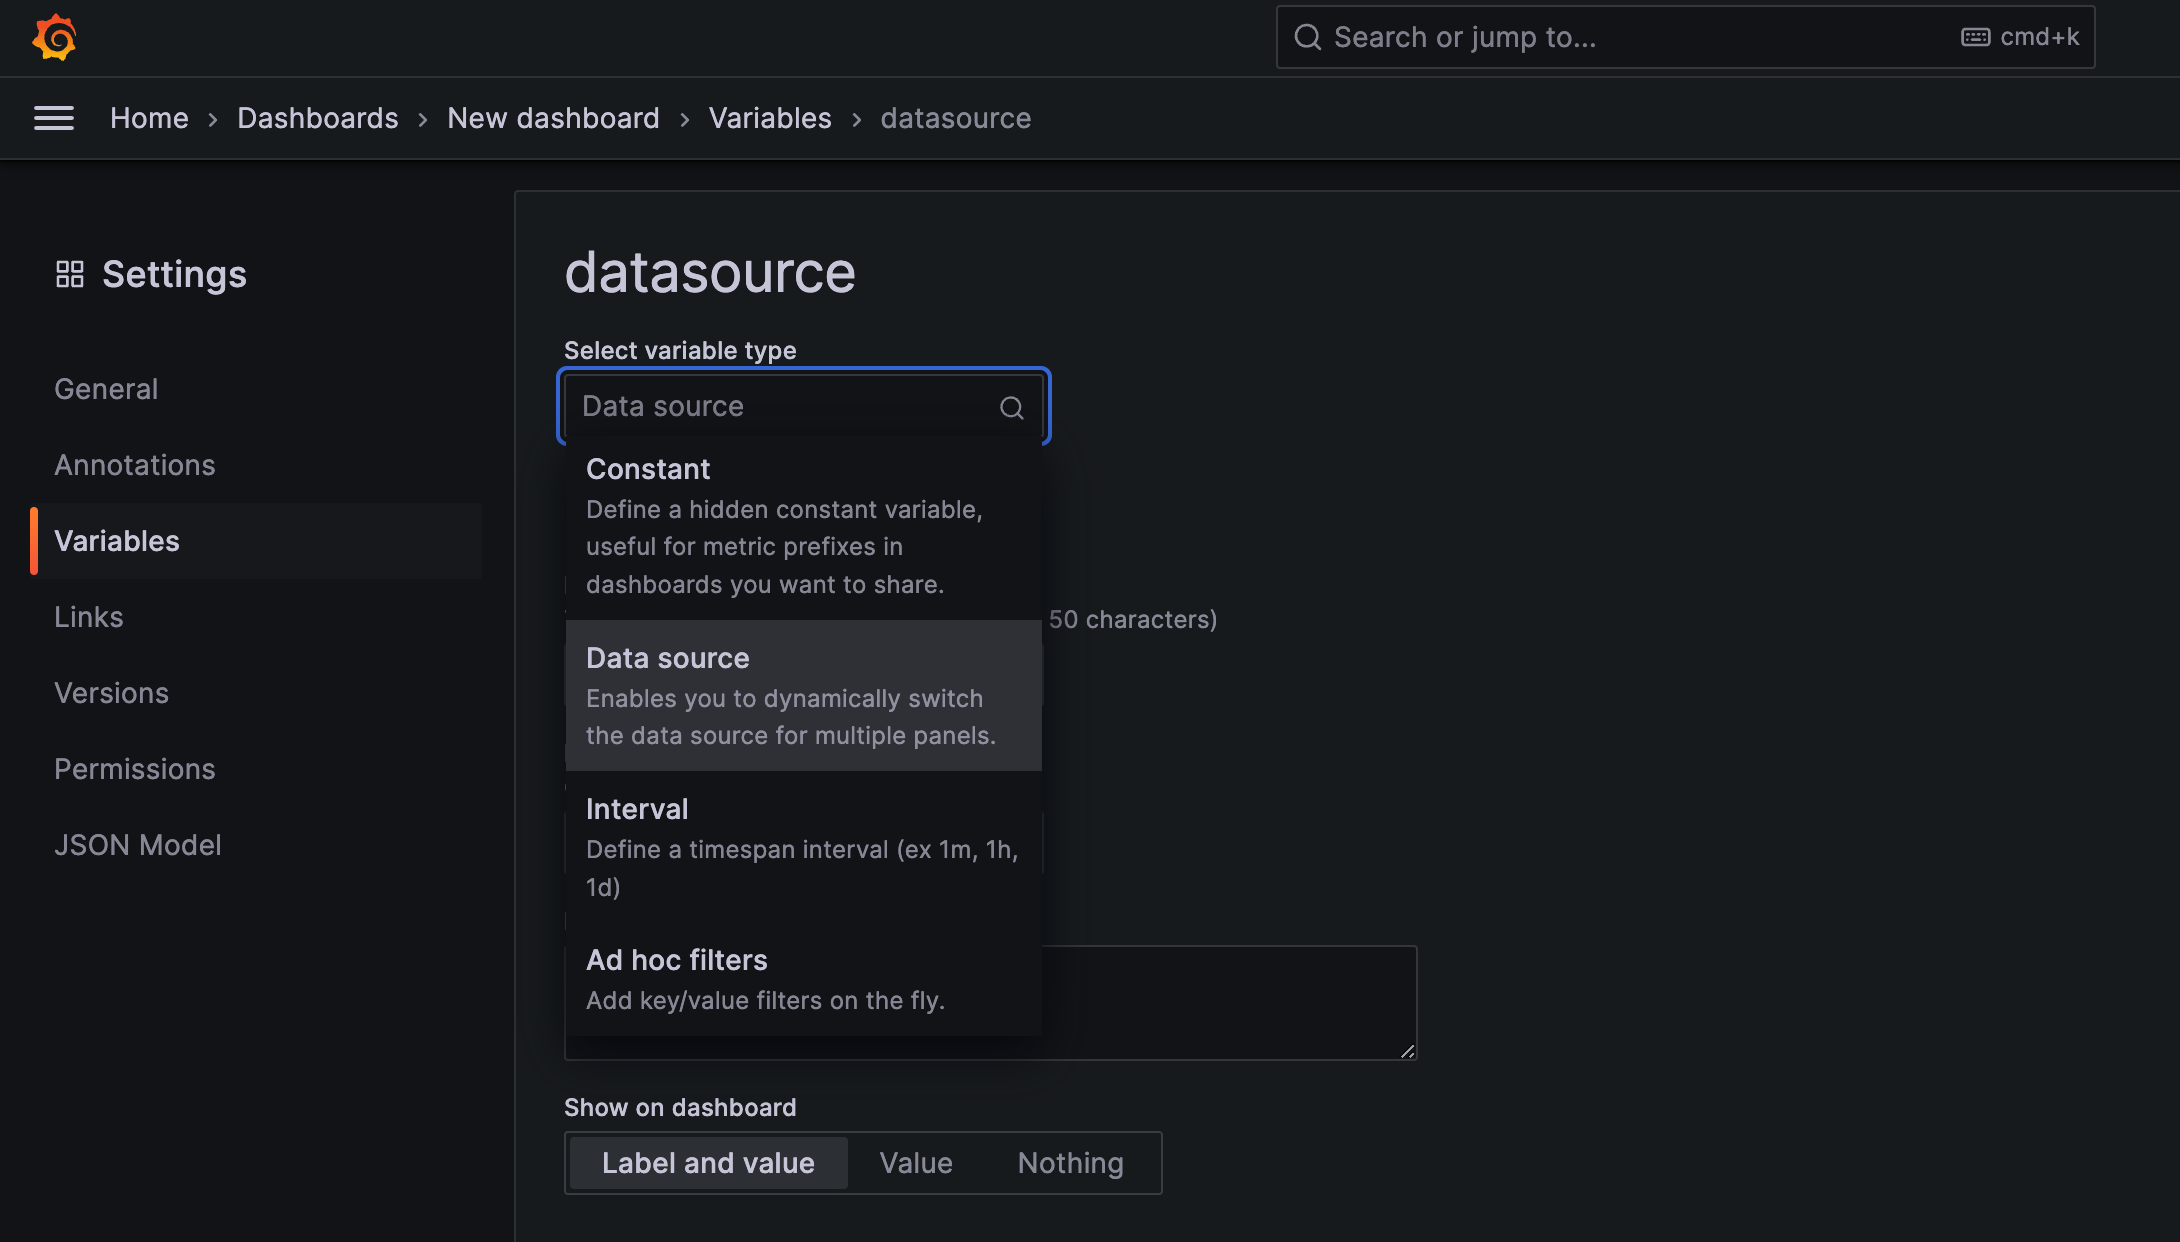
- Create a data source variable by choosing the data source variable type and give it a name.

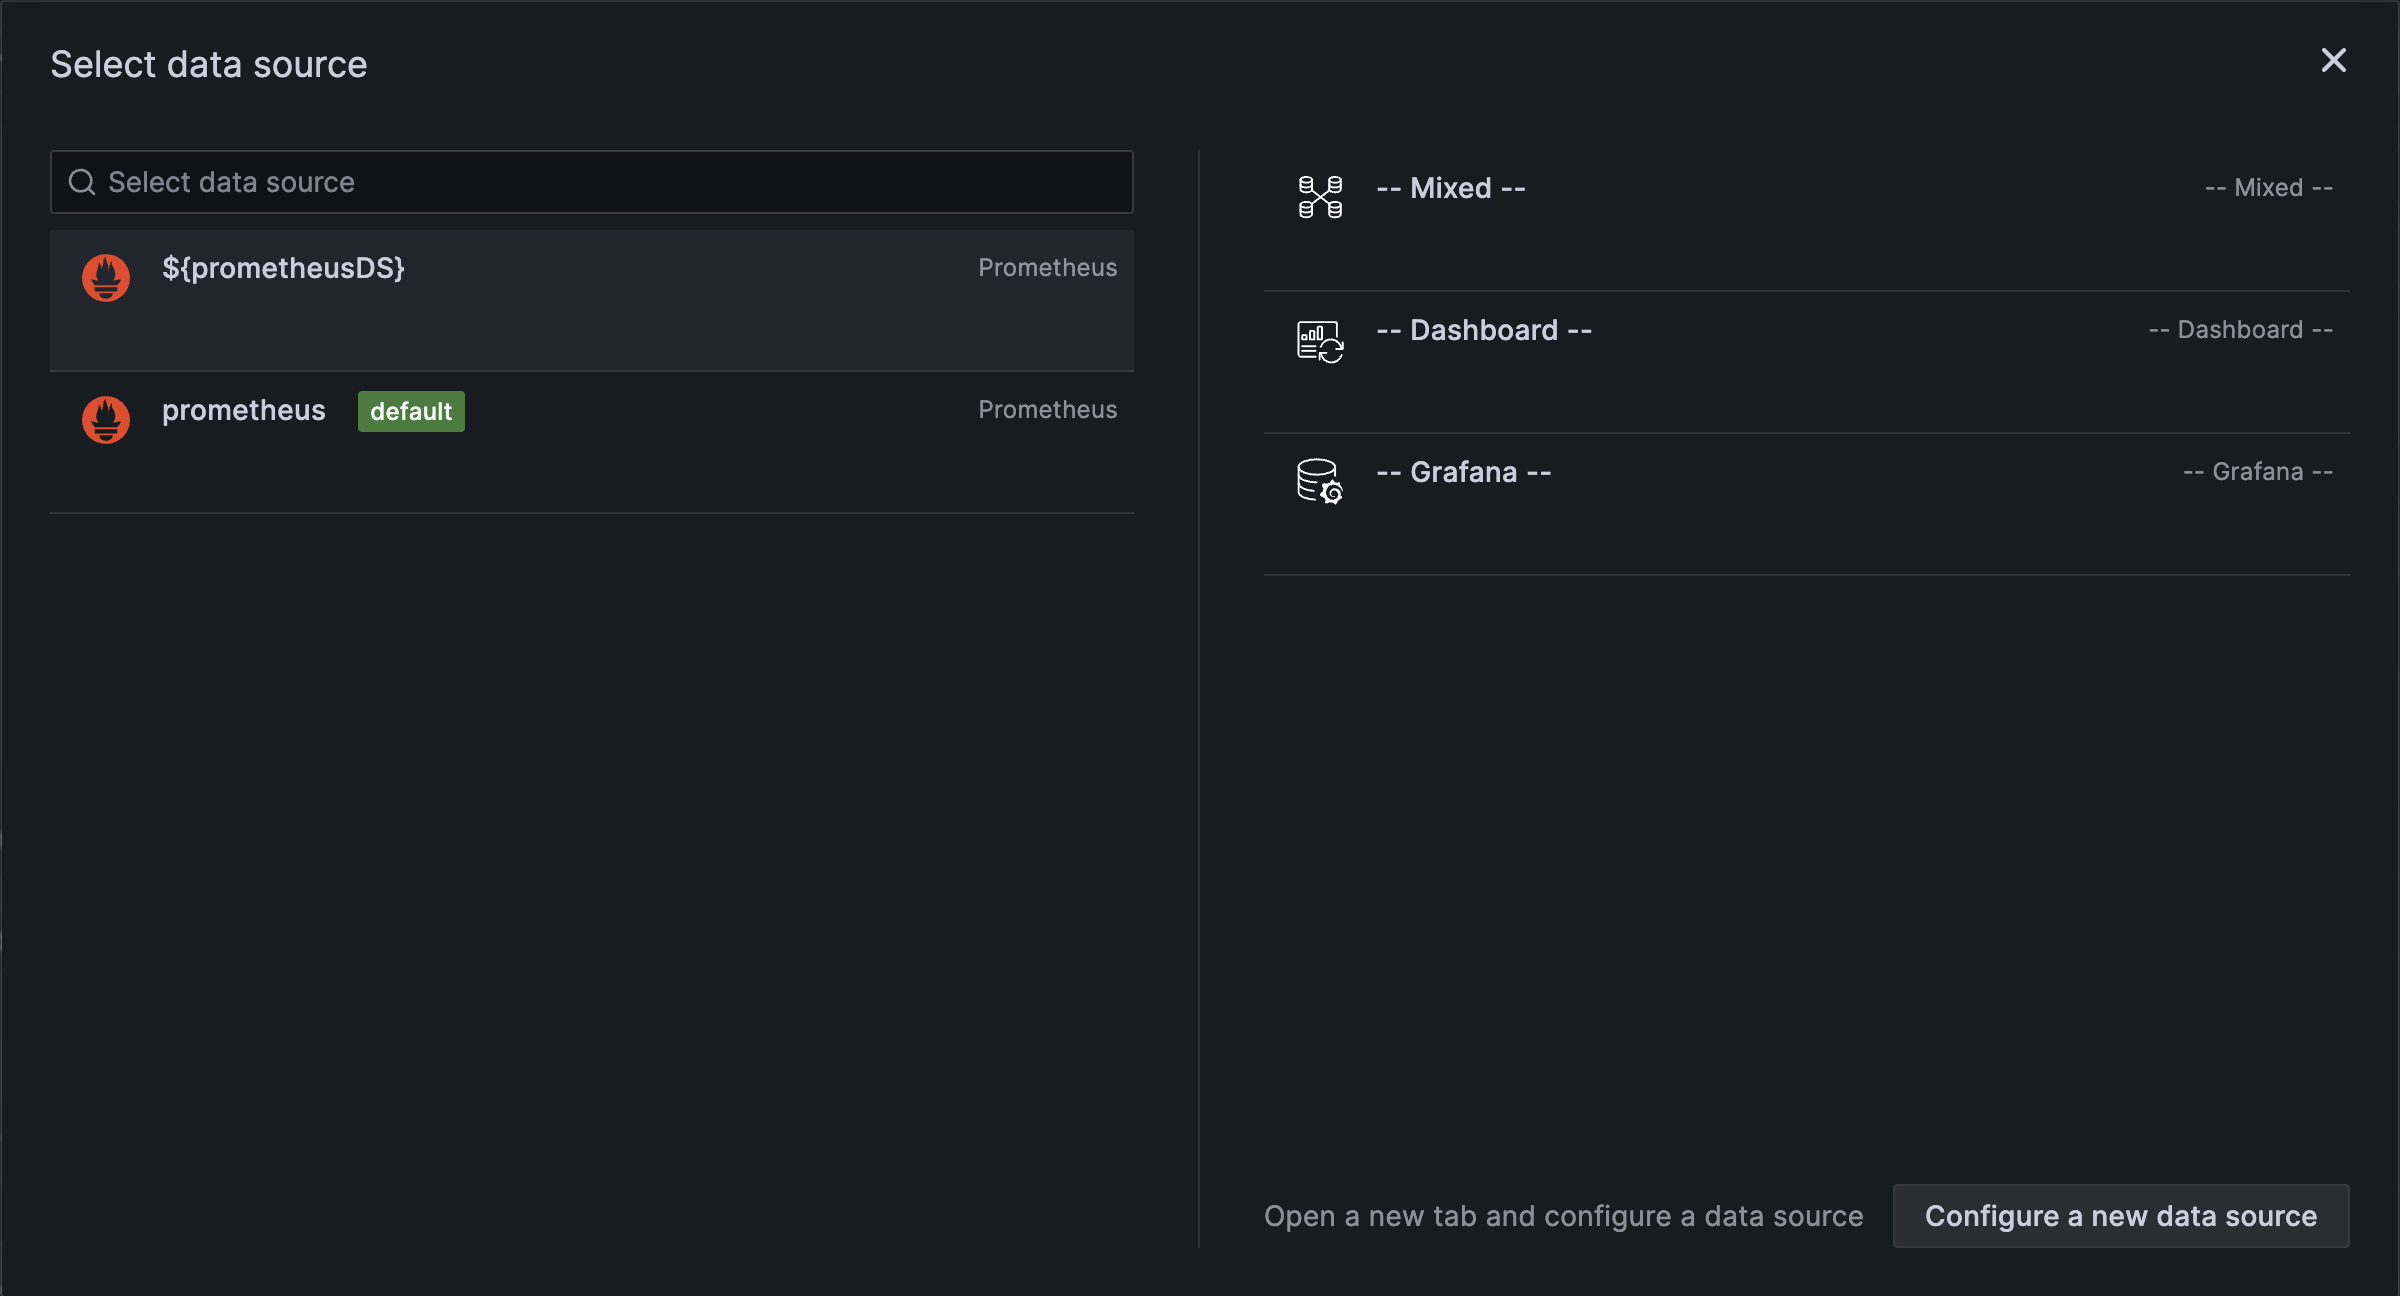
Data source variable - Select the data source variable as the data source for each panel that you create.

Data source selection
Export the dashboard
- Go to your dashboard in the Grafana application.
- Click the Share icon at the top-left of the dashboard.
- Click Export, and then click Save to file.
- Open the dashboard JSON file in your code editor and set its
idproperty tonull.
Step 2: Add the dashboard to your plugin
-
Create a
dashboardsfolder within thesrcdirectory of your plugin project. -
Move your exported dashboard JSON file into the new
dashboardsfolder.myorg-myplugin-datasource/
└── src/
├── dashboards/
│ └── overview.json
├── module.ts
└── plugin.json -
Update your
plugin.jsonfile to include a reference to the new dashboard resource, specifying the relative path to the dashboard file within the src folder.src/plugin.json{
"includes": [
{
"name": "overview",
"path": "dashboards/overview.json",
"type": "dashboard"
}
]
}infoEnsure the path is relative to the
srcdirectory. This is necessary for the plugin to correctly reference the dashboard JSON file from thedistdirectory once you build the frontend. -
After adding the dashboard to your plugin, rebuild the plugin and restart Grafana to apply the new configuration.
-
Dashboards included in app plugins are automatically imported by the Grafana server. Navigate to your dashboard to verify it works as intended.
Step 3: Add navigation links in an app plugin (optional)
An app plugin can enhance user navigation by adding a navigation link in plugin.json. The path of the include should reference the bundled dashboard uid property.
{
  "includes": [
    {
      "name": "My App Dashboard",
      "path": "dashboards/overview.json",
      "type": "dashboard"
    },
    {
      "addToNav": true,
      "name": "My App Dashboard",
      "path": "d/ffb13c35-2f2f-4f36-99b1-bde7244e8de3",
      "type": "page"
    }
  ]
}
Conclusion
By bundling dashboards with your app plugin, you can significantly improve the user onboarding experience. Pre-configured dashboards eliminate the need for users to set up common variables, panels, or queries from scratch. This can greatly enhance user satisfaction and efficiency!