

Grafana Drilldown: first-class OpenTelemetry support now available for metrics
When we launched Grafana Drilldown, our queryless experience for quicker, easier insights into your telemetry, we focused first on Prometheus because it was—and is—such a great solution for storing time series data. But as the industry continued to evolve, a different open source project began to emerge as another standard for modern observability: OpenTelemetry
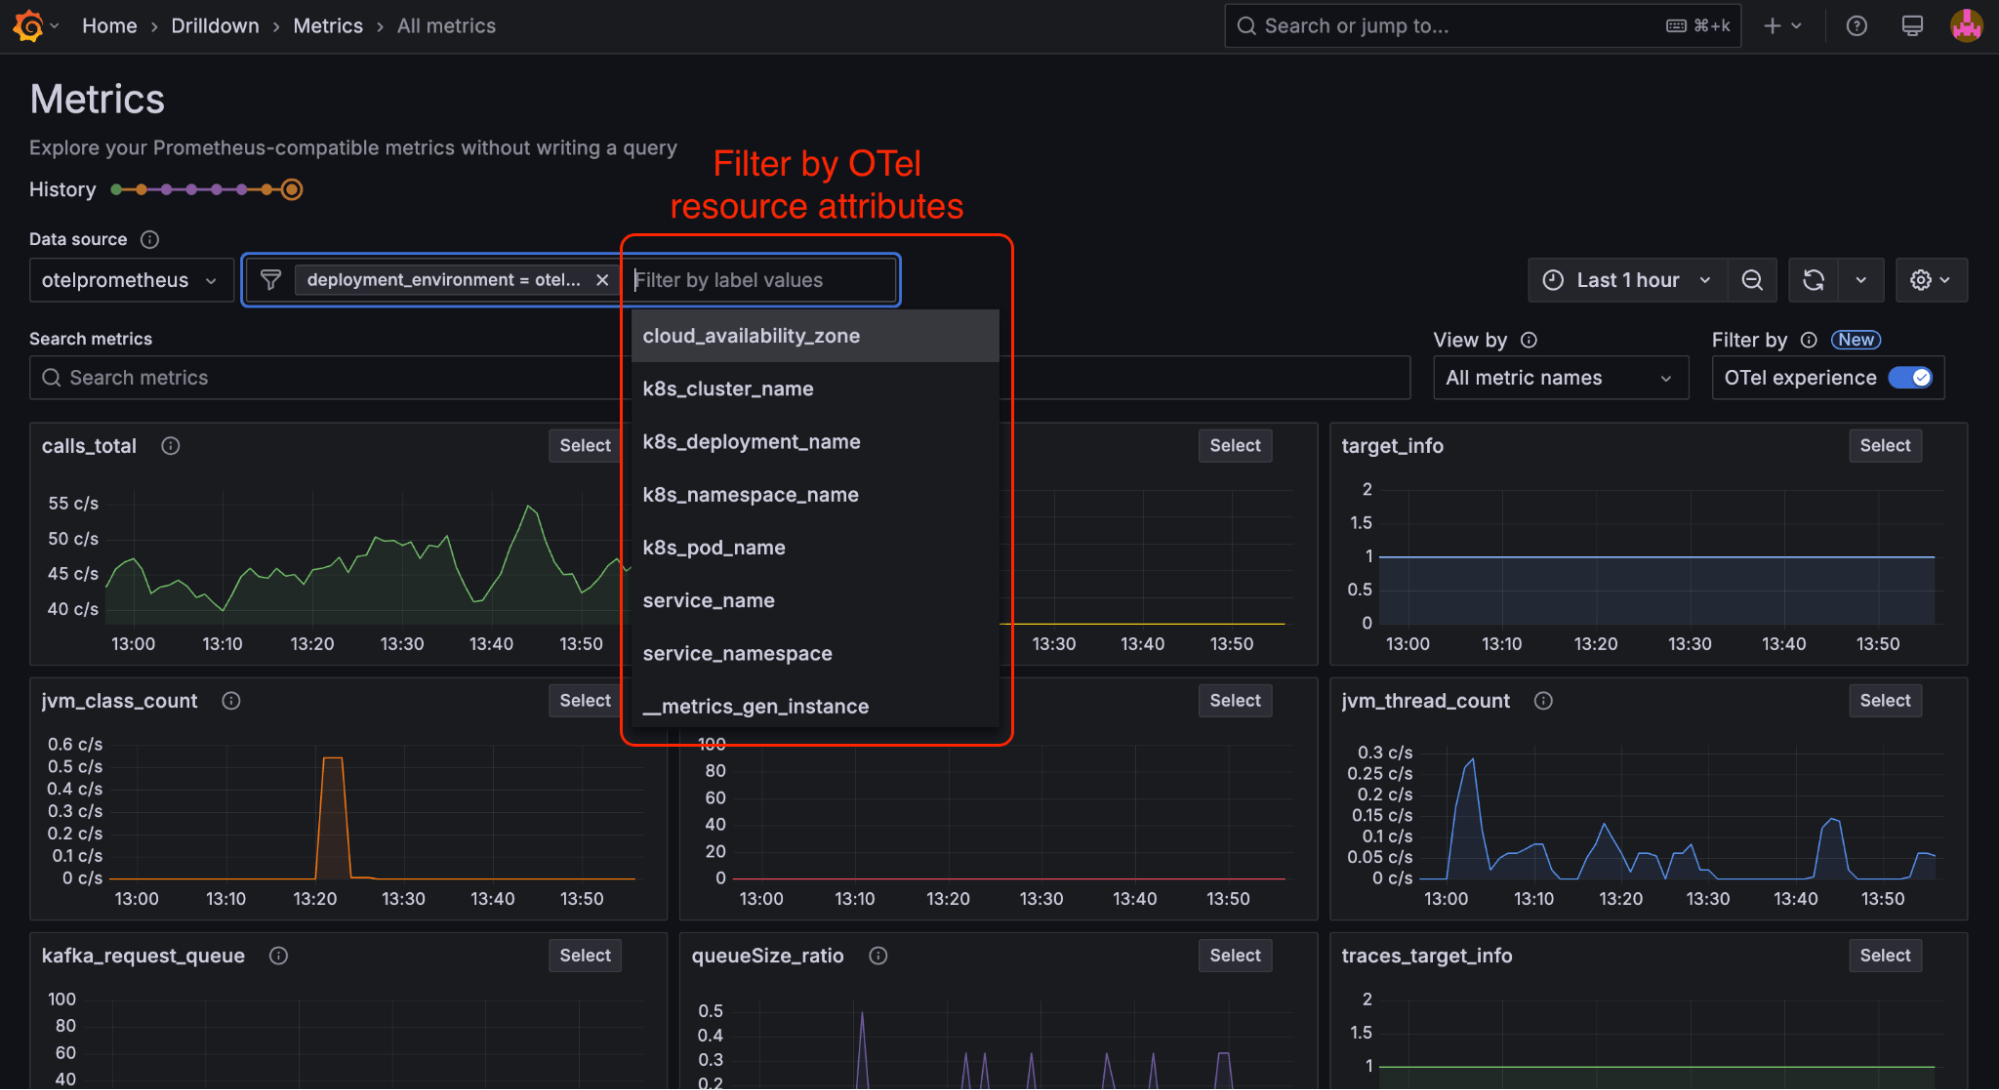
We’re big believers in OpenTelemetry—and in supporting our community’s needs—which is why we’re excited to announce that Metrics Drilldown, which is part of the Grafana Drilldown suite of apps, now supports OpenTelemetry resource attributes in the queryless experience. We’ve taken an insightful approach to metrics exploration by seamlessly integrating OpenTelemetry resource attributes with Prometheus labels. Key innovations include:
- A configurable OpenTelemetry experience accessible through a single interface
- Consolidated filtering across both Prometheus labels and OpenTelemetry resource attributes
- Intelligent query interpolation for complex metric joins
- Automatic context-aware metric filtering and breakdown
By abstracting the technical complexity of OpenTelemetry resource attribute management, you get deeper, more precise insights into distributed system performance with minimal engineering effort.
Metrics Drilldown: Prometheus + OpenTelemetry made easy
Most organizations today are using both OpenTelemetry and Prometheus in some capacity, but it isn’t always easy to get them to work together. For starters, setting up Prometheus and querying for OpenTelemetry labels (attributes) is a challenging experience. And while using resources exposed in OpenTelemetry is amazing, using them in queries requires a high degree of knowledge. Even experts don’t like to write the types of queries needed to get insights from OpenTelemetry resources.
But Metrics Drilldown (formerly known as Explore Metrics) automatically queries Prometheus, and it also automatically writes the queries that are required to filter and breakdown by OpenTelemetry resources. This makes for a much more graceful experience and is ideally suited for those that don’t want to write complex join queries or brush up on the intricacies of the two projects.
Note: OpenTelemetry is supported natively by Traces Drilldown. Support in Profiles Drilldown is currently Experimental, and we are working on improvements to our OpenTelemetry support in Logs Drilldown.
How to use the new OpenTelemetry support in Metrics Drilldown
When monitoring microservices in a distributed system, writing Prometheus queries that include OpenTelemetry resource attributes as filters is extremely helpful. Let’s look at a practical example to help illustrate this.
Imagine you’re investigating increased latency in a large e-commerce application with dozens of microservices deployed across multiple Kubernetes clusters in different regions. Users are reporting checkout slowdowns, but you need to quickly pinpoint where the issue is occurring.
Without filtering by resource attributes, you could run a basic query like this:
http_server_duration_seconds{operation="/api/checkout"} > 2But it would return high latency metrics from all instances of all services across all environments, making it difficult to isolate the problem.
Instead, you could add OpenTelemetry resource attributes as filters:
http_server_duration_seconds{operation="/api/checkout", job="payment-service", instance="pod-123"} * on(job, instance) target_info{deployment_environment="production", k8s_cluster="prod-us-west"}By using these filters, you can:
- Target specific services (payment-service)
- Focus on particular infrastructure (prod-us-west cluster)
- Filter by deployment environment (production vs staging)
- Include other contextual information like service version, cloud provider, or region
This focused query helps you quickly determine that the latency issue is isolated to the payment service in a specific region, rather than being a system-wide problem, significantly reducing your troubleshooting time and allowing for faster incident resolution.
Now with first class OpenTelemetry support in Metrics Drilldown, imagine you just selected the k8s_cluster label, selected your cluster, and the join query was written for you!
How we added first-class OpenTelemetry support
Adding first-class support means OpenTelemetry resources are treated exactly like metric labels in Metrics Drilldown. You don’t have to write complex queries or build variables that expose their OpenTelemetry resource attributes.
To make the process easy for you, we automatically fetch the attributes and write the complex queries. Here are some more details:
- OpenTelemetry resource attributes and Prometheus labels are presented in the same filter.
- Each type of filter is automatically interpolated correctly into the queries generated by Metrics Drilldown:
- Prometheus labels are filtered on the selected metric
- OpenTelemetry resource attributes are filtered on the metric
target_info, which is joined to the selected metric - Example:
my_metric{metric_filters_here:"value"} * on (job, instance) target_info{otel_resource_attribute_filter: "value"} - If an attribute is present on both the selected metric and on ‘target_info’, we filter on the metric.
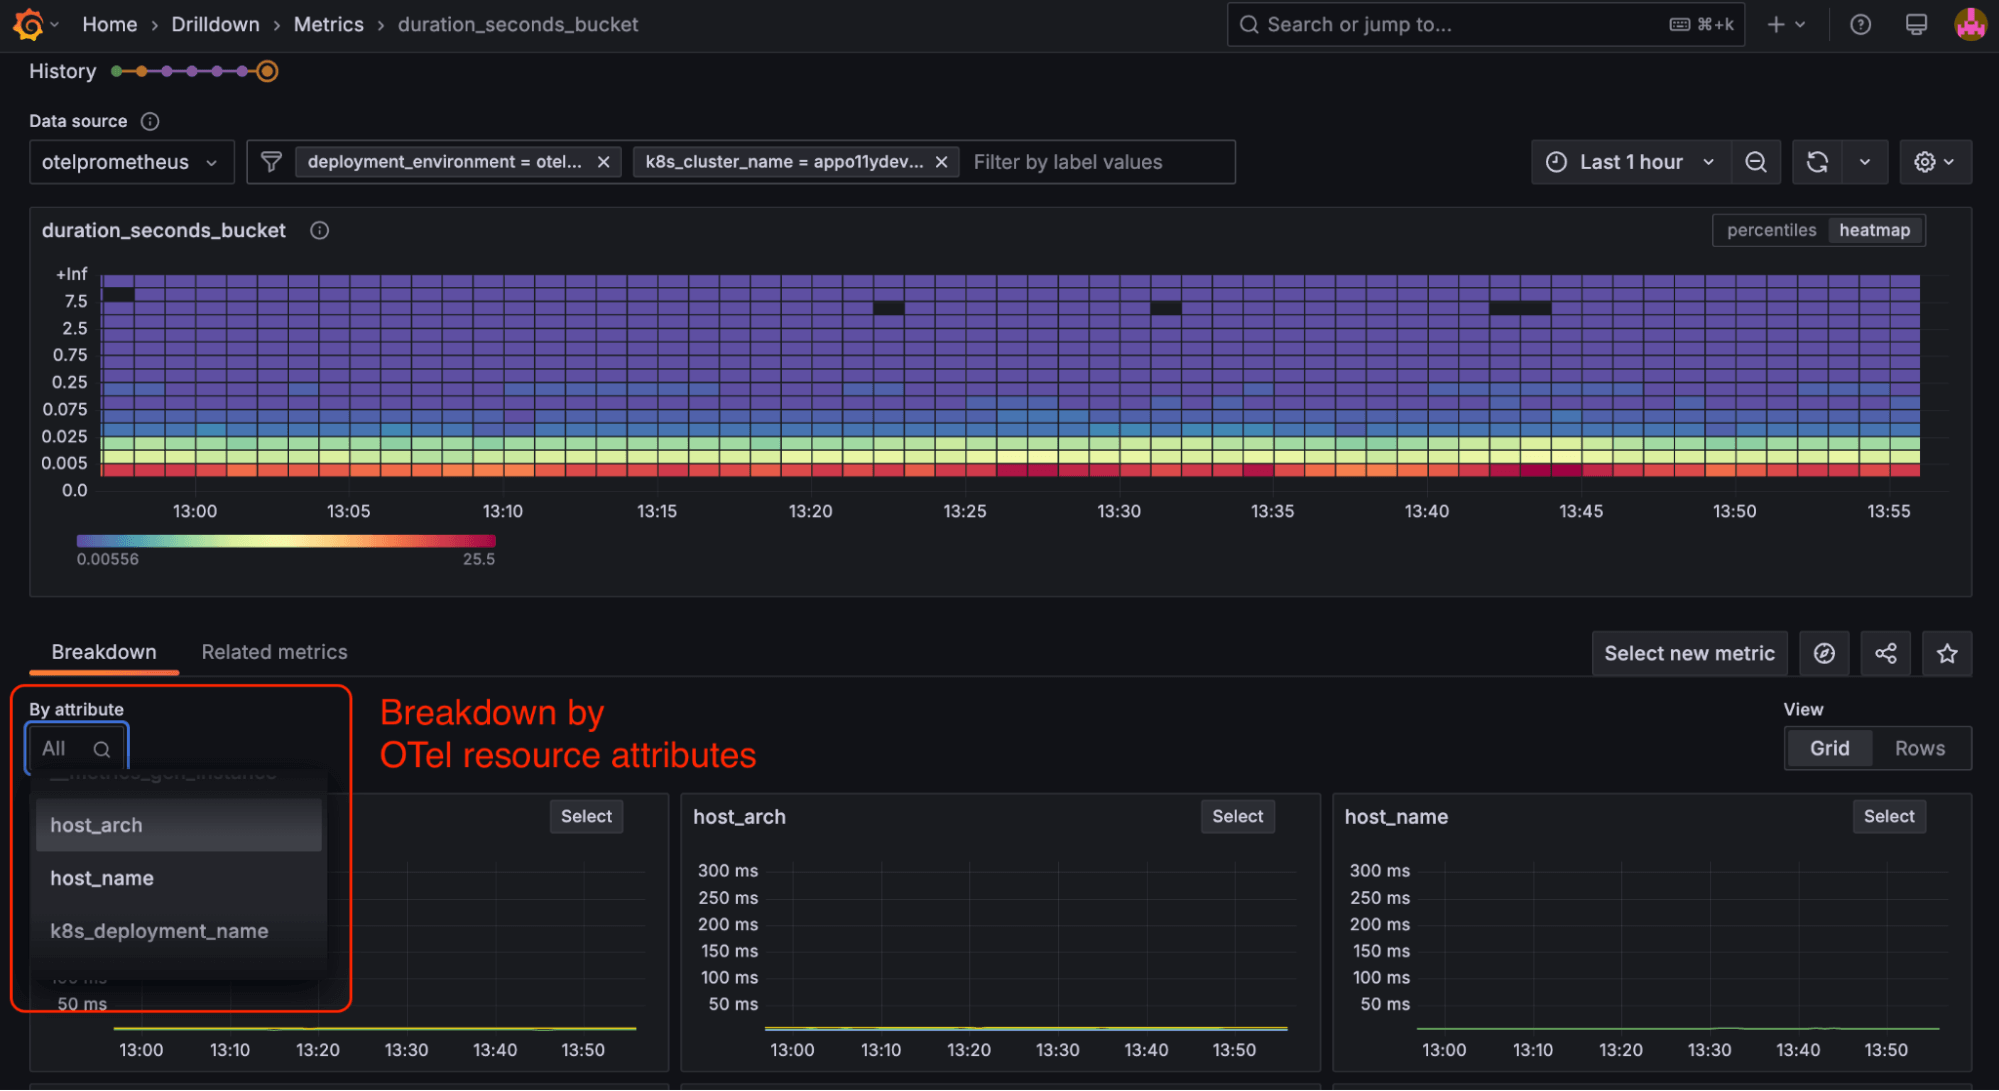
- When breaking down a metric, we may be breaking down by Prometheus label or resource attribute—both of which are done automatically.
See more information about how Open Telemetry resource attributes work in Prometheus here: Prometheus and OpenMetrics Compatibility | OpenTelemetry
Special cases to keep in mind
As you can see, we’re really excited to add this functionality to Metrics Drilldown, and we can’t wait for you to start using it. That said, it’s still early days in our development, and there are a few use cases that will present challenges for users. We’ll continue to iterate on this, but for now, here are some possible hurdles for users and how we recommend working around them.
Missing unique identifiers
What happens when a job or instance is missing? OpenTelemetry maps service.instance.id to the instance label. In Kubernetes, service.instance.id may not be defined. In this scenario, we recommend using k8s.pod.uid to define service.instance.id if it is missing.
Promoting resource attributes directly to metrics
Users may promote resource attributes directly to metrics so that joining with target_info is not required. This can create an interesting situation in Prometheus, which can accept metrics from many exporters. In Metrics Drilldown, whenever a resource attribute is present on both target_info and the metric, we give preference to the promoted label and use that to both filter and aggregate by.
Explore metrics and the metrics list
In Metrics Drilldown, we present users with a list of metrics. We offer normal label filtering to reduce this list. The method we use is to call the Prometheus label values endpoint with the chosen filters represented in the match parameter.
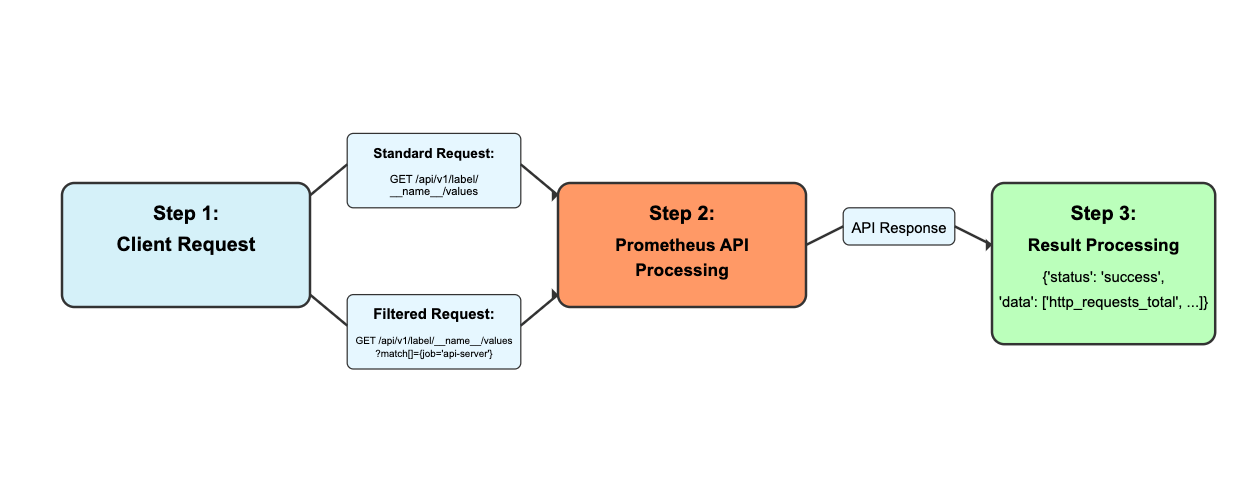
But what if we filter the list by resource attributes? If a resource attribute is not promoted to metrics, we must then use information on the target_info metric to reduce the metric list. We do this by getting all of the unique identifiers in target_info that can join metrics. This means that we build a list of job and instance label values. These job and instance values can be passed to the label values endpoint to retrieve metric names.
This presents a problem: the label values endpoint is a get request and parameters are limited to ~2048 characters. In many Prometheus instances there may be so many job and instance values that you exceed the character limit for the label values request. Exceeding the character limit results in a 414 URI Too Long error.
Our current solution is to truncate the join and instance values in the label values endpoint match parameter. We then show that the list has been reduced because of this. We suggest that users add more resource attribute filters.*
Grafana Cloud is the easiest way to get started with metrics, logs, traces, dashboards, and more. We have a generous forever-free tier and plans for every use case. Sign up for free now!


