

How LATAM Airlines uses Grafana Cloud for real-time observability that improves customers' experiences
Travel planning is never easy. There are dates to consider, prices to compare, and seats or rooms to grab before someone else reserves them. A glitchy booking website or app can make it even more complicated.
Nobody wants that, least of all the airline companies and hotels hoping to serve customers.
Five years ago, LATAM, one of the biggest airlines in South America, decided it needed a new way to prevent that type of turbulence for the 75 million+ passengers that rely on its flights every year. The company embarked on a digital transformation to improve its customers’ website experiences by adopting a customer-focused observability tool, real-time monitoring with Grafana Cloud, and SLO-driven operations.
In a recent ObservabilityCON On the Road presentation, Carlos Hernandez, LATAM’s Head of Cloud and SRE, discussed the changes that were made and why SLOs are essential to correctly define and manage reliability goals. He also shared how the changes paid off not only only for customers but also for the airlines’ developers, too.
Note: LATAM’s session from ObservabilityCON on the Road is now available to watch on demand. You can check out the full session on YouTube below.
A complex system
LATAM’s e-business group (created when the company combined its commercial business unit and part of its IT organization) began replacing the company’s digital experience around May 2020. After about five months, it rolled out its changes to its first country, Ecuador. At the time, LATAM was using Grafana OSS and a different observability provider, and the backend team was confident in its ability to track the state of their system. However, team members were still receiving messages from people they knew with complaints about the website not working or the app taking too long to load.
Those small failures were big concerns that caused frustrations for all of the internal teams as well as customers. “We realized that our ability to identify problems or issues was really bad — it wasn’t enough,” Hernandez said.
Part of the problem was that LATAM had a complex distributed system with more than 500 different services. In the map below, every colorful box represents a different service, and the purple lines represent different interactions.
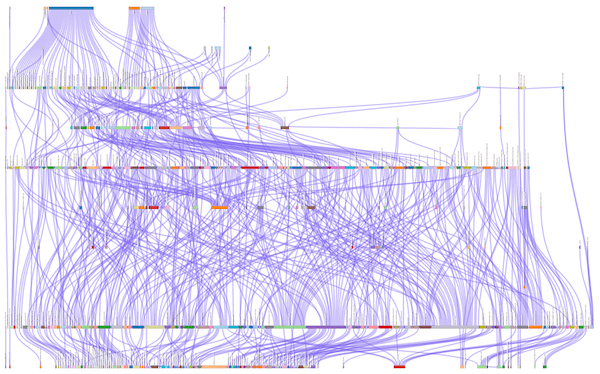
On average, every time someone would click a button in the UI or follow a link, about 40 different services were also called. “We needed a way to map the different interactions on the UI on the frontend to the service that was causing the error,” Hernandez said.
A helpful tool, but not enough
LATAM introduced Failed Customer Interaction (FCI), a concept that worked for PayPal in 2018 when it had a similar issue.
On LATAM’s home page, there is a search box with options to select a given region, destination, travel date, and number of passengers, plus a search button. The team mapped customer interactions by assigning every button or link a defined action name, such as flightselection.offers-search or itinerary.itinerary-search.
After all of the data is ingested, this is what the FCI tool might look like on a given day:
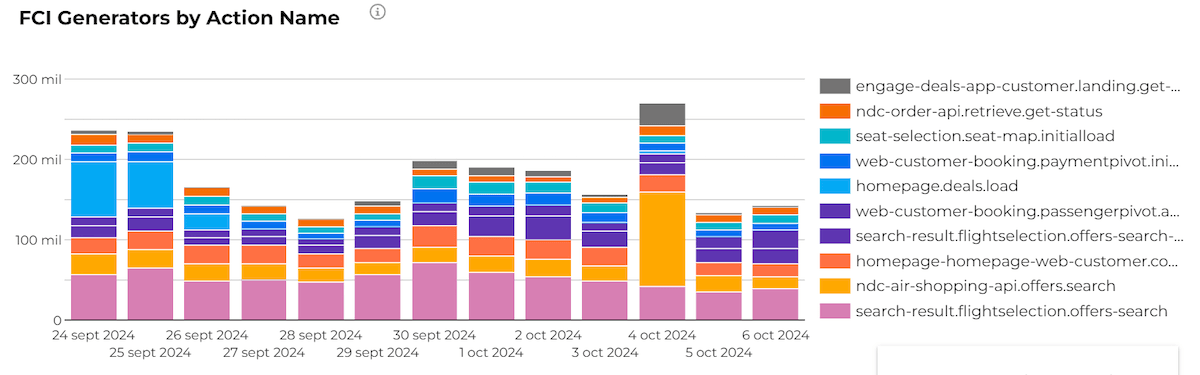
On the right are all the different services that were generating failures and affecting a given action (like a link or button). The bars on the left represent how many of the failures were introduced for a given service.
This allowed leaders and developers to use exactly the same language when discussing an issue they wanted to prioritize. “It was a huge change in the daily interactions and conversations within the team dynamics,” Hernandez said.
But there was a downside: That data was hours old. If someone wanted to push a change code into production, it would take hours for the dashboard to indicate if the change worked.
“We needed something that could allow teams to operate using this concept of FCI, but in real time,” he said.
Grafana Cloud to the real-time rescue
What LATAM needed was to take the idea of the FCI but make it based on metric collection to allow for faster anomaly detection. “All the data, in this case, was generated by the different services,” Hernandez explained, “and all the different services were sending data of the failed customer interactions that were having on that particular artifact of service.”
By moving to Grafana Cloud, teams had better and more helpful visualizations of what was going on.
For example, in the panel below, a user can select the environment, time span, and the action to observe. The green bars represent successful requests, the red ones represent the failures, and the red line represents the ratio between the two.
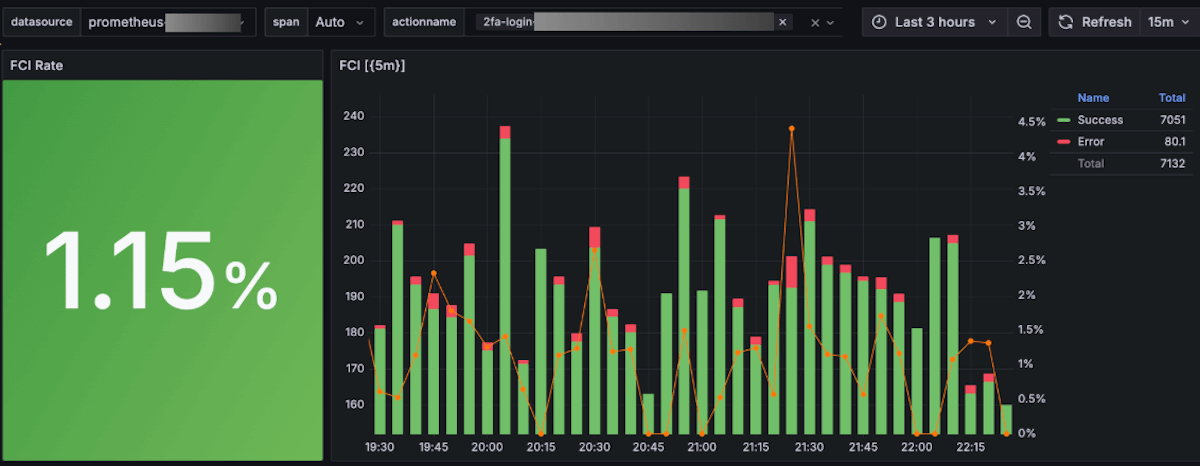
If someone deploys a change to the two-factor authentication service login, for example, they would quickly know if that change resulted in a failure. “If you see a huge red bar, you can react immediately and roll that change back,” Hernandez said.
Still, those initial efforts weren’t delivering enough information. The teams didn’t know what size red bar was OK and what was one that needed immediate attention.
“The next level for us was to actually introduce the SLO as an essential way to manage the reliability of the different services.”
Below is a portion of their Grafana SLO dashboard, which LATAM now has for many of its different services. This panel contains the name of a link from LATAM’s website — in this case, search-result.itinerary.itinerary-search-availability — and there is one for all of the interactions on the site.
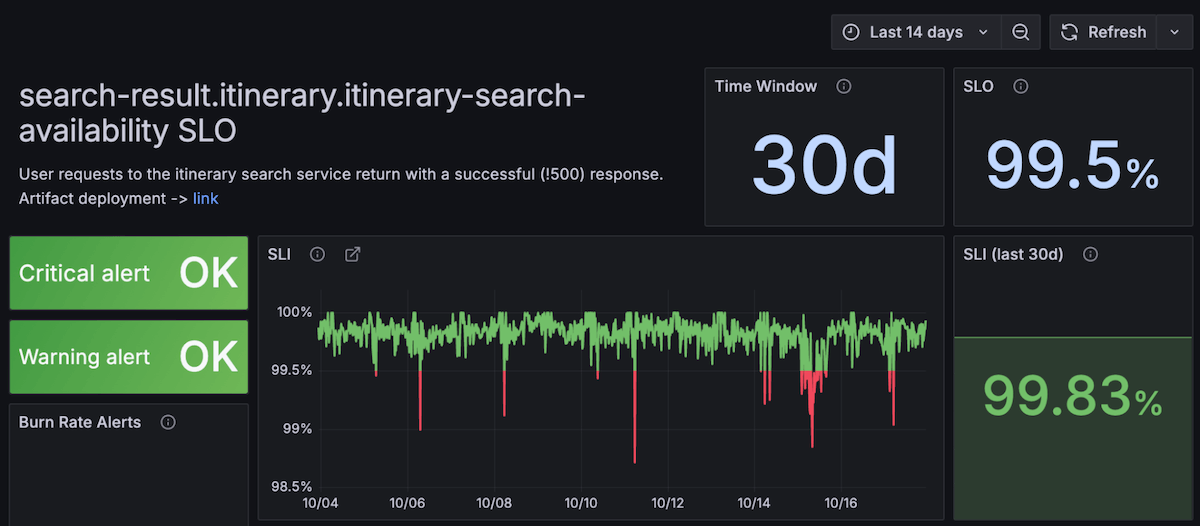
It displays the time window of the SLO, the target, and the data for the request successes and failures. The left side displays if there was any critical or warning alert.
A soaring success
By using real-time observability and Grafana SLO, Hernandez said LATAM’s team has been rewarded with two significant benefits:
Improved time to detect
For severity 1 and 2 incidents, the time it takes between an incident affecting customers and team members detecting that failure was reduced by more than 80% over about three years across all squads in the e-business organization, Hernandez said. “From an operational perspective, this is one of the most relevant changes that we have seen.”
Less noisy alerts
No one wants to be paged unnecessarily at 3 a.m., and this is helping with that. “After teams adopted this new wave of operating the different services that result in an alert system based on our budget, we have seen more than 60% reduction in noisy alerts,” he said.
He also stressed that building and offering an SLO capability to help a team better operate their services is great, but they need to be able to do more than, say, click on a UI. “You have to think about how to simplify the process, not just provide capabilities. You also have to provide an easy way to get them to use them.”
The key is to connect the ecosystem of tools and practices and processes, he said.
Now, when a developer has access to that in their environment, they can push a change to their repo, Hernandez explained, and from there, “the CI/CD tools and processes take that data. Depending on the changes that the CI/CD process sees on your repo, we can interact with the Grafana API, and we make all the different changes as we need to Grafana IRM and Grafana SLO. All of this is fully automated and connected.”
He said the same idea applies when someone is deploying a change in an application. “The application has a library built in that helps the teams to gather all the different telemetry that they need, and this data is also pulled by the Grafana Stack.”
Moving forward with observability
Even though LATAM has made major improvements in its time to detect an incident, Hernandez said its time to repair can still get better. “We have seen a 23% reduction, and it’s OK, but for us it is not enough. We believe that we can reduce this another 50% further.”
He said that one way the company plans to make more changes is by simplifying how teams can correlate data across metrics, logs, and traces. LATAM also plans to streamline developers’ workflows, making it easier to visually move from metrics to logs to traces and connect that data visually as well.
The most important focus will be on observability-driven development, and thinking about how to observe applications, services, and customers before or at the moment when applications start being designed, built, tested, and deployed.
Hernandez said that the biggest lesson from LATAM’s experience is that true observability must start with the customers. “As soon as you focus on your customers, the rest of the tools, practices, and technical style you may need will follow.”
Grafana Cloud is the easiest way to get started with metrics, logs, traces, dashboards, and more. We have a generous forever-free tier and plans for every use case. Sign up for free now!


