

Visualize Google Sheets data: how to turn your spreadsheets into Grafana dashboards
In 2020, we launched the Google Sheets data source for Grafana, providing organizations with real-time data visualization capabilities for all their go-to spreadsheets.
Since then, thousands of users have installed the data source to quickly and easily derive insights from their spreadsheet data. In this blog post, we’ll explore key features of the Google Sheets data source, as well as some helpful resources to install and start using the data source today.
Why visualize Google Sheets in Grafana
Google Sheets is a widely used spreadsheet application that allows you to store and manage data for pretty much any use case, whether it’s a sales forecast, organizational KPIs, or scientific research.
However, quickly deriving insights from a spreadsheet, especially those with a lot of data, isn’t always easy. Spreadsheet functions can help with analysis, but are somewhat complex to learn. This is where the Google Sheets data source for Grafana comes in, allowing you to display and visualize your spreadsheet data in beautiful dashboards — no learning curve required.
The data source plugin is maintained by Grafana Labs and is available in Grafana Cloud (including in our generous forever-free tier), Grafana Enterprise, and Grafana OSS.
Key features
The Google Sheets data source provides a range of features to help you quickly and easily visualize your spreadsheet activity, such as:
- User-friendly query editor
- Visualizing time series and statistical data
- Multiple authentication methods
- Caching
- Provisioning
Let’s take a closer look.
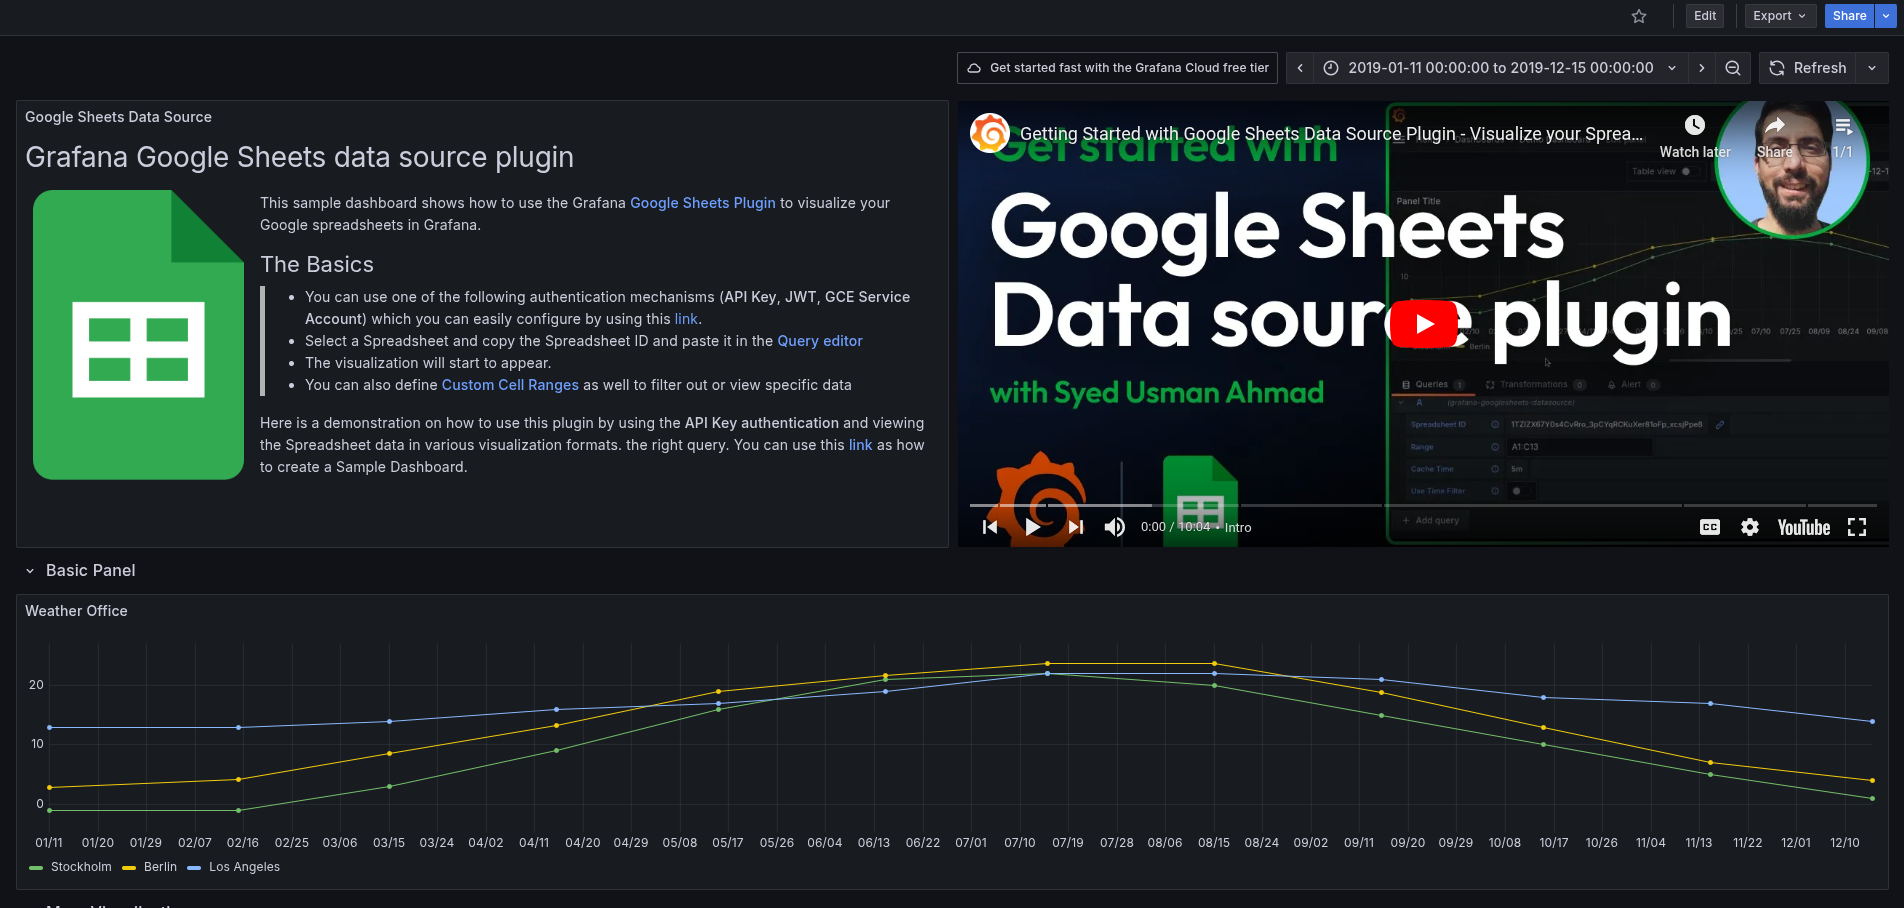
User-friendly query editor
The query editor for the data source is designed to be easy-to-use, as you only need to provide the link to your spreadsheet ID (or URL). From there, it will automatically extract the data and display it in a Grafana dashboard or Explore.

Additionally, you can visualize a specific range of cells within your spreadsheets by simply providing the cell range.

To find out more about the query editor, please refer to our technical docs.
Visualizing time series and statistical data
The Google Sheet data source lets you visualize time series data if there is a time series column present in the spreadsheet. To view, select the time series panel. Additionally, you can use Grafana’s built-in time picker feature, which provides filtering capabilities when analyzing complex time series data.
The data source does support other data formats beyond time series. You can use various Grafana visualization panels to display this data, such as bar chart, gauge, or state timeline.

Multiple authentication methods
The Google Sheets data source for Grafana supports the following three authentication methods:
- An API key
- A service account JSON Web Token (JWT)
- The default Google Compute Engine (GCE) service account
The API key authentication is the right choice to get started if your spreadsheet data needs to be publicly shared. However, if your data is confidential, then we recommend service account JWT authentication.

Similarly, if you are running Grafana on GCE and need to visualize spreadsheet data securely, you can use the GCE service account authentication method.
To learn more about the authentication process, please check out these docs.
Caching
Caching is enabled by default, which improves performance when querying data from the server and is very beneficial when working with large spreadsheets. The default cache time is five minutes. You can also bypass the cache completely by setting the time to 0s.

Note: Using caching helps prevent unnecessary reloads when the data has not changed its state and is beneficial because Google imposes limits on the Google Sheets API.
Provisioning
Provisioning can also be done based on the authentication methods you want to deploy in your environment by a configurable YAML file. This helps you to deploy the data source at scale, as well as simplify management via pre-defined configuration parameters.
Here is an example of provisioning the Google Sheets data source using the API authentication method.
apiVersion: 1
datasources:
  - name: '<DATA SOURCE NAME>'
    type: grafana-googlesheets-datasource
    enabled: true
    jsonData:
      authenticationType: 'key'
    secureJsonData:
      apiKey: '<API KEY>'
    version: 1
    editable: true
You can learn more about provisioning in our technical docs.
Get started with the Google Sheets data source plugin
We offer detailed, step-by-step documentation on how to install and configure the Google Sheets data source. In addition, you can find live, real-time examples of dashboards on the Grafana Play platform that help showcase the usage of the plugin.
Want to get involved?
We’d love your feedback on the Google Sheets data source for Grafana, and how we might improve it moving forward. Please try it out, let us know what you think on GitHub or our Community Forums, and also consider contributing!


