

How to monitor your Shopify store with Grafana Cloud Frontend Observability
Shopify is a fantastic tool for organizations who want to sell products, but don’t want to build or maintain an e-commerce platform themselves. Even some of the largest brands that have built their own e-commerce platforms in the past have seen the value of using Shopify to accelerate their business.
As your Shopify site scales and grows, however, you may need more insight into the performance of your store. You may also want the ability to correlate website performance with Shopify business data and other analytics systems in a single place.
In this post, I’ll explain how to do just that with Grafana Cloud Frontend Observability, our hosted service for real user monitoring (RUM) that provides immediate and actionable insights into the end user experience of web applications. Frontend Observability is powered by Grafana Faro, an open source Web SDK to instrument JavaScript-based browser applications.
We’ll walk through how to use Frontend Observability to get end user insights from Shopify (or any templated SaaS website builder, for that matter) and correlate this page performance data with some business metrics from the Shopify API.
Instrument the Grafana Faro SDK into our Shopify theme
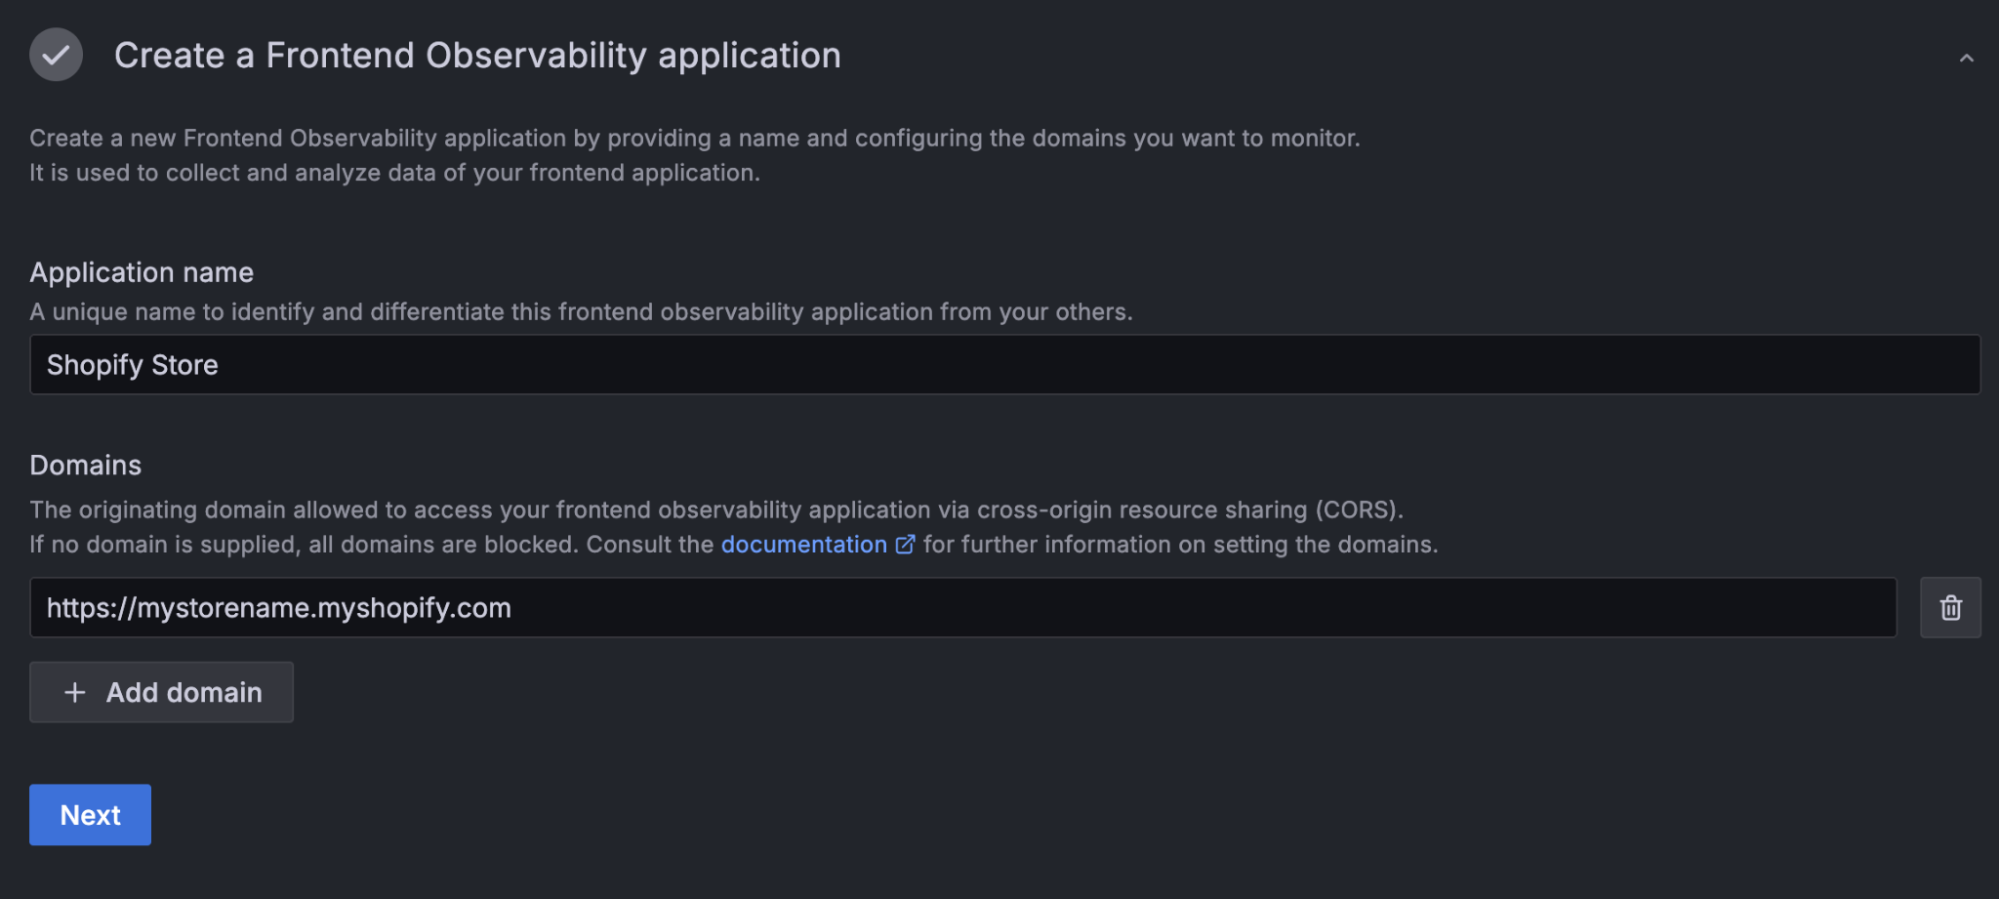
To get started, we need to follow these steps to create a Frontend Observability application. First, specify an application name, as well as the domain for your Shopify website. Then, click Next.
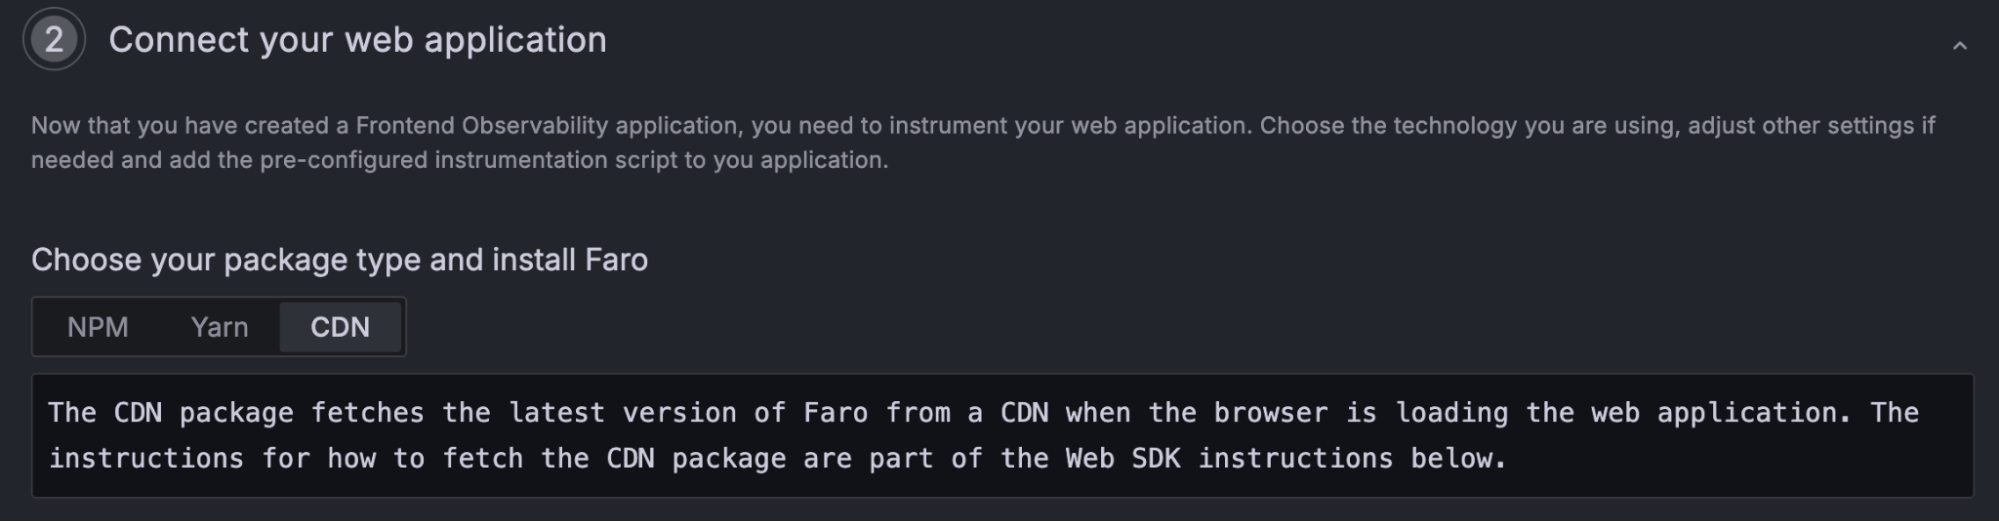
Let’s select the CDN option for our package type, since, in this example, we won’t be able to use a package manager to add the Faro SDK to a pre-built Shopify theme.
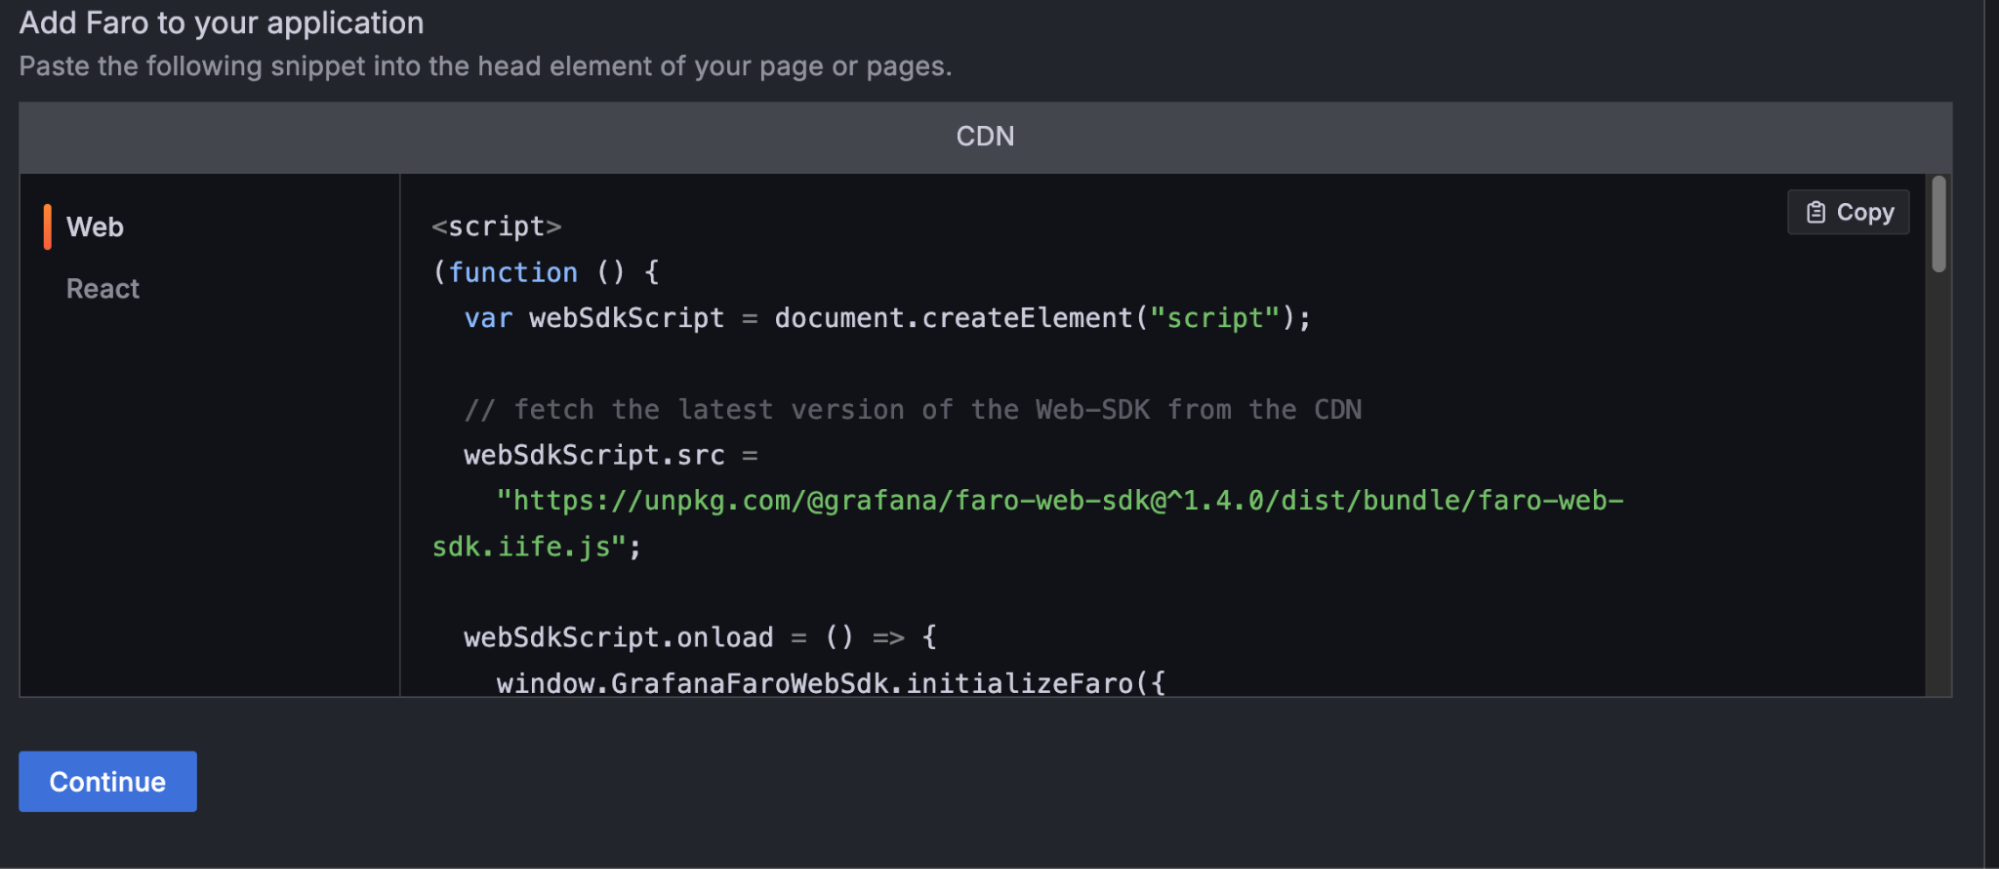
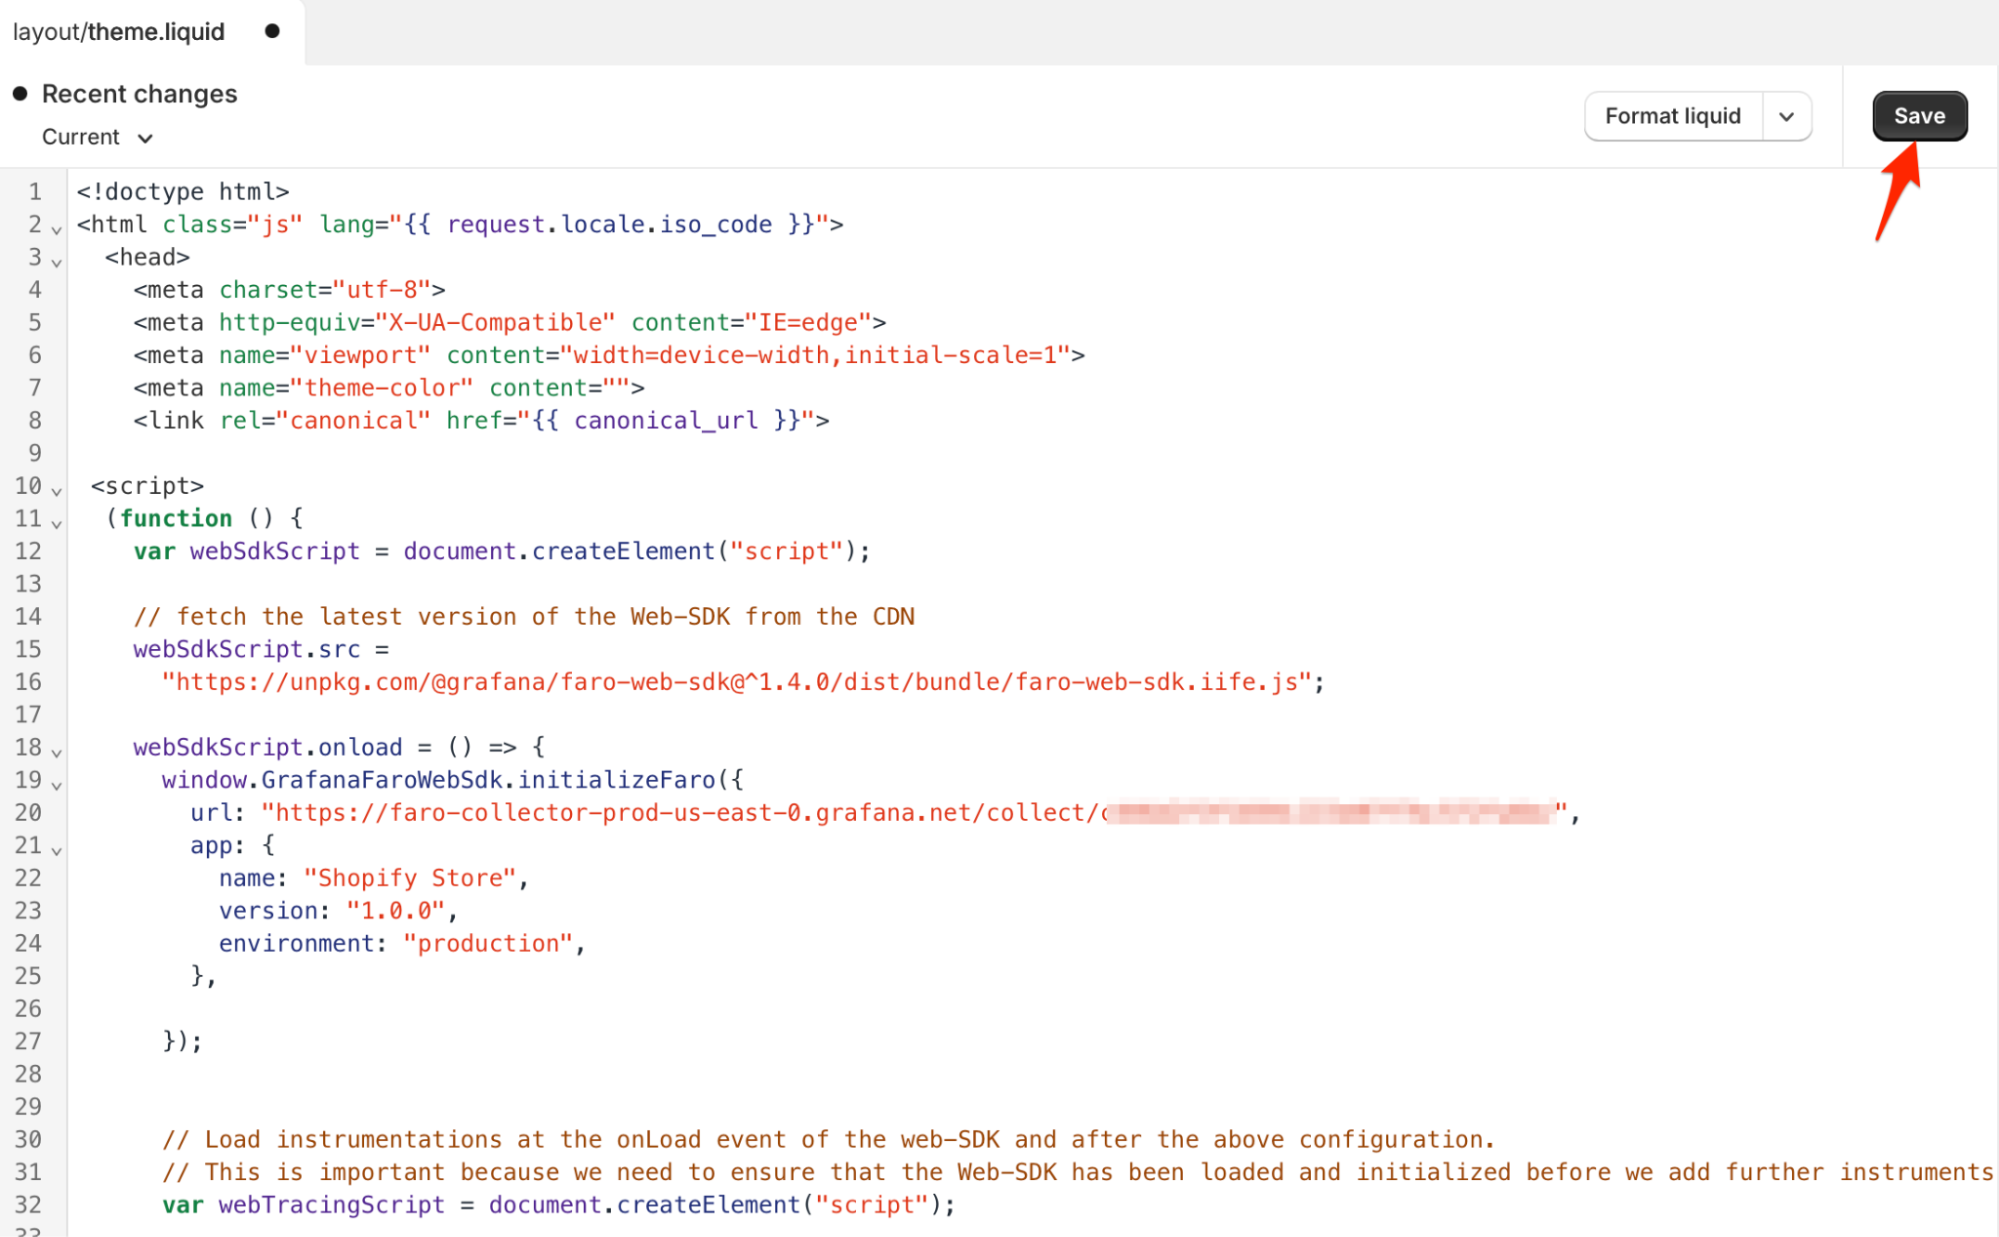
Next, we want to copy the pre-configured snippet from the Faro Web SDK configuration to put into our Shopify theme. Shopify’s templating language is called Liquid, so updating the Shopify theme is done by modifying “.liquid” files.
Click Continue, and then Complete to finish creating the web application.
Great! Now we just need to put this snippet into our Shopify theme.
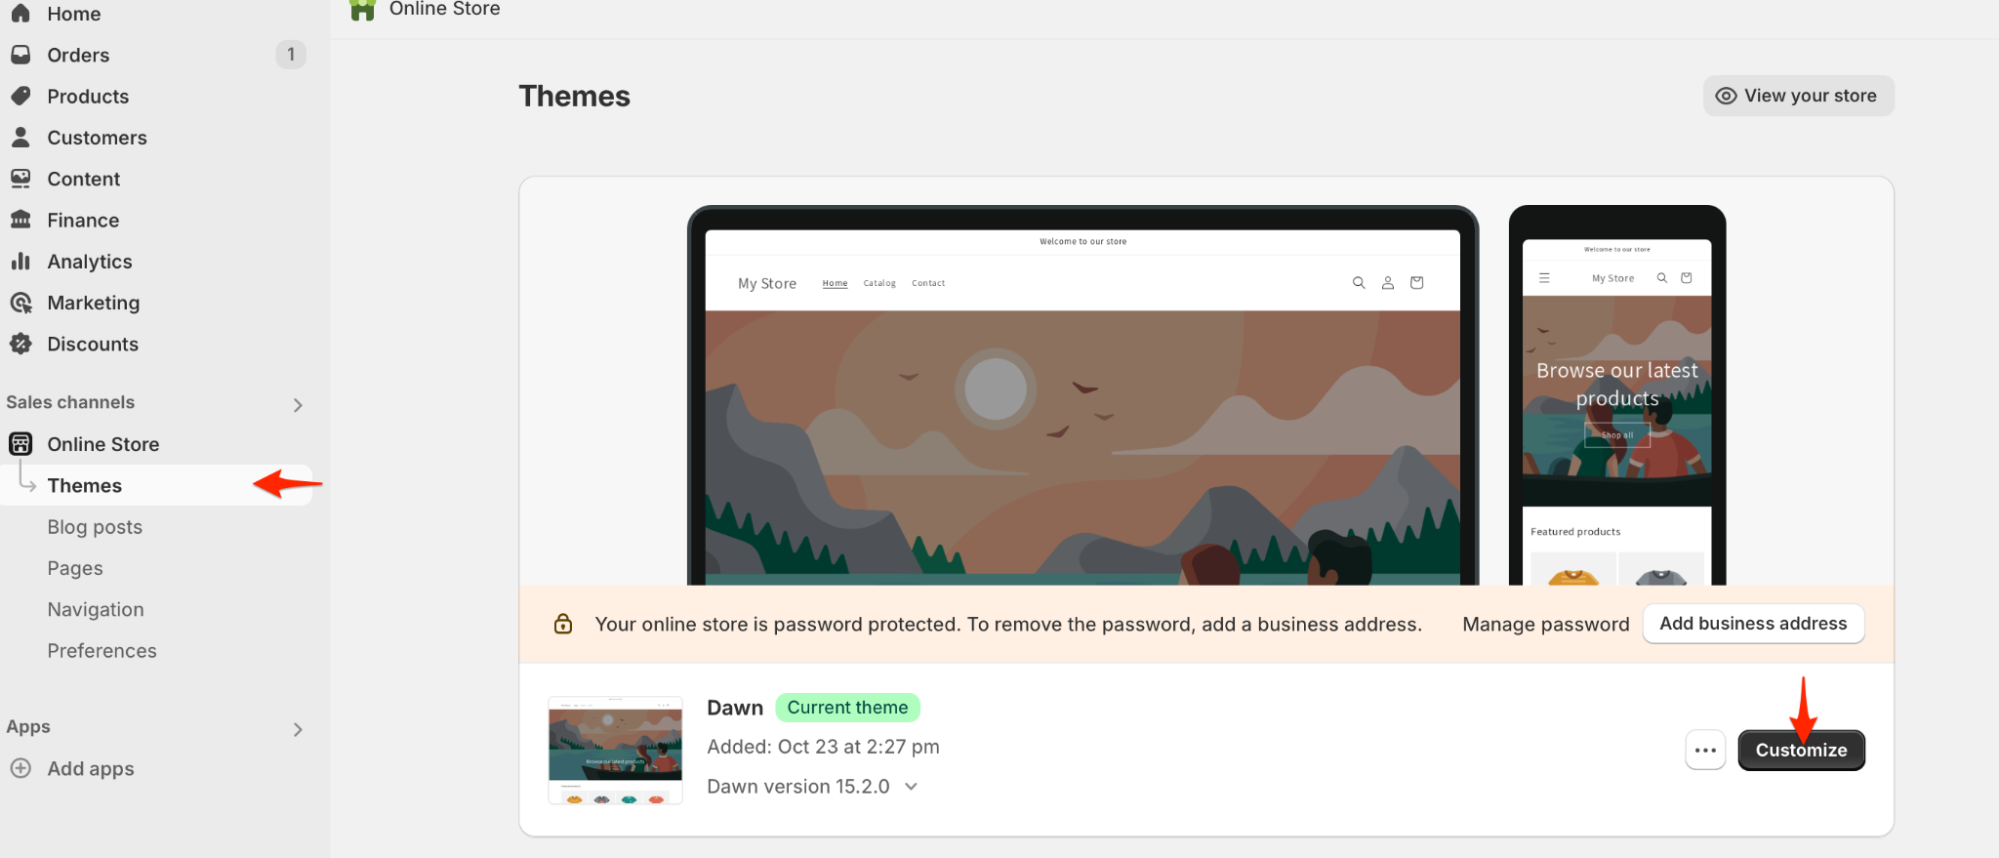
From your Shopify Admin page, navigate to the Sales channel and click Themes. Then, select Customize on the current theme.
Select Edit code from the dropdown menu at the top.

This part may vary depending on the theme you use, but generally, the next step is to place the JavaScript snippet we copied earlier into the <head> HTML element in theme.liquid.
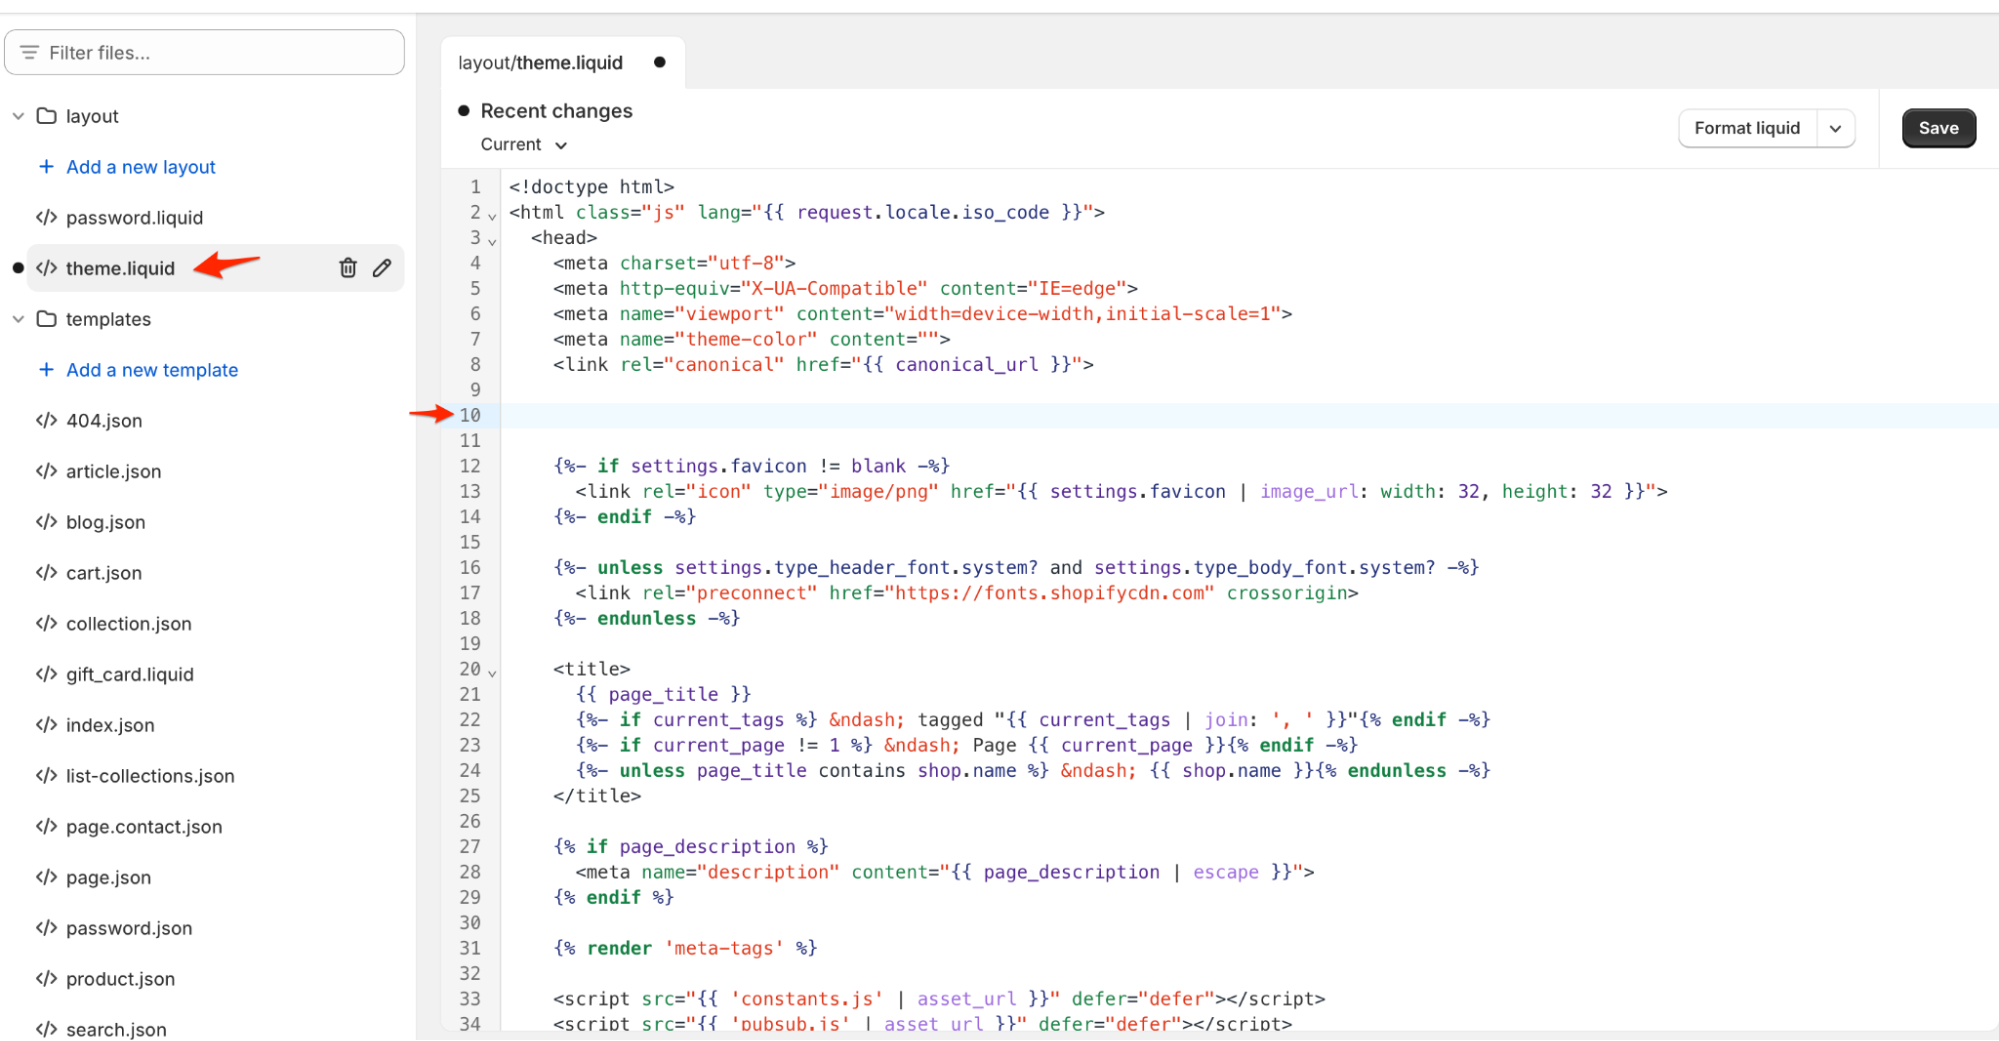
In this example, I placed mine onto line 10, and then hit Save.
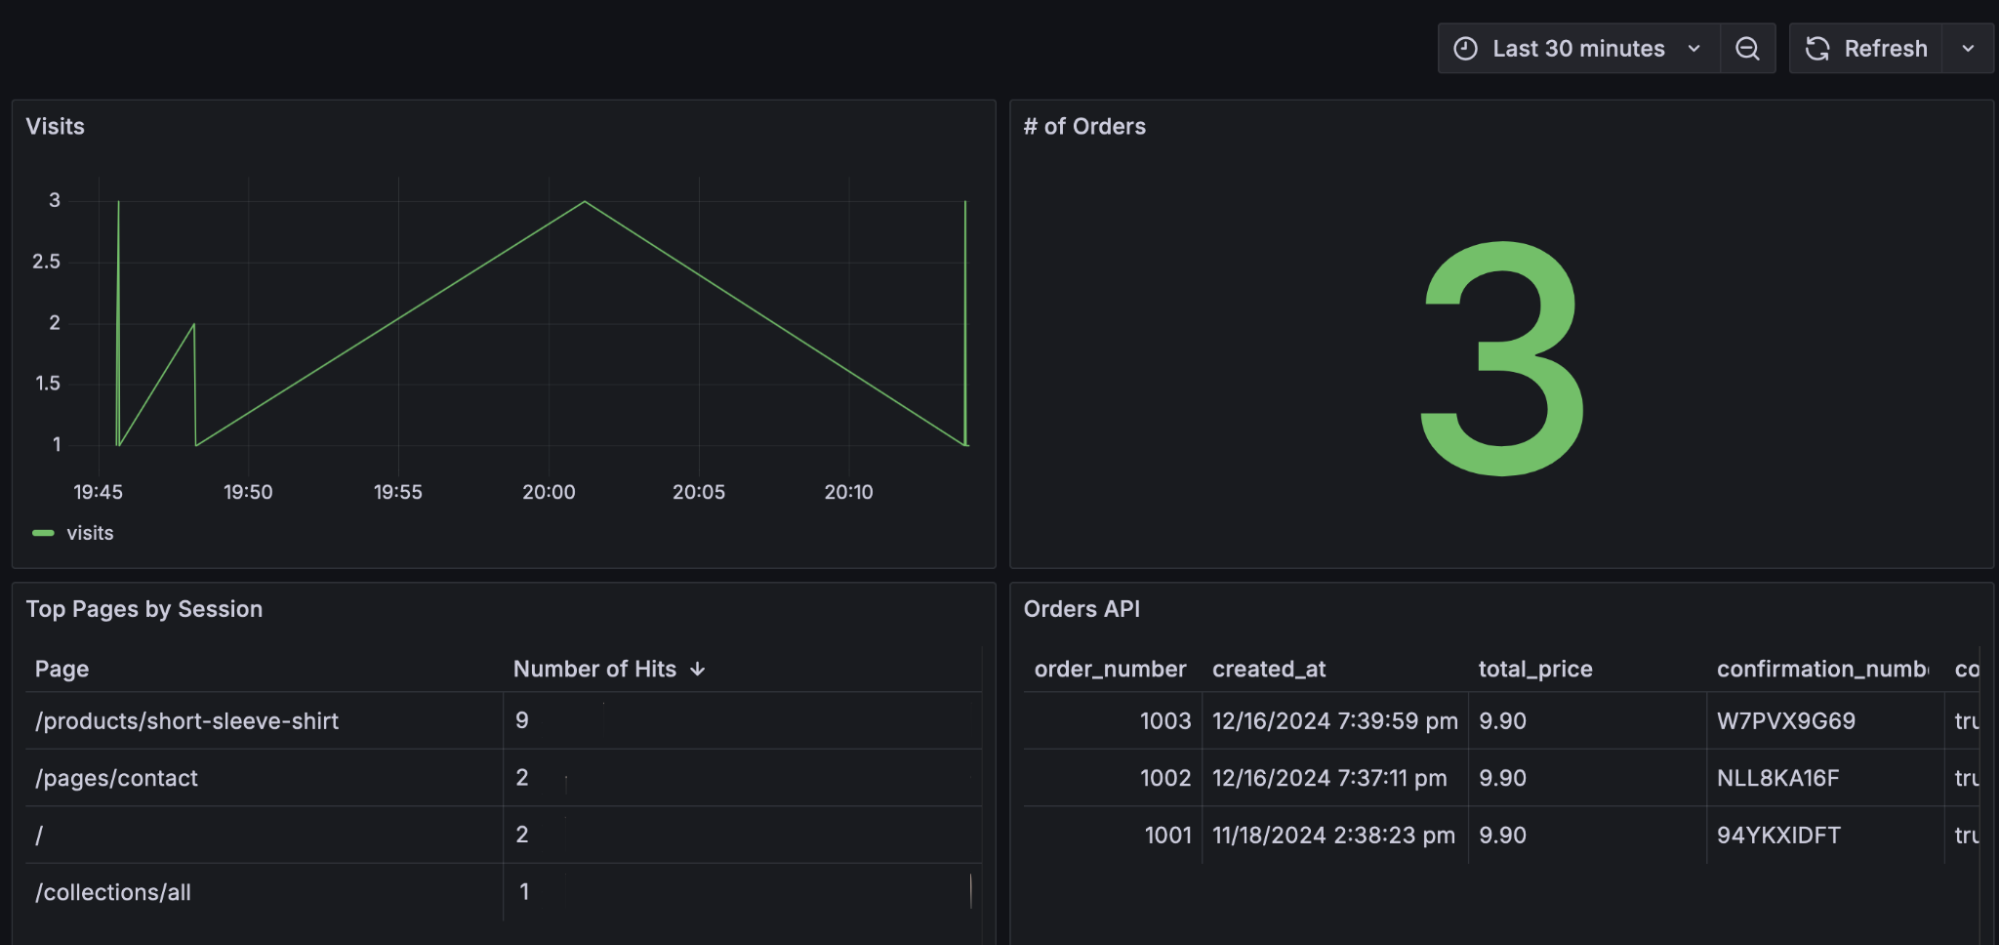
And that’s it! After you save your changes, you can go to Grafana Cloud Frontend Observability to preview your Shopify store and start monitoring traffic. We can see pageviews, web vitals, and session information from our online store coming into Frontend Observability.

Correlate performance data with Shopify business metrics
Now that we have some information on the performance of our website, how does that data relate to how our sales are doing? Or to that recent marketing campaign we ran?
We could instrument the Faro SDK to send custom business metrics, but in this post, we’ll explore how to use Shopify to collect much of this information for us. In particular, we’ll use the Shopify Admin API and the Infinity data source for Grafana — which allows you to seamlessly query and visualize data from JSON, CSV, XML, and GraphQL endpoints — to retrieve and display this information.
First, pick the Shopify metrics you often find yourself referring to or cross-referencing with any other tools or systems — for example, number of orders, total sales, or campaign performance. These are the ones you want to prioritize on your custom dashboard, saving yourself from having to jump between tools and tabs.
We can put each Admin API query into a panel with the Infinity data source, right beside some performance metric queries we use in Frontend Observability. For a deep-dive example and walkthrough of how to visualize Shopify data with Infinity, please check out this GitHub repo.
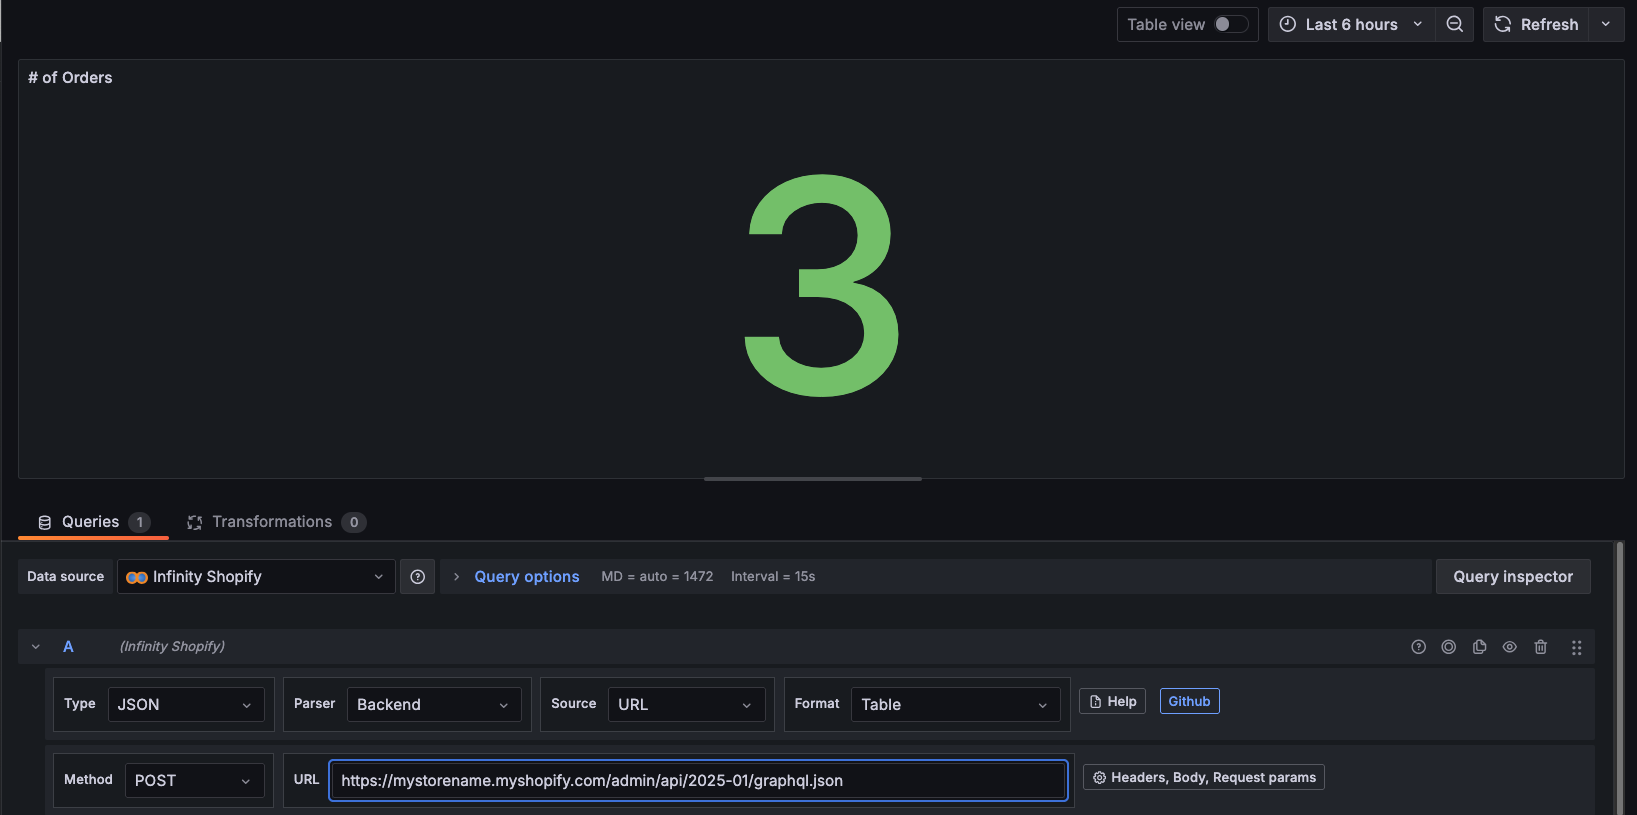
Once we’ve added a few panels, we can see some page performance data side-by-side with other data, such as order counts, coming through.
And that’s it! To learn more about Grafana Cloud Frontend Observability, and how you can use it to optimize your website and application performance, please check out our technical docs.
Grafana Cloud is the easiest way to get started with frontend observability. We have a generous forever-free tier that includes 50,000 user sessions per month and more. Sign up for free now!

