

Grafana Drilldown apps: the improved queryless experience formerly known as the Explore apps
When we introduced the Explore apps suite for metrics, logs, traces, and profiles last year at ObservabilityCON 2024, our goal was simple: offer a queryless, point-and-click experience so you can quickly find insights in your observability data—no queries or complicated syntax required.
Our commitment to that goal remains unchanged, but we’re excited to announce that the Explore apps have a new name: Grafana Drilldown. Let’s look at why we made the switch and recap some of the improvements we’ve made to the Drilldown apps since we launched the full suite last September.
Why Drilldown?
“Explore” is a familiar term in Grafana that predates the Explore apps. To many users, it represents the powerful query interface they rely on every day, so labeling our intuitive, point-and-click suite the Explore apps caused some confusion with users who thought they still needed to write queries or wrestle with code-like syntax.
Moreover, Explore adheres to our big tent philosophy, supporting hundreds of different data sources, while Drilldown is designed to work exclusively with our own OSS backends—Grafana Mimir, Grafana Loki, Grafana Tempo, and Grafana Pyroscope.
By switching to Drilldown, we’re eliminating that confusion and putting the emphasis on how these apps let you drill down into your data effortlessly. This also reflects our mission to empower everyone—whether you’re new to observability or a seasoned SRE—to quickly find answers with guided navigation.
The new name will be reflected in the Grafana Cloud UI as soon as today, and it will be part of the Grafana 11.6 release in March.
(And don’t worry about Explore. Grafana’s classic query editor isn’t going anywhere, and it will retain its name.)
What’s new in Metrics Drilldown
Now that we’ve got the new naming conventions out of the way, let’s look at the changes that matter most to you: the latest Drilldown features that help you get insights from your data faster. And let’s begin with the app that got this all started, Metrics Drilldown.
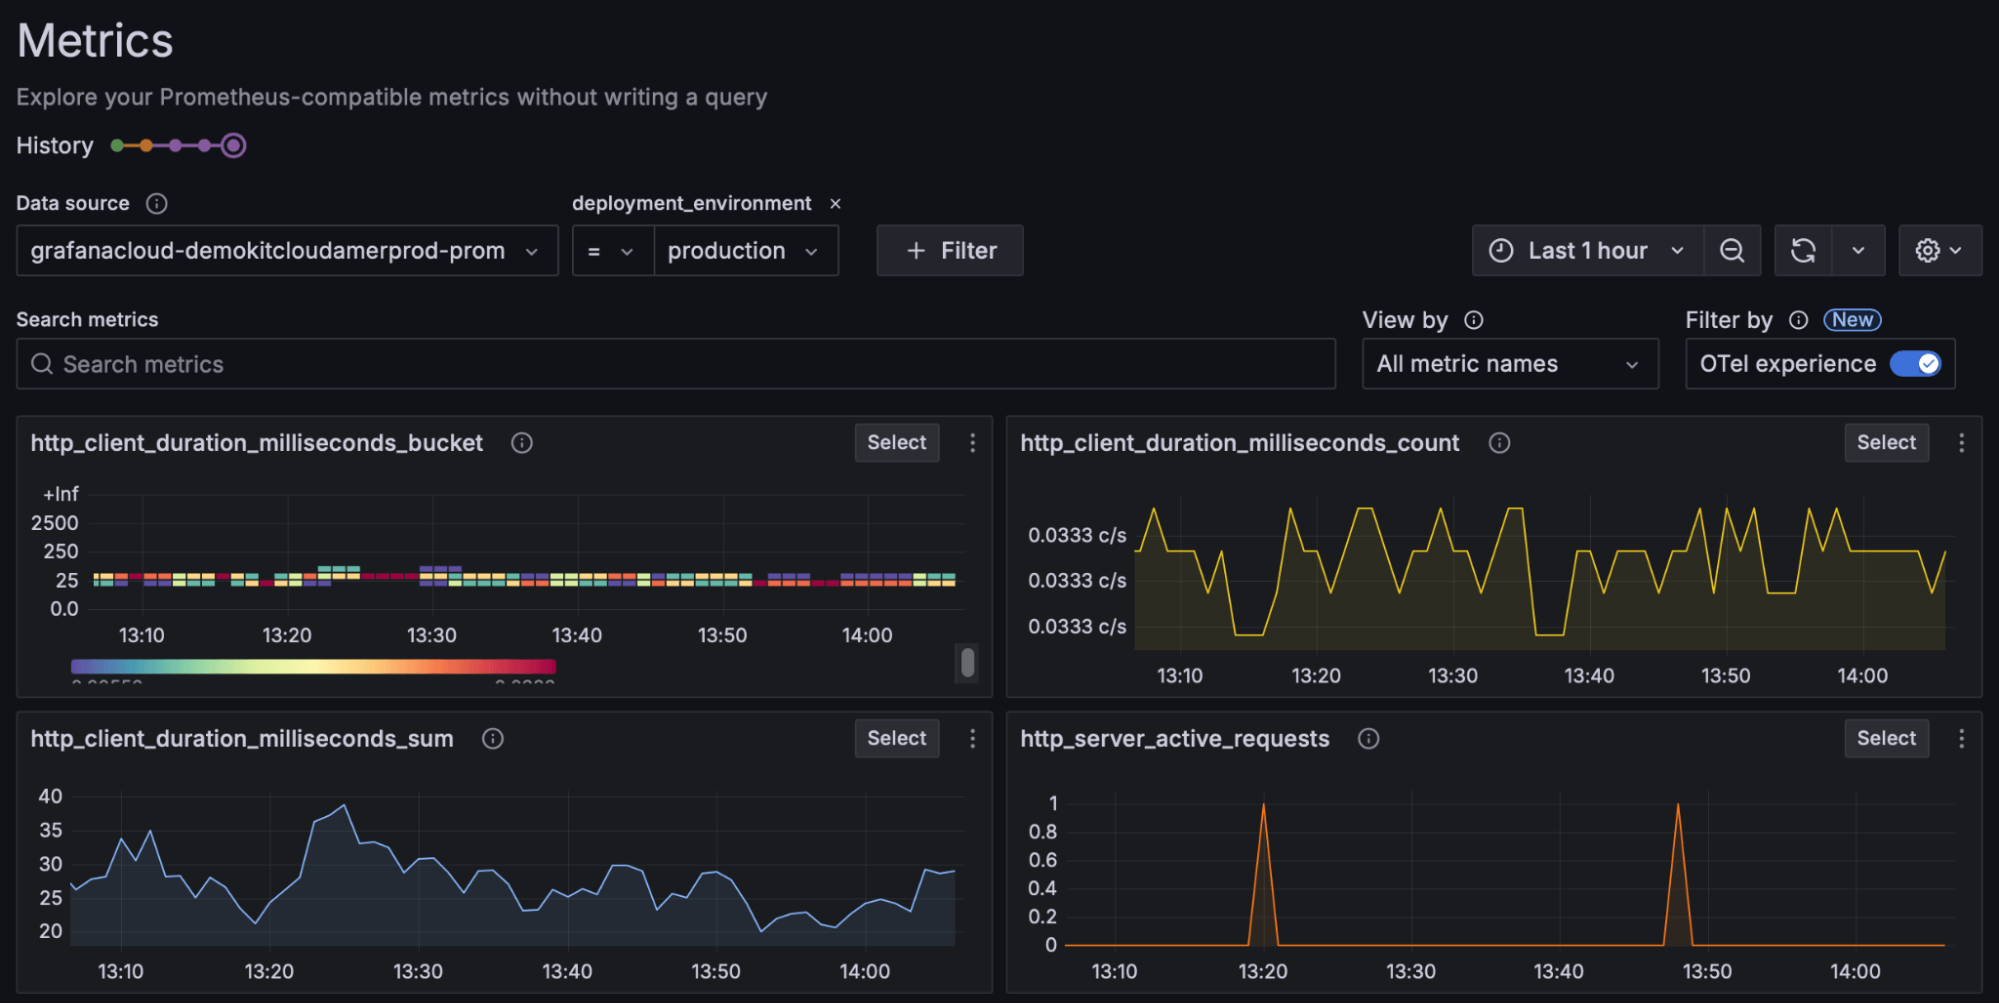
OpenTelemetry filtering support
Prometheus has long supported the OpenTelemetry protocol (OTLP), but querying non-promoted resource attributes can still be cumbersome. Metrics Drilldown’s OTel experience mode now automates these behind-the-scenes label joins, freeing you from complex manual queries so you can stay focused on the insights.
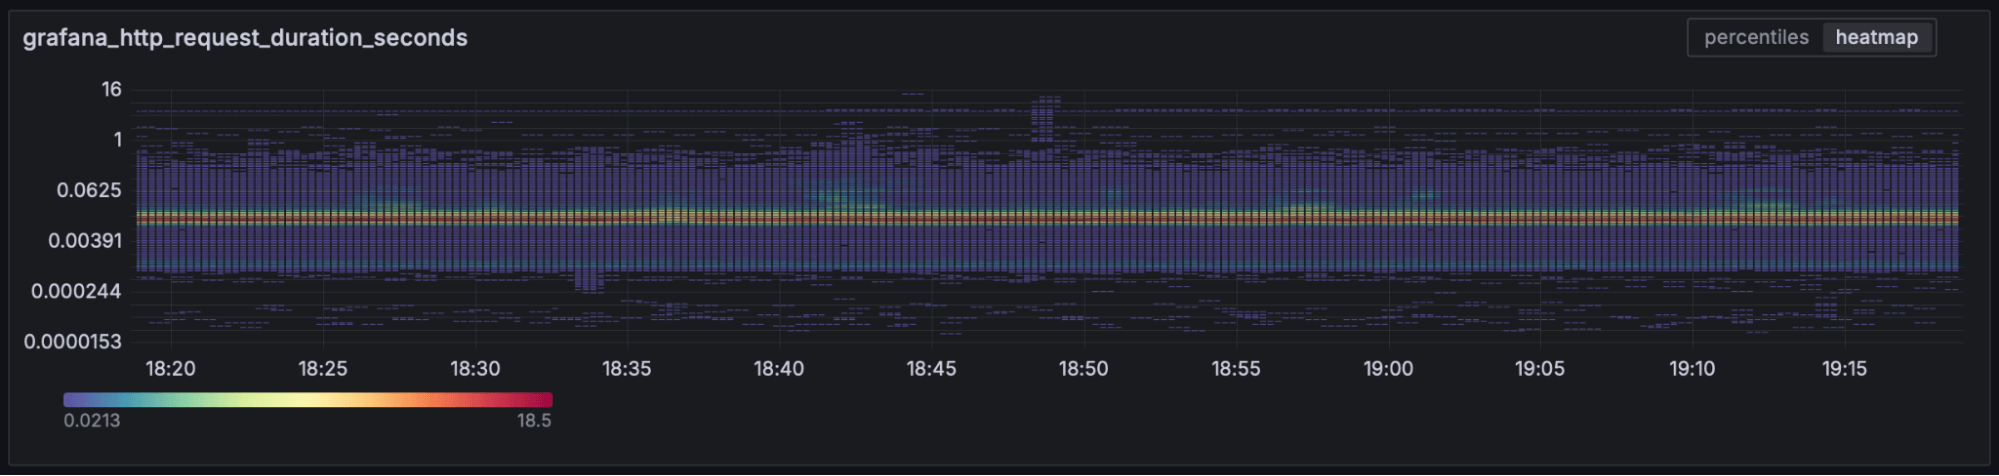
Native histograms
We’ve added support for native histograms in Metrics Drilldown, increasing the resolution of compatible histograms. This new capability delivers richer detail in your metric visualization, helping you pinpoint performance hotspots more accurately.
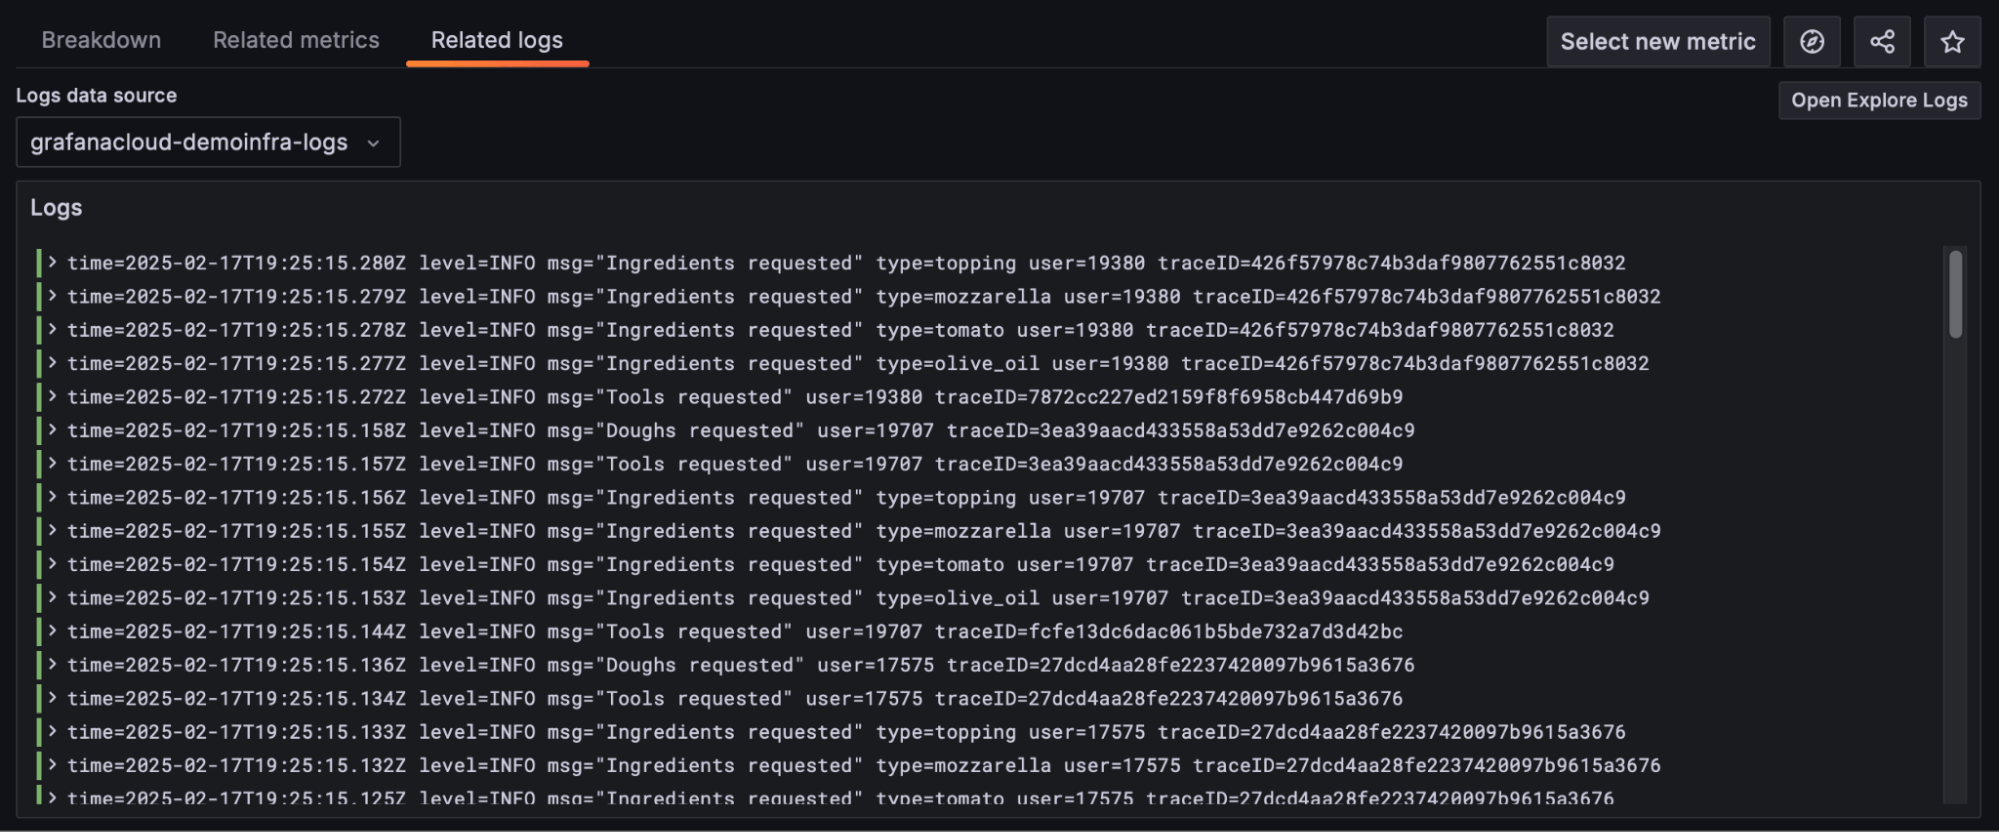
Metrics to logs
Ever notice a spike in a metric and wonder which log lines might explain it? Now you can seamlessly pivot from Metrics Drilldown to the relevant logs—no more juggling timestamps or labels in separate interfaces. Find the root cause faster by correlating metrics and logs in just a few clicks.
This feature is currently behind an experimental feature toggle. If you are a Grafana Cloud customer, submit a support request to enable this functionality today. To enable it in OSS Grafana, add exploreMetricsRelatedLogs to the list of enabled feature toggles in your Grafana configuration file.
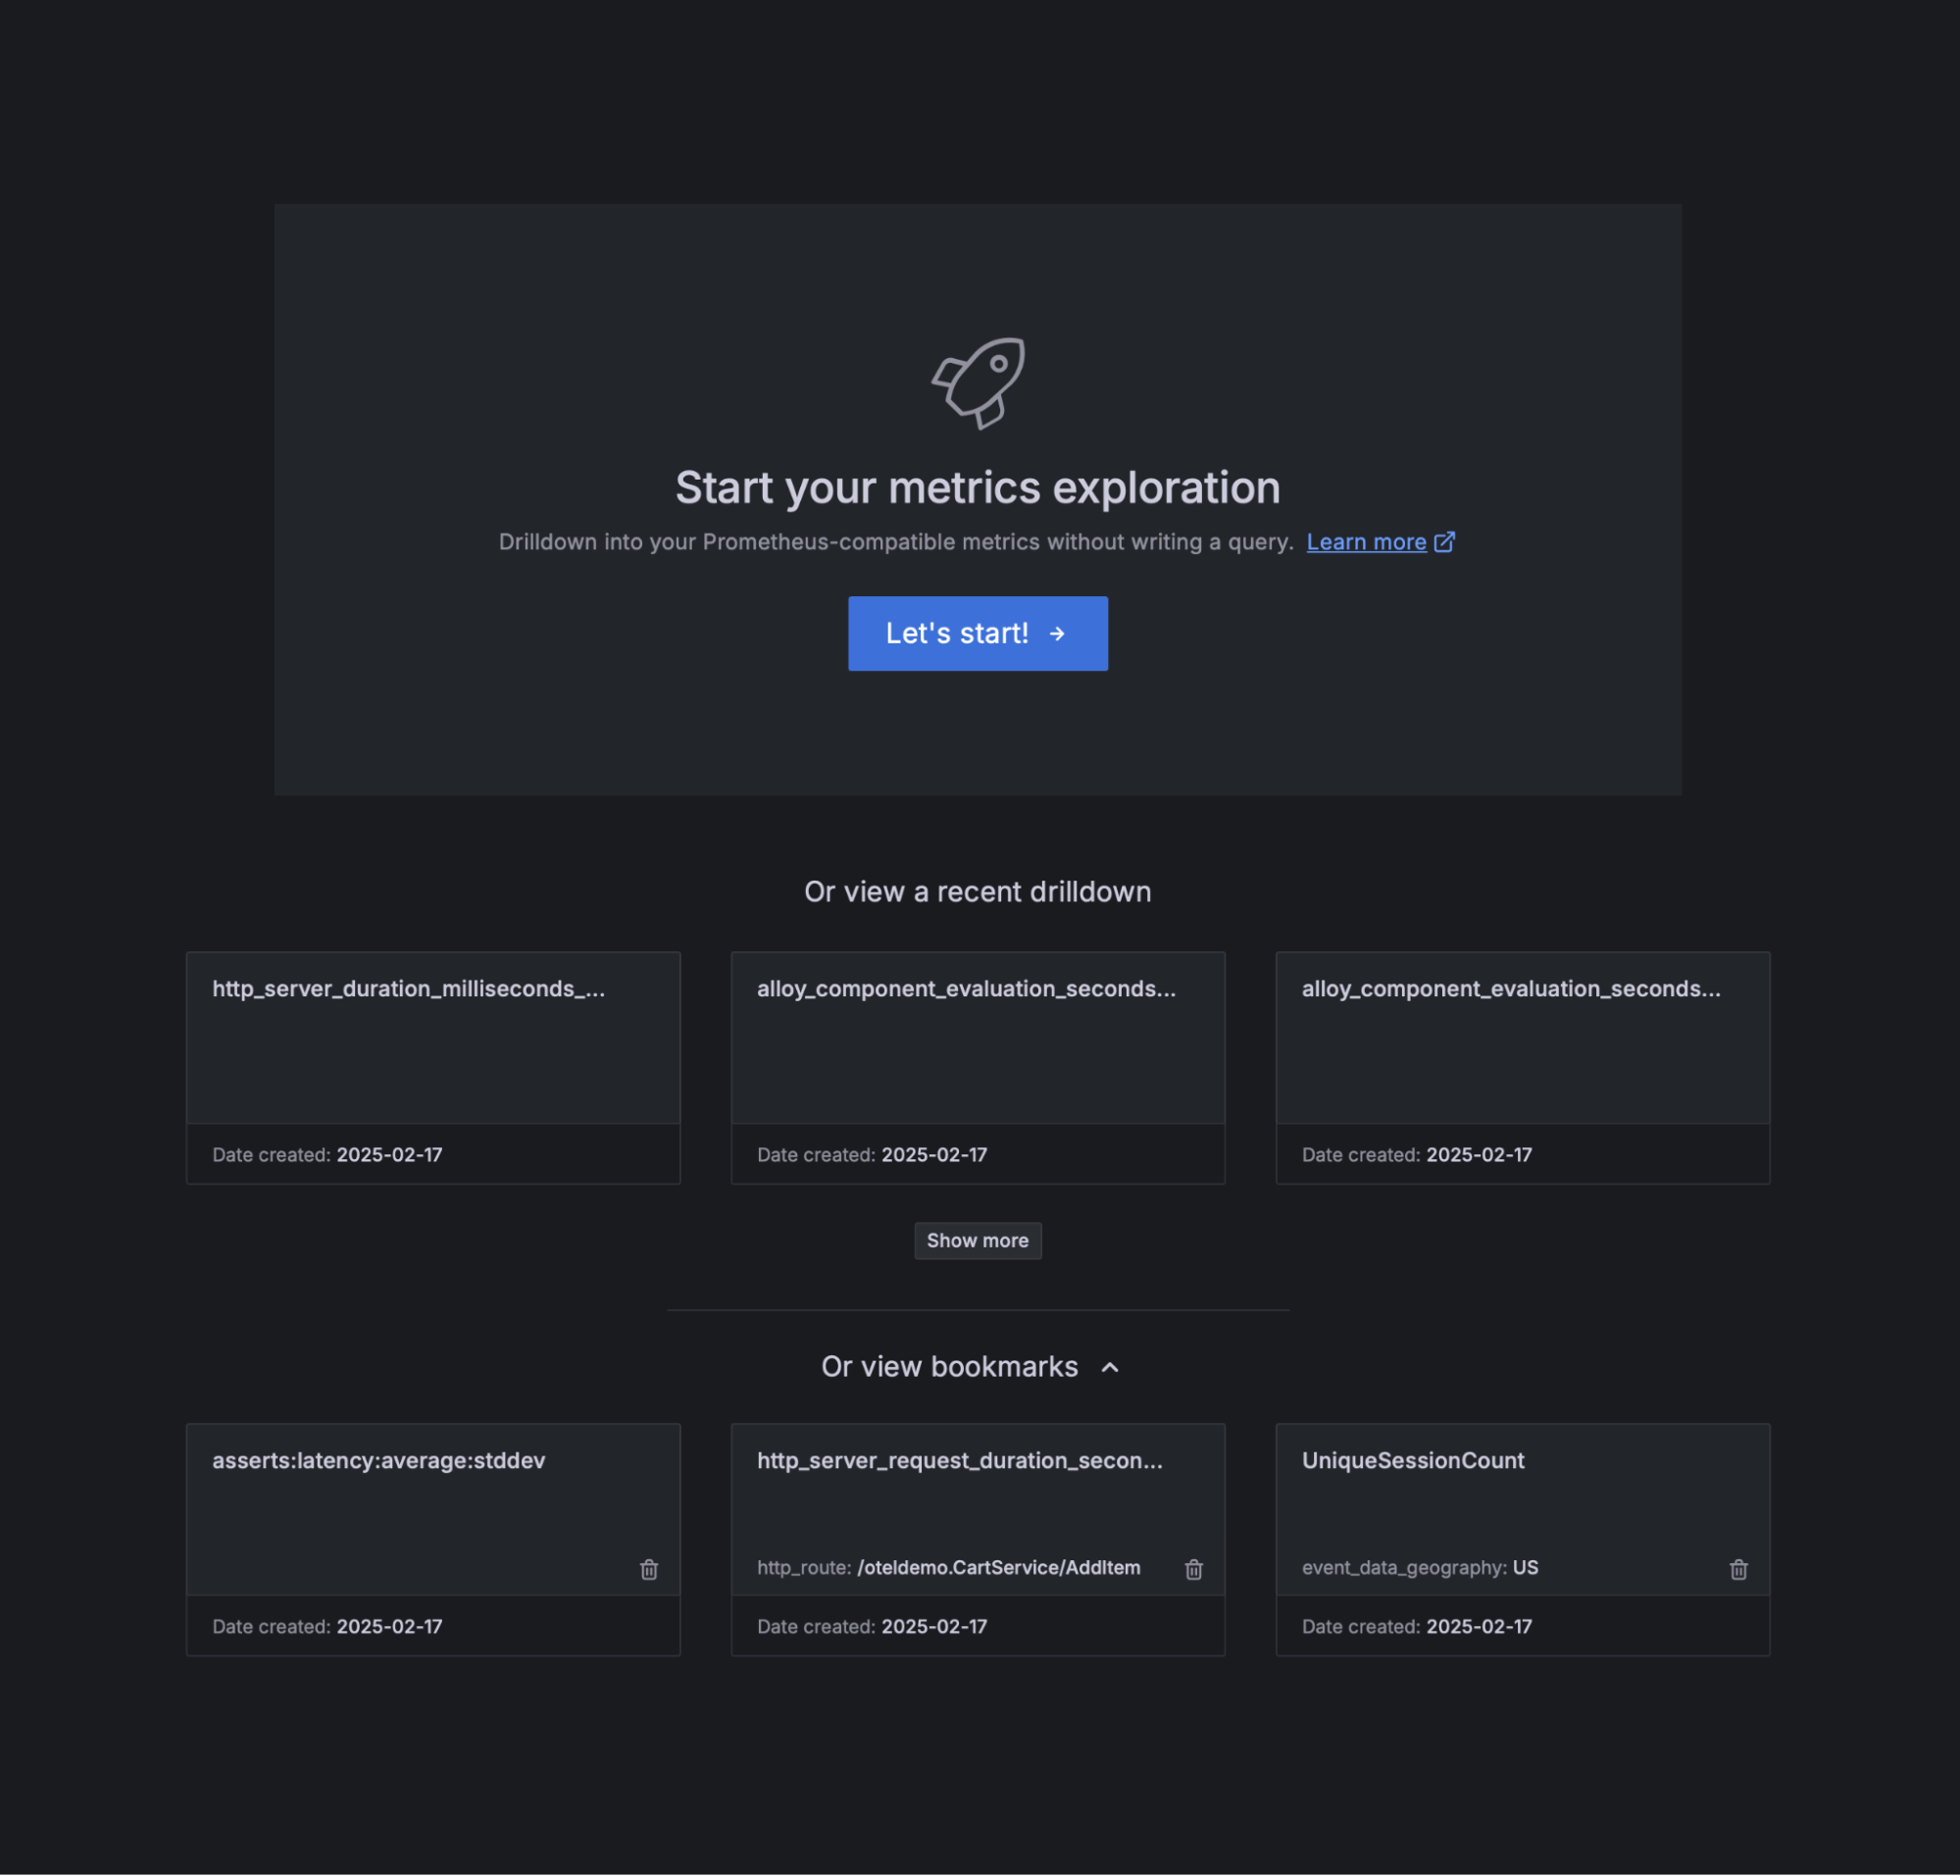
A new homepage
Metrics Drilldown now greets you with a new dedicated homepage that helps you pick up where you left off or quickly start a fresh exploration. As we continue iterating, expect an even more customizable and informative homepage to streamline your workflow. Stay tuned!
What’s new in Logs Drilldown
Customizable top-level filtering
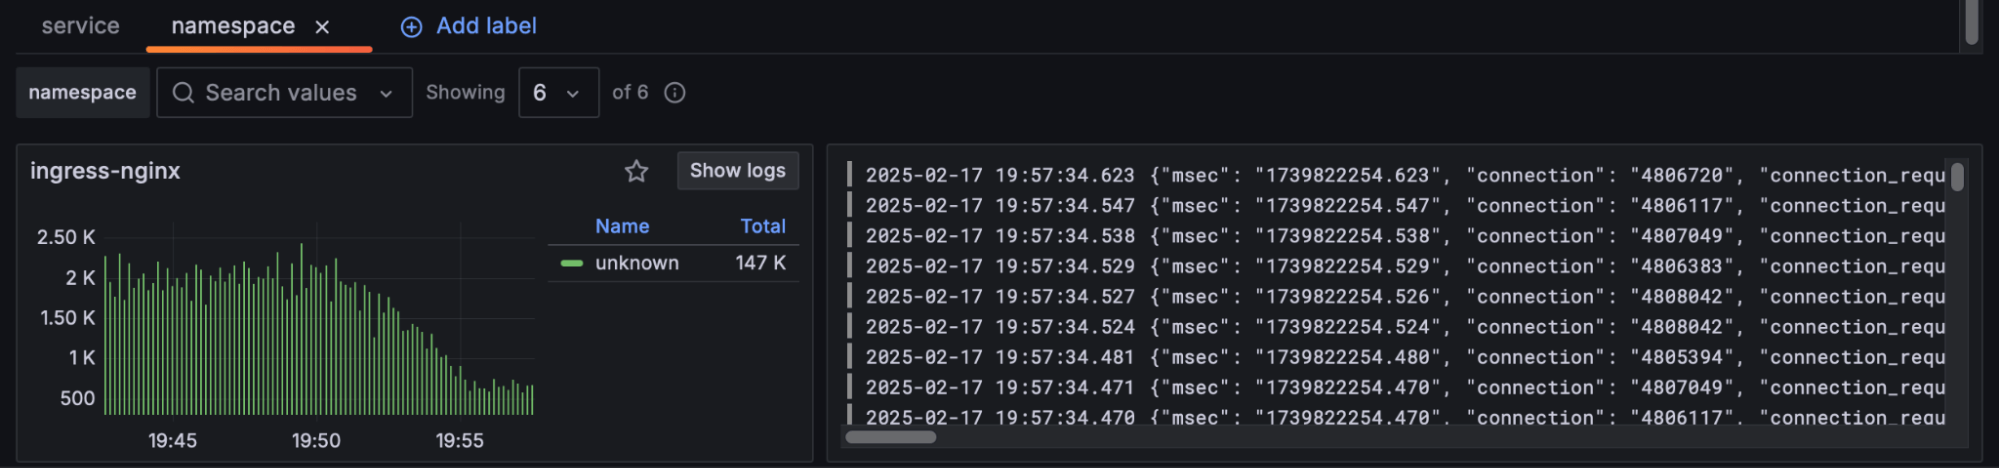
When Logs Drilldown first launched, users would browse their logs by filtering by service name. But we quickly learned that everyone’s environment is different—sometimes you need to filter by namespace or team. Now you can do just that by breaking down logs by any indexed label, so you see exactly what’s most relevant to your use case.
Performance improvements
We’ve invested in a few performance improvements in Logs Drilldown to accommodate even the largest Loki environments. You’ll experience faster load times, smoother searches, and more fluid navigation through massive volumes of log data. Let’s briefly look at two specific changes.
Query streaming
With query streaming, results appear as they’re processed—no more waiting for the entire query to finish. This real-time approach helps you spot trends and anomalies sooner.
This feature is currently behind an experimental feature toggle. If you are a Grafana Cloud customer, submit a support request to enable this functionality today. To enable it in OSS Grafana, add exploreLogsShardSplitting to the list of enabled feature toggles in your Grafana configuration file.
Infinite scrolling
Gone are the days of hitting line limits. Infinite scrolling automatically fetches the next set of log lines, so you can keep digging without manual pagination or arbitrary cutoffs.

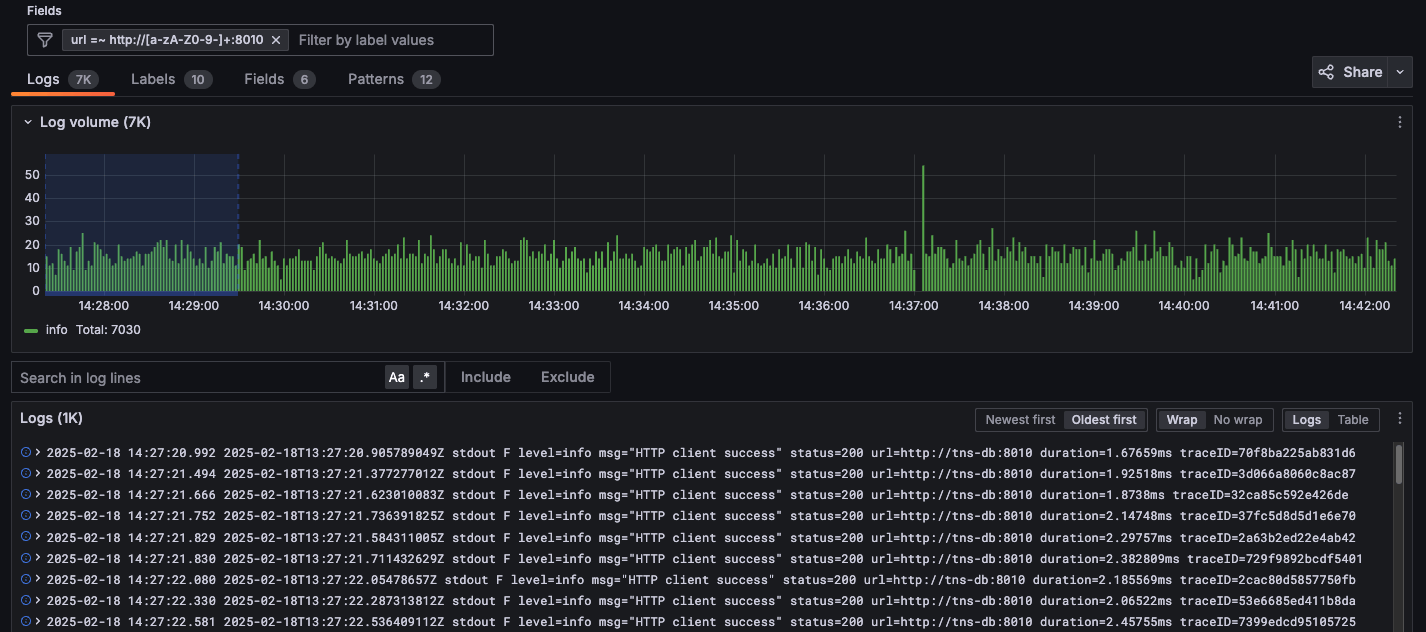
Regex filtering support
Need a more powerful way to sift through your log lines? Regex filtering gives you a tool to spot patterns or text hidden deep in raw log lines. In this example, you can see a regular expression being applied that matches any URL using port 8010.
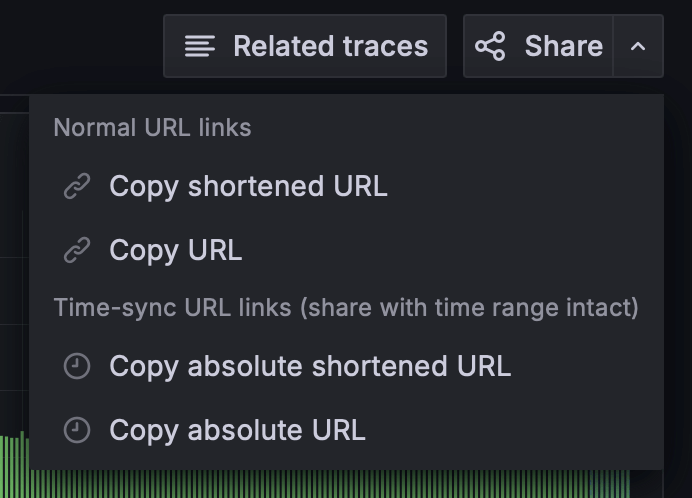
Sharing is caring
Collaboration doesn’t stop with your findings—now you can share direct links to a specific log line, a time range, or an entire results set. We’ve also added URL shortening to keep these links tidy and easy to share across your team.
What’s new in Traces Drilldown
We are still working hard to prepare Traces Drilldown for General Availability. While we aren’t quite there yet, here are some things we’ve done to improve the experience.
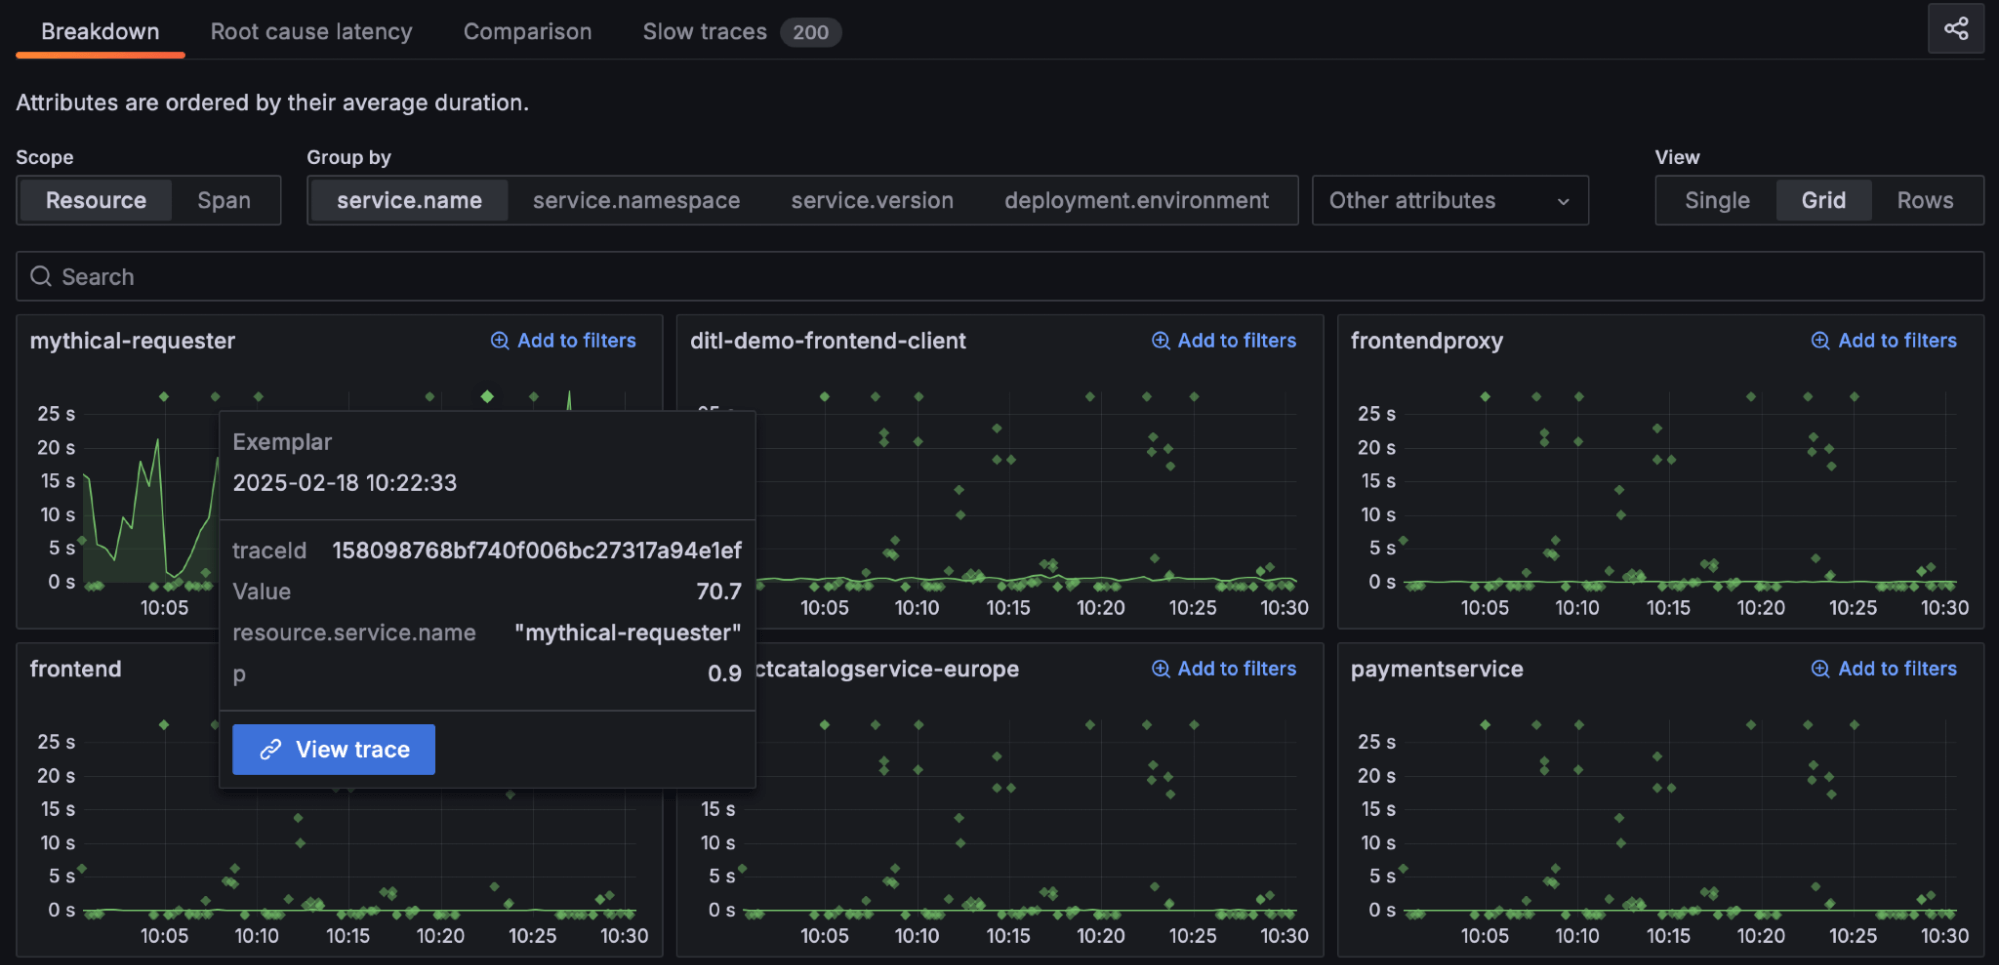
Exemplars
Metrics are great for giving you an aggregated system overview—when and where a problem happened. But traces reveal a detailed story behind each request or transaction—why and how it happened. With exemplars, we connect these two worlds seamlessly. Each exemplar, marked by a highlighted star, links you to the corresponding trace, so you can jump from your metric of interest directly to a single-request view.
View traces in a drawer
You can now view the trace details in a resizable drawer (or sliding panel) instead of a fixed side-by-side layout. This gives you more flexibility when diving into trace spans and more space for exploring deep traces without feeling cramped. Expand or collapse the trace details as needed, and navigate the trace tree without losing context from the rest of the screen.

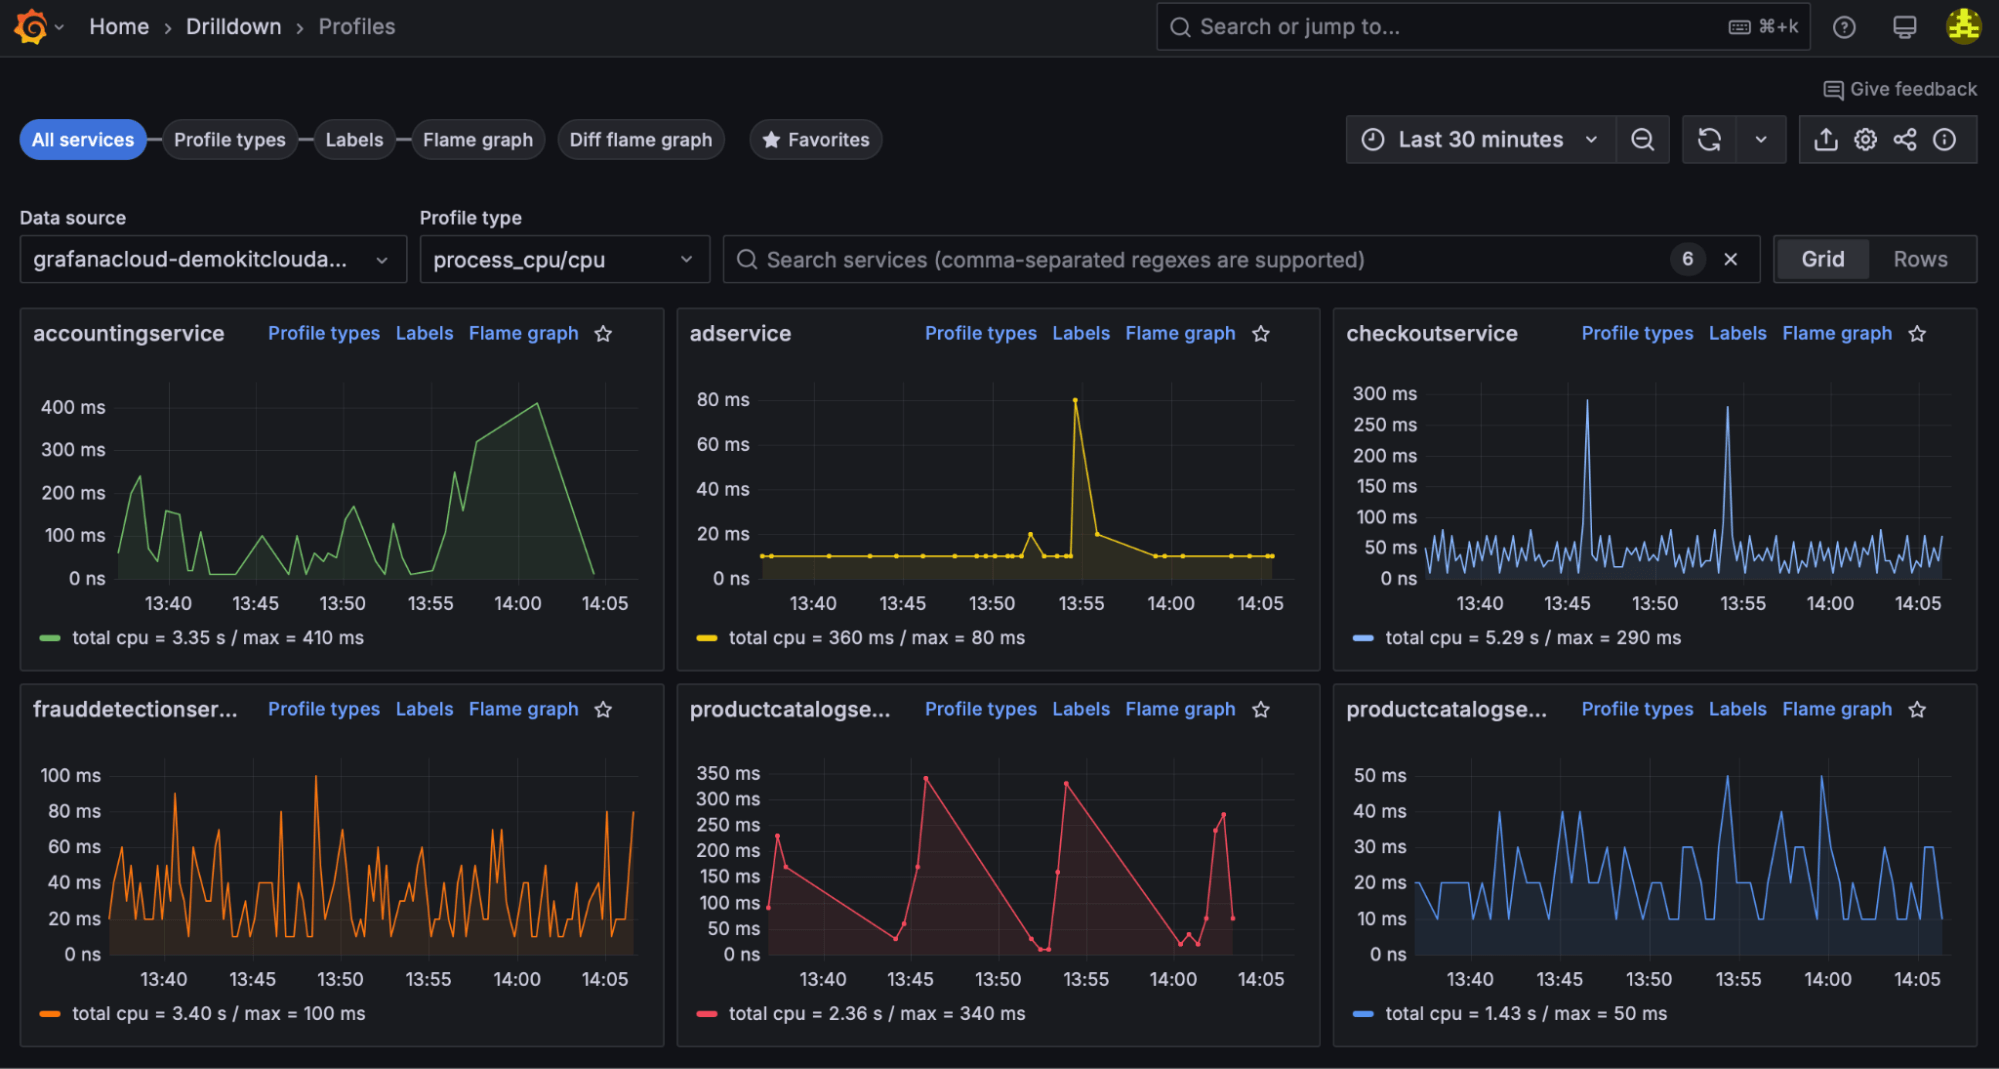
Profiles Drilldown hits Generally Availability
Finally, we’re thrilled to announce Profiles Drilldown is now generally available. We’ve spent the last few months hardening features for common use cases—such as reducing latency, cutting costs, and speeding up incident resolution. Whether you’re a developer debugging code in production or a DevOps engineer hunting down a memory leak, Profiles Drilldown streamlines the journey to actionable answers.
Ready to drill down into your telemetry data?
With the launch of Drilldown, we’ve made it simpler, faster, and more intuitive than ever to uncover insights—without compromising the raw power that seasoned users rely on. Whether you’re investigating metrics, logs, traces, or profiles, each Drilldown app is built to help you find answers quickly and collaborate effectively.
Give these new features a try and let us know what you think. Happy exploring—and now, happy drilling down!
For more information reference our technical docs or try a demo first hand in Grafana Play.
Grafana Cloud is the easiest way to get started with metrics, logs, traces, dashboards, and more. We have a generous forever-free tier and plans for every use case. Sign up for free now!


