

How to cut costs for metrics and logs: a guide to lowering expenses in Grafana Cloud
Observability is essential to maintaining system reliability, but as your infrastructure scales, so do your costs. Between metrics and logs, managing telemetry data can become overwhelming and expensive.
Grafana Cloud is already designed to be cost-efficient, but scaling can still present cost challenges. The good news? Grafana provides robust tools and best practices to help optimize observability data and rein in spending.
In this blog, we’ll explore how you can reduce your costs for metrics and logs in Grafana Cloud as you scale. Whether you’re new to Grafana or a long-time user, these strategies are designed to make your observability investment more efficient and effective, so let’s explore how you can reduce your costs in Grafana Cloud as you scale.
Best practices for optimizing metrics costs
Metrics are the most common type of telemetry data used for monitoring systems, but they can quickly get out of hand as your data grows exponentially. Let’s first cover the two most common causes of a high metrics ingestion rate in Grafana: data points per minute (DPM) and cardinality.
DPM
DPM refers to your configured metrics scrape interval. For example:
- 1 DPM = metrics scraped every 60 seconds
- 2 DPM = metrics scraped every 30 seconds
- 4 DPM = metrics scraped every 15 seconds
1 DPM is often sufficient for most use cases, and it’s the default setting for most collectors, including the OpenTelemetry Collector, Prometheus, and Grafana Alloy.

Accidental misconfigurations or inherited settings from other systems are the main causes behind accidental spikes and unnecessarily high scrape intervals.
Sometimes, however, a higher scrape interval is required (<10% of use cases), such as:
- When higher DPM might be justified: Real-time monitoring for critical systems, like high-frequency trading or healthcare devices.
- When higher DPM is unnecessary: For metrics with gradual changes, like server health checks, infrastructure performance baselines, or standard application logs.
For example, running a fleet of web servers and accidentally setting your scrape interval to 10 seconds (6 DPM) rather than 60 seconds (1 DPM), will mean you’re ingesting 6x the data without added visibility benefits. Adjusting back to 1 DPM reduces both noise and costs by a factor of 6!
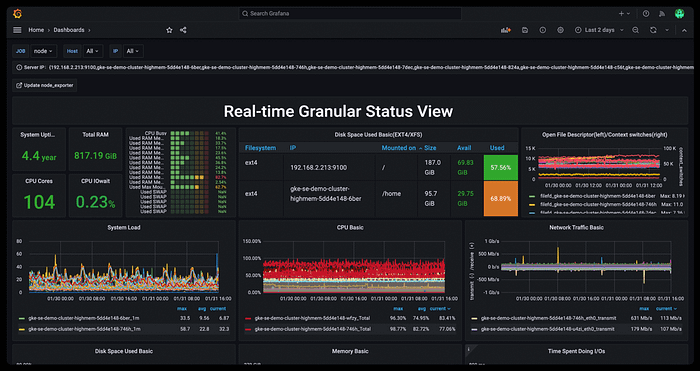
To find your current DPM configuration as a Grafana Cloud user, log into your Grafana instance. (If you don’t already have one, you can sign up for a forever-free Grafana Cloud account today.) On the left-hand menu select Administration > Cost management > Billing dashboard.
Once you’re in your billing dashboard, scroll down to the metrics section and select the “Metrics Ingestion Details” drop down.
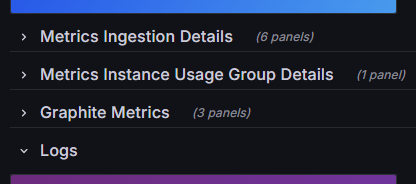
Here you will find your current stacks and the DPM they’re running at, which should look something like:
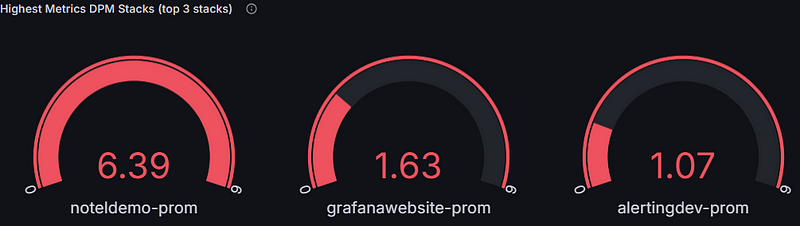
If the DPM is higher than required, edit the scrape_interval configuration in your Prometheus setup or other compatible collectors. (Here’s the documentation to follow to reduce your DPM.) Default configurations are often available in documentation for systems like Grafana Alloy or the OpenTelemetry Collector, and a simple adjustment can yield immediate savings.
Adaptive Metrics
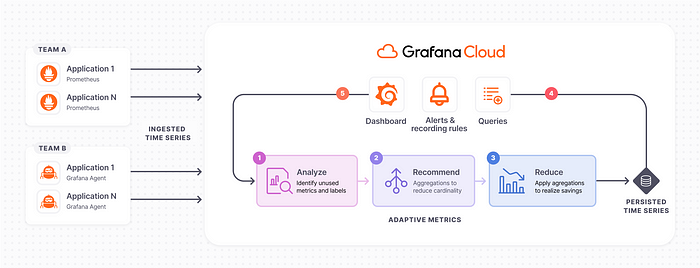
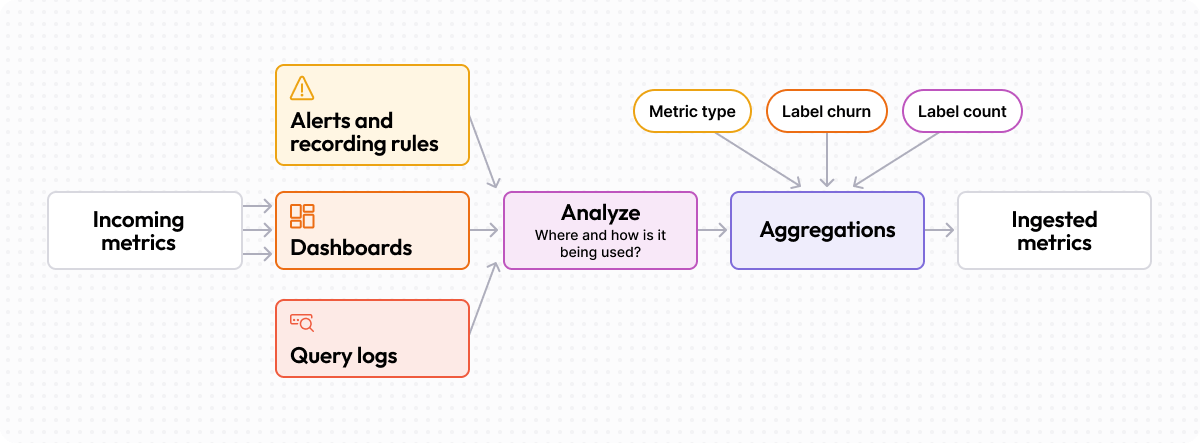
Manually analyzing usage patterns for millions of time series is a challenging and error-prone task. It requires you to examine how metrics are used across dashboards, alerts, queries, and scripts.
That’s why Adaptive Metrics is such a game changer. Unique to Grafana Cloud, Adaptive Metrics analyzes your metric usage and recommends aggregating unused or partially used metrics into lower-cardinality versions of themselves. To date, Adaptive Metrics has delivered a 35% reduction in metrics costs on average for more than 1,500 organizations.
“We carefully watch our metric and cost consumption, and in the past we manually evaluated every metric to identify what to drop, which was extremely time consuming and a tedious process,” says Lydia Clarke, DevOps Engineer at SailPoint. “Grafana Cloud Adaptive Metrics simplified this process for us by generating recommendations curated for our environment, reducing the amount of time spent by half. I wish I had this feature sooner.”
Among those who haven’t used Adaptive Metrics yet, one concern we often hear is: “What if I remove something I need later?” Well, don’t worry — you can toggle the rules and roll back changes on demand. Also, we aggregate the highest cardinality label, while maintaining others, to keep a trace of the metric around it so developers can discover it in the future if needed.
It’s important to note that we’ve specifically built this solution to have no effect on your existing systems. Aggregation isn’t new, but what’s unique here is the ability to honor your usage patterns, meaning no rewriting dashboards, alerts, or previously executed queries.
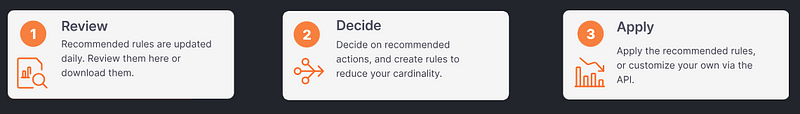
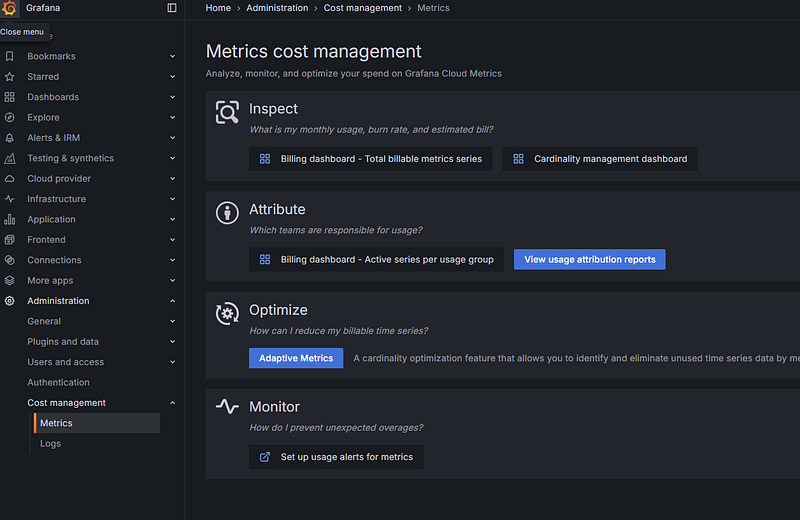
To start optimizing your metrics, it’s as simple as loading up your Grafana instance > selecting the Administration drop down in the left-hand menu > Cost management > Metrics cost management > Adaptive Metrics.
This will give you an insight into all of the current recommendations that you can toggle.
Client-side filtering
Of course, if your metrics are completely useless, maybe it’s best to prevent them from being collected in the first place.
While Adaptive Metrics optimizes data after ingestion, client-side filtering gives you control over what’s sent to Grafana Cloud in the first place. This involves configuring your data collectors to filter unnecessary metrics at the source.
Here you can precisely control which metrics and labels are sent, allowing you to focus on the most important data for your specific use cases. You can then optimize the rest with Adaptive Metrics, or vice versa.
Now, you might be wondering: Why would someone use client-side filtering to cut costs rather than doing all of it through Adaptive Metrics? Well, there are two main reasons:
- It reduces ingestion costs by preemptively excluding low-value data.
- It gives teams precise control over which metrics and labels are forwarded.
For example, a DevOps team managing Kubernetes clusters might identify several unused metrics — like debug-level logs or internal component status updates — and filter them out at the source. This reduces cost while maintaining relevant data for troubleshooting.
Next, let’s look at how you can put this into practice. One way to implement client-side filtering of metrics is by using the write_relabel_config feature in Prometheus. This allows you to control which metrics are sent to remote storage, such as Grafana Cloud.
remote_write:
- url: <Your Metrics instance remote_write endpoint>
 remote_timeout: 30s
 write_relabel_configs:
 - source_labels: [__name__]
   regex: "apiserver_request_total|kubelet_node_config_error|kubelet_runtime_operations_errors_total"
   action: keep
 basic_auth:
   username: <your_remote_endpoint_username_here>
   password: <your_remote_endpoint_password_here>
This configuration snippet demonstrates an “allowlisting” approach. It keeps only the specified metrics (apiserver_request_total, kubelet_node_config_error, and kubelet_runtime_operations_errors_total) and drops all others before sending them to remote storage.
Best practices for optimizing log costs
Logging is the second-largest driver of rising telemetry costs, but the ROI often doesn’t scale proportionally. As systems grow, the number of services, interactions, and users also increases. This exponential growth in logs often outpaces the ability to effectively utilize them.
Logs frequently contain repetitive or low-value data, such as debugging information, verbose outputs, or redundant metadata. These contribute to storage and processing costs without equivalent benefits.
Not only this, but with all the extra data captured, teams also have to pay for the retention and processing overheads. It can become an absolute nightmare!
With all that said, logs are an essential part of most teams’ observability setup, so let’s look at ways to make them more economical.
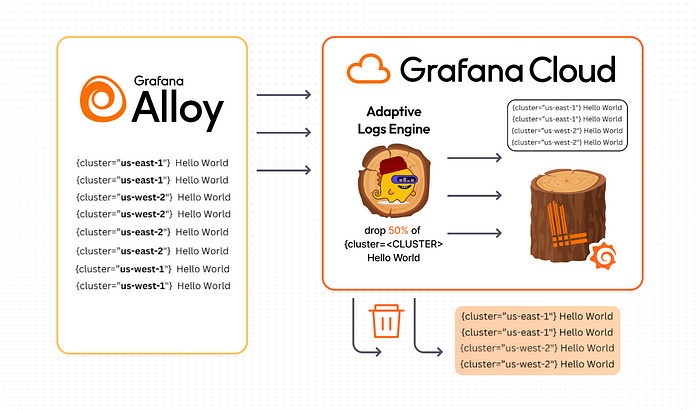
Adaptive Logs
Another game changer! Part of our growing Adaptive Telemetry suite, Adaptive Logs is an AI/ML-powered feature that analyzes observability data at scale to identify frequent log patterns and provide tailored optimization recommendations based on usage. Just like Adaptive Metrics, we recommend dropping telemetry that you aren’t using. (Outside of cost, this also improves system visibility by reducing noise.)
Introduced at ObservabilityCON 2024, users are already seeing the benefits of Adaptive Logs.
“Adaptive Logs helps reduce noise, making it easier to spot valuable logs and ultimately saves us costs,” says Andrew Qu, Software Engineer II at TeleTracking, an early adopter of Adaptive Logs that is already seeing a 50% reduction in log volumes, a leading indicator of potential cost savings.
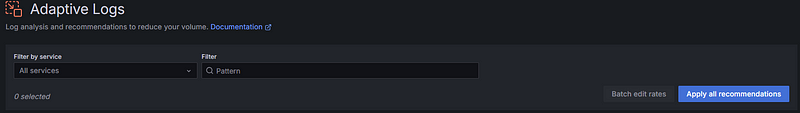
Finding this solution is easy. Follow similar steps as Adaptive Metrics: load your Grafana instance > selecting the Administration drop down in the left-hand menu > Cost management > Logs cost management > Adaptive Logs).
Log Volume Explorer
Adaptive Logs are great, but unexpected logging spikes can still cause chaos. Teams often scramble to identify the source (e.g., team, application, container, or namespace), assess whether logs can be reduced, and determine the cause of the spike, such as a new project or service.
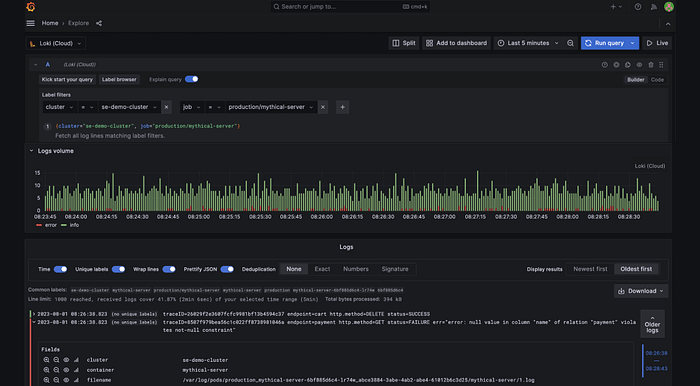
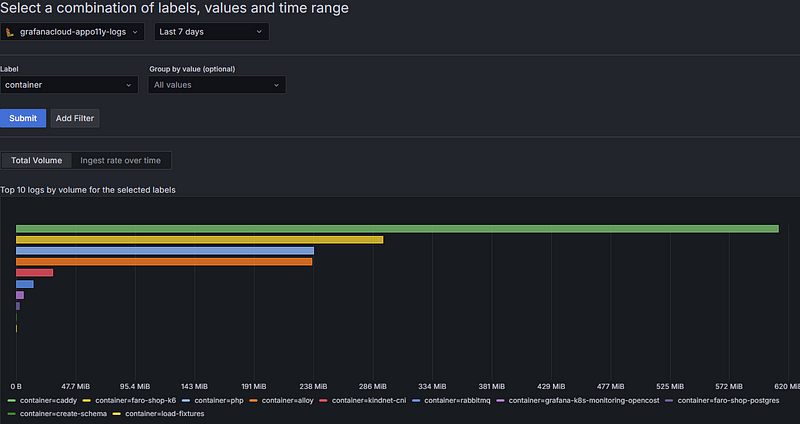
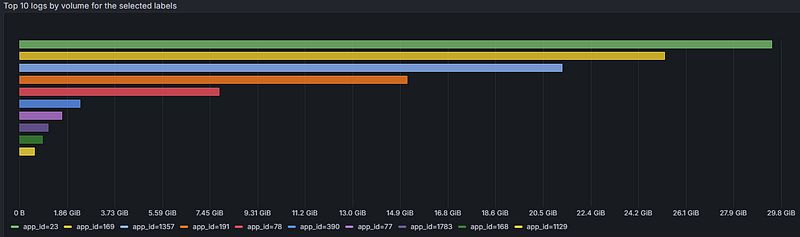
Log Volume Explorer offers a read-only view of log volume, helping pinpoint log traffic origins using labels, so you can better understand and manage your logging usage.
This powerful view helps you:
- Identify teams, environments, clusters, or apps generating the most logs
- Visualize log volume trends to spot spikes or cost drivers
- Drill down into specific labels to focus on concerns
- Optimize retention policies by understanding log patterns, reducing storage costs
- Spot opportunities to reduce verbosity or trim unnecessary logs
Pretty cool, right?
To get started, go to Administration in your Grafana Cloud instance on the left menu, then Cost management > Logs cost management > Log Volume Explorer.
Let’s say you want to find which service is responsible for the highest log volumes in your environment trailing the past week. In Log Volume Explorer, select the logging instance you want to explore, then choose “last 7 days” from the time range selector > choose the service_name label from the dropdown menu > Select “a group by value” (optional) > Submit. Magic!
More ways to cut costs in Grafana Cloud
We’ve covered the main contributors (metrics and logs) to a high observability bill and how to optimize them, but here are some other Grafana Cloud features you can use to ensure costs are optimized across your entire stack while still maintaining the correct levels of visibility:
- The cost management hub: This is essentially a centralized suite of tools in Grafana Cloud designed to help you monitor, control, and optimize observability expenses. Accessible via the Admin menu, it includes features such as usage attribution reports to identify team-specific consumption, a billing/usage dashboard to track monthly usage and estimated costs, usage alerts to prevent unexpected overages, and a cardinality management dashboard to analyze and manage metric cardinality effectively.
- Continuous profiling: Another emerging telemetry signal for observability, continuous profiling helps teams optimize costs by providing detailed insights into application performance at the code level. By identifying resource-intensive functions or bottlenecks in the codebase, teams can target specific areas for optimization, reducing unnecessary compute and memory usage. This not only improves application efficiency but also lowers infrastructure costs.
- Adaptive Tracing (roadmap): We continue to invest into solutions geared around lowering costs. To help address the increasing adoption of traces, Grafana Labs recently acquired TailQtrl to supercharge our development of Adaptive Tracing, so stay tuned for more on this.
Grafana Cloud is the easiest way to get started with metrics, logs, traces, dashboards, and more. We have a generous forever-free tier and plans for every use case. Sign up for free now!


