

Monitor Google Cloud: simplify and centralize your cloud provider observability with Grafana Cloud
Organizations increasingly rely on Google Cloud to power critical parts of their businesses, but managing those environments often involves navigating a labyrinth of disparate data, tools, and processes.
We built Google Cloud Observability in Grafana Cloud to reduce the complexity and confusion by providing a unified, scalable solution designed to simplify monitoring, enhance visibility, and optimize costs.
Let’s take a look at how you can use the app to make sure your Google Cloud environment is running smoothly and efficiently—and how you can consolidate monitoring data from all your cloud infrastructure providers in Grafana Cloud.
Why choose Google Cloud Observability in Grafana Cloud?
Our solution addresses key challenges in Google Cloud monitoring by giving your team a unified view, flexible setup, and tools to optimize observability costs. Let’s walk through some of the features that help you do just that.
Start monitoring your Google Cloud environment quickly
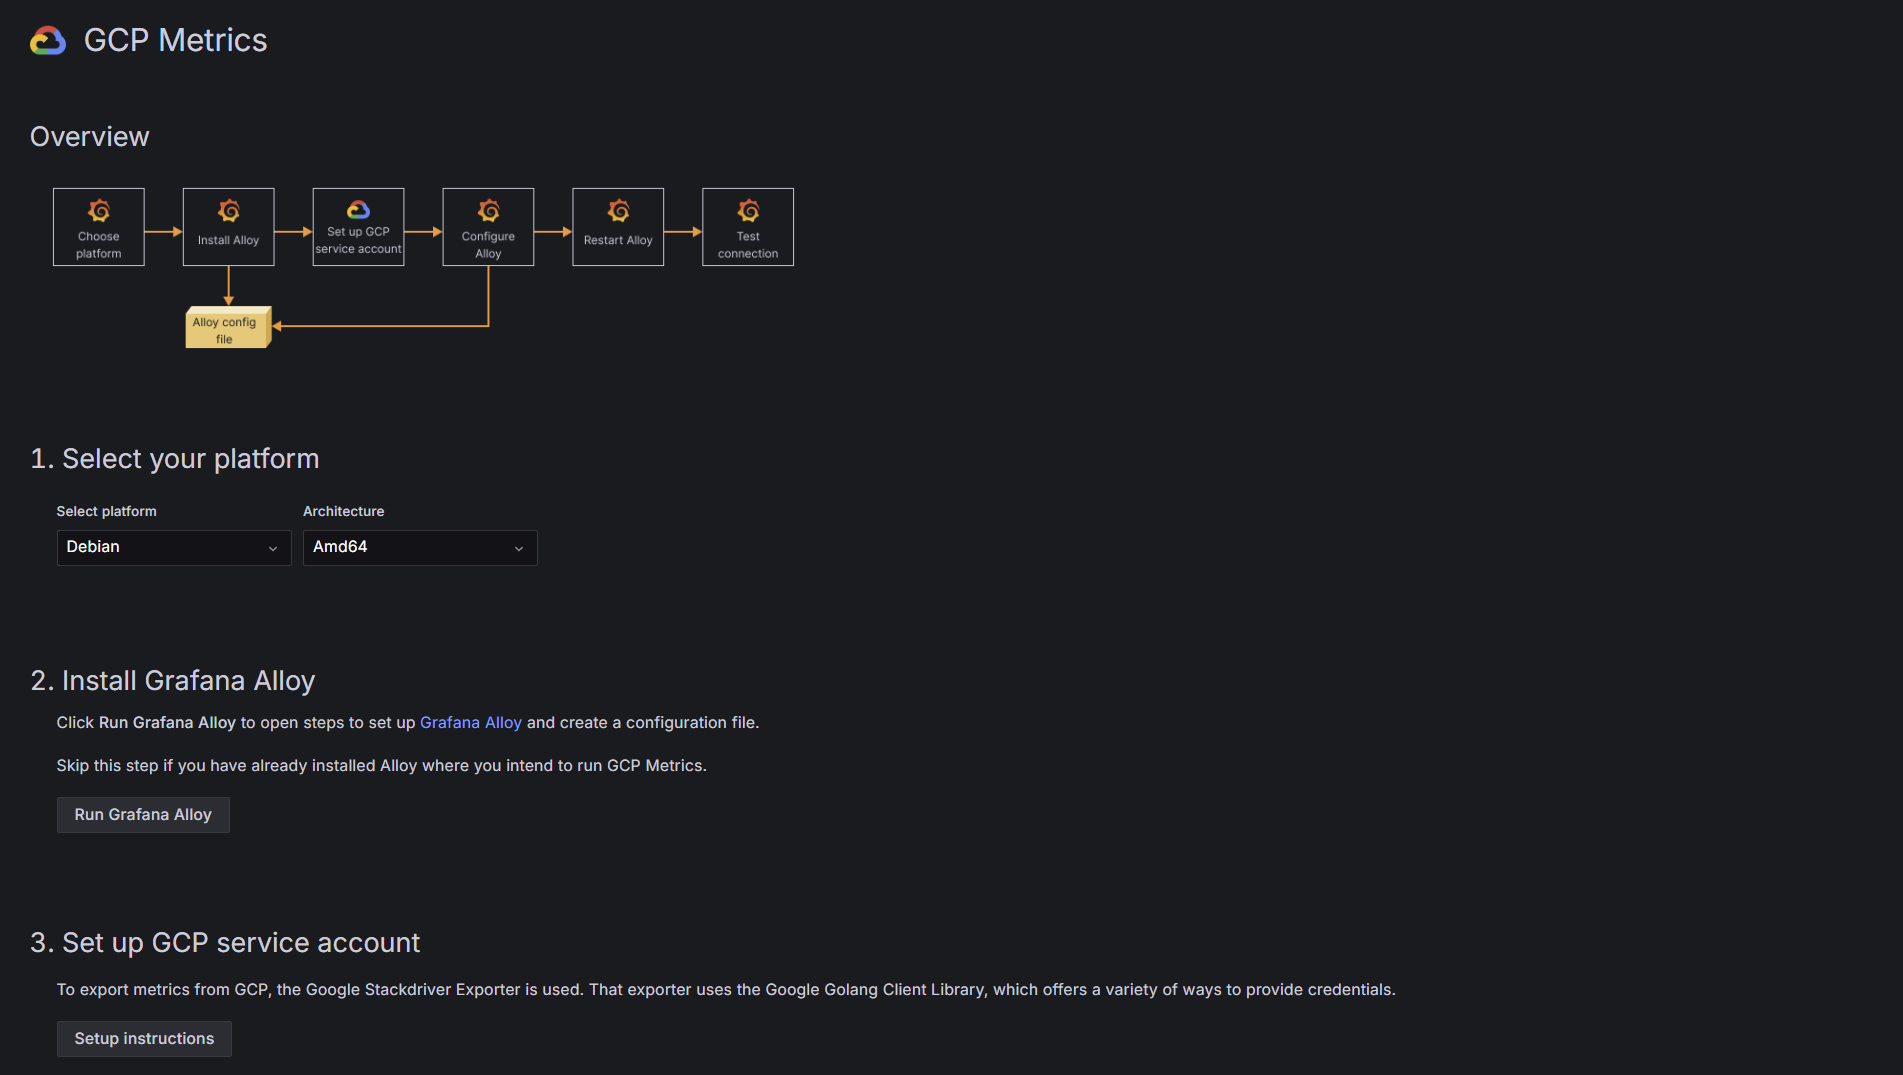
Getting set up with Google Cloud Observability is easy. Simply log into your Grafana Cloud account (If you don’t have one already, sign up for a forever-free account today) and navigate to Cloud Provider Observability. From there, select Google Cloud (GCP) and follow the steps outlined in the screenshot below.
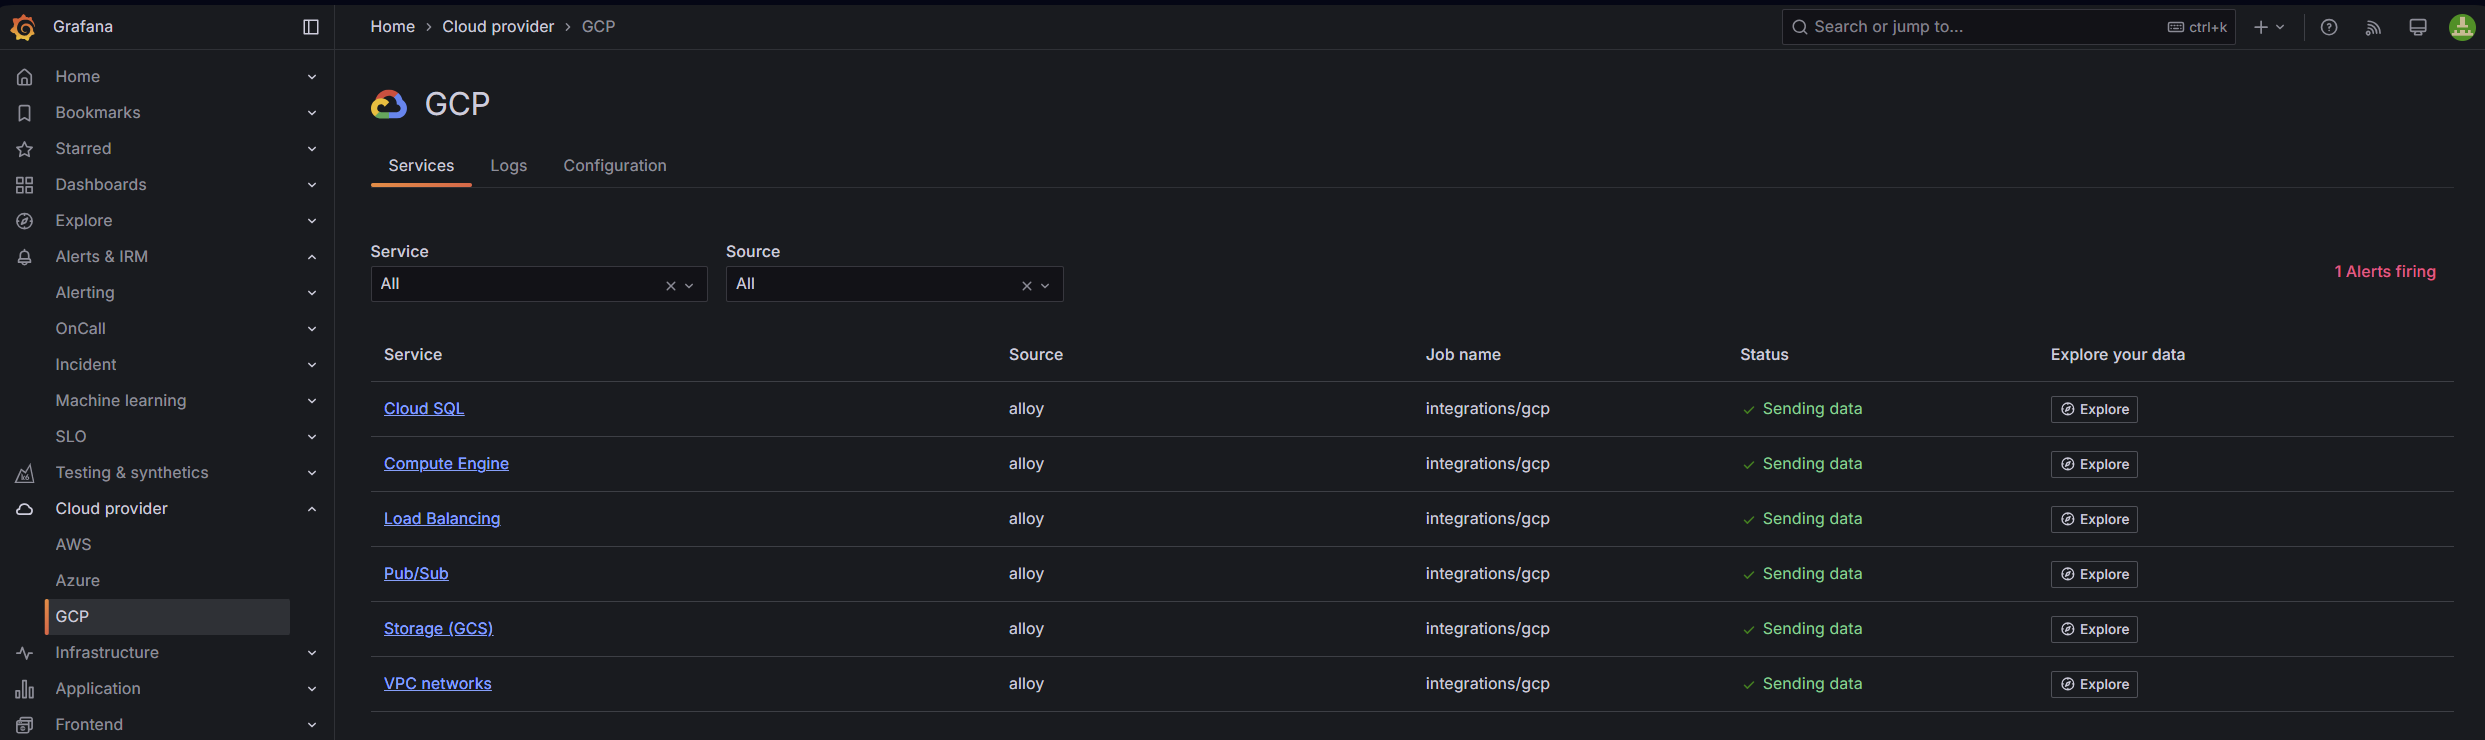
Typically, SREs, DevOps teams, and cloud administrators spend hours creating dashboards and alerts for critical services. But with Google Cloud Observability, you can forgo all that work and start getting insights faster. You’ll have access to preconfigured alerts based on Google Cloud best practices, as well as out-of-the-box dashboards tailored to Google Cloud, including:
- Cloud SQL: Analyze query performance, CPU/memory usage, and connection efficiency.
- Compute Engine: Monitor CPU, disk, and network metrics across projects or zones.
- Load Balancing: Assess backend health, traffic distribution, and latency trends.
- Pub/Sub: View subscription performance, message throughput, and error rates.
- Storage (GCS): Monitor bucket storage usage, API request types, and network traffic.
- VPC Networks: Track network performance and ensure optimal connectivity.
Centralize your view for Google Cloud telemetry and more
Managing logs in a fragmented Google Cloud ecosystem can be time-intensive. With Grafana Alloy, logs from Cloud Monitoring are sent to Grafana Cloud via Pub/Sub, offering a centralized interface. This allows teams to efficiently explore, filter, and pinpoint root causes.
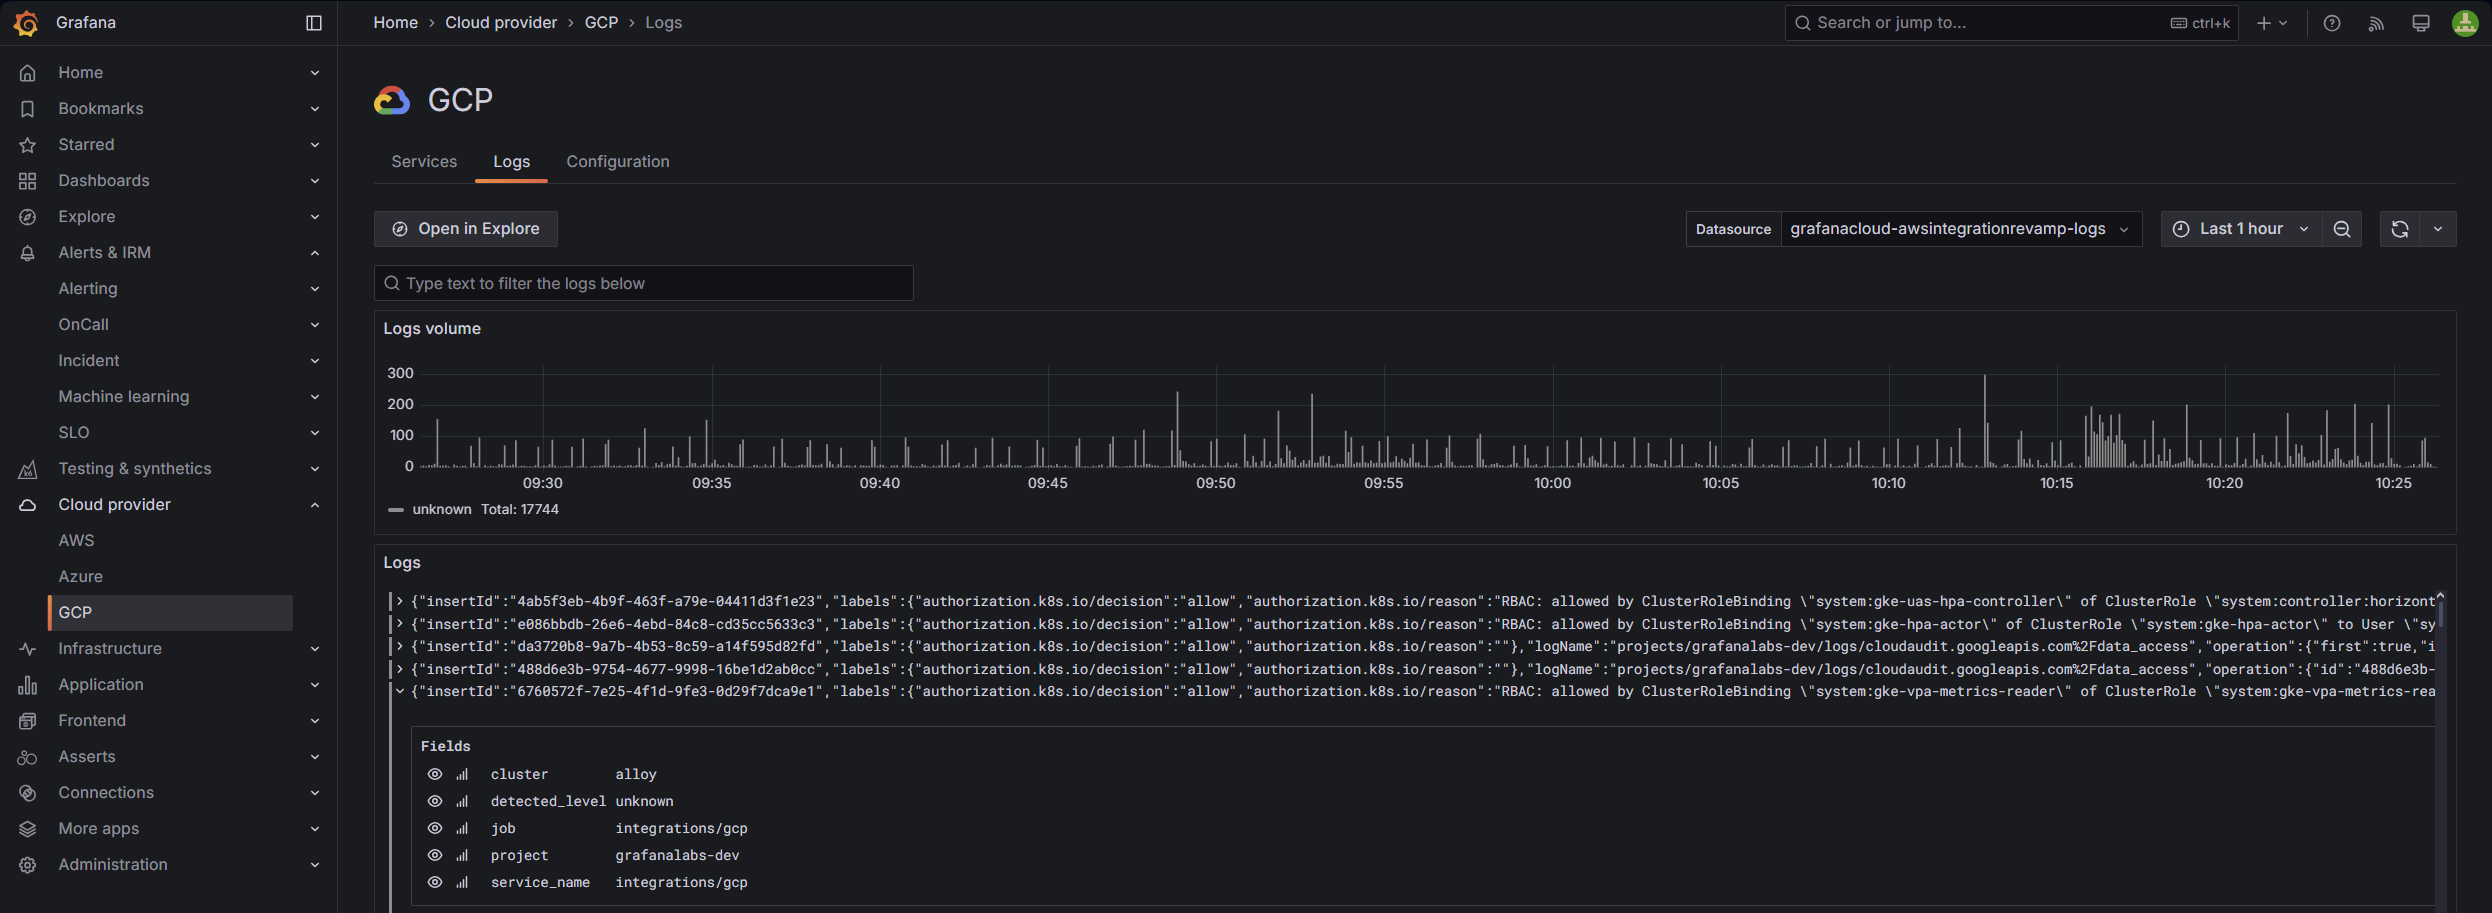
Alloy sends metrics from Cloud Monitoring to Grafana Cloud via its embedded stackdriver-exporter. This ensures you have access to both logs and metrics in our scalable platform, providing actionable insights as teams try to address issues and ensure better reliability.
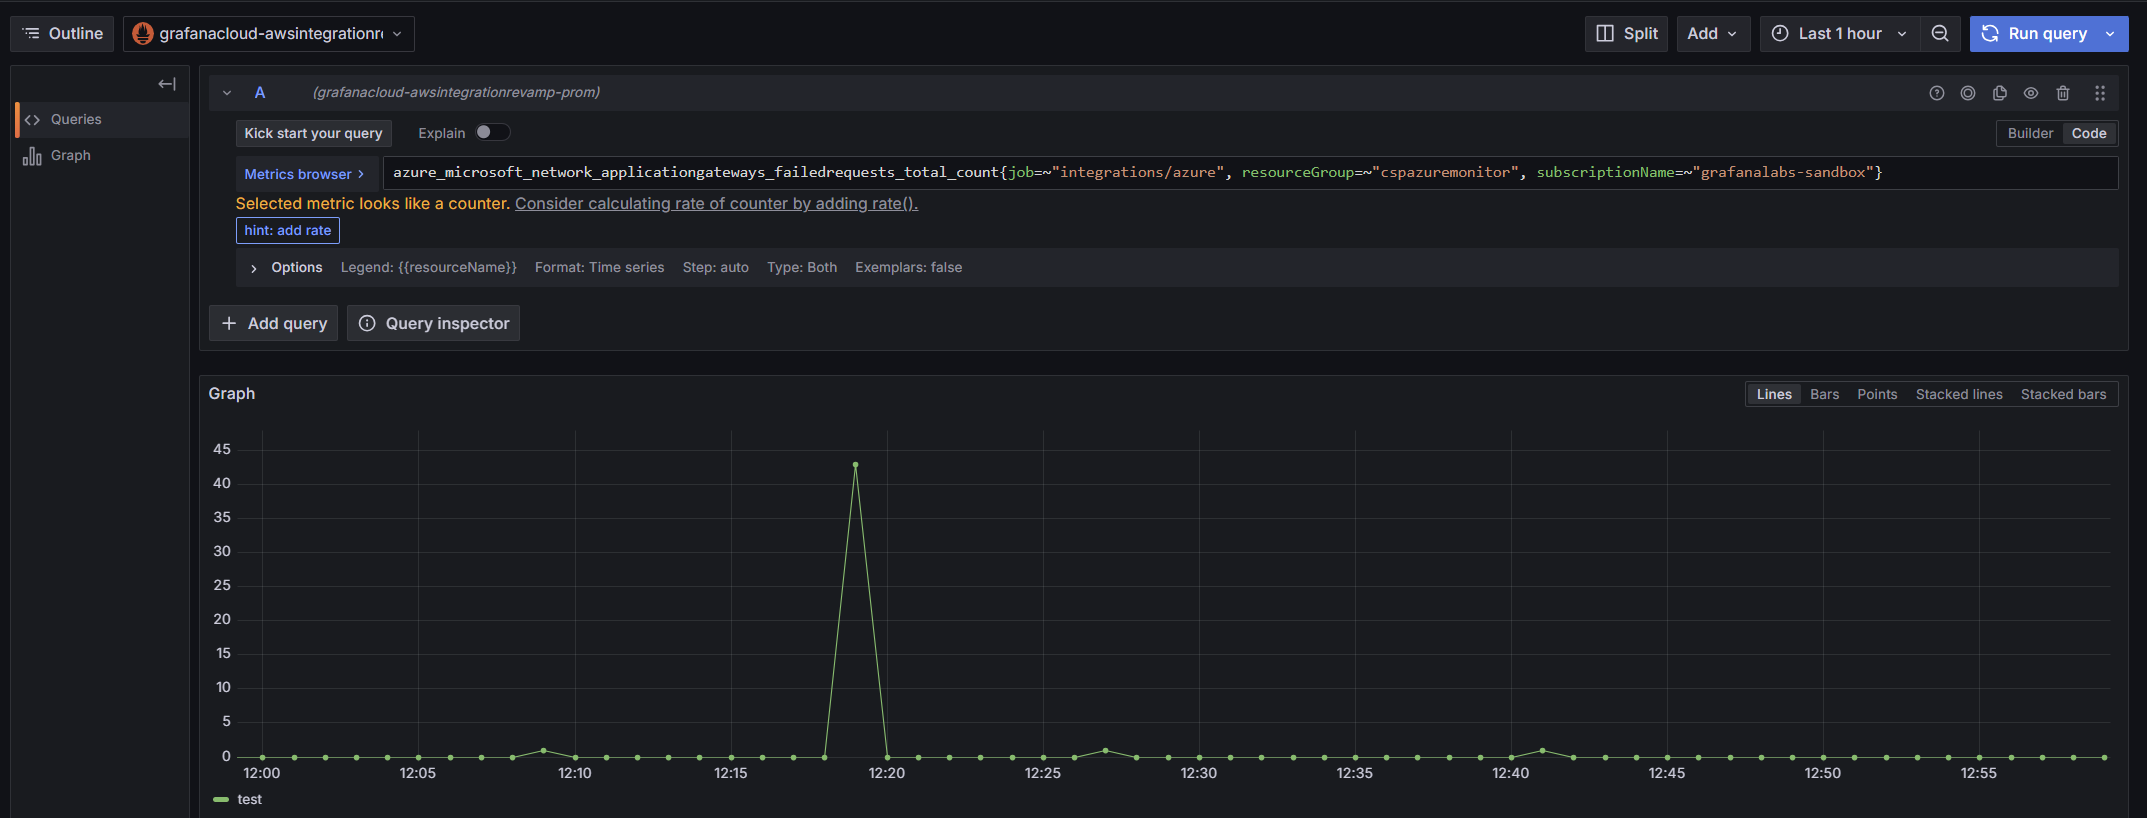
Of course, getting a truly unified view of your cloud infrastructure doesn’t end there, since many organizations today operate in multi-cloud environments. With Alloy, you can unify Google Cloud metrics and logs with data from other clouds and on-premises systems. By leveraging PromQL-based query languages, you can run seamless queries across platforms for holistic observability.
This solution is also part of our Cloud Provider Observability application, which we announced at ObservabilityCON 2024 in New York City. The Cloud Provider Observability app offers expanded support for multi-cloud environments and immediately detects all supported services, eliminating the manual effort needed to configure each platform.
You can now unify multi-cloud monitoring efforts with a single, out-of-the-box solution that integrates seamlessly with AWS, Azure, and Google Cloud, and get the same insights in the same UI.
What’s next for Google Cloud Observability
We’re excited to help Google Cloud users better monitor their services, and we plan to continue to innovate with our solution. We’re currently looking at more ways to streamline how you monitor Google Cloud, including:
- Agentless log and metric streaming: Real-time data ingestion without additional infrastructure.
- Terraform integration: Automated and repeatable configurations to enhance scalability.
Grafana Cloud makes it easy to centralize your Google Cloud metrics, logs, and dashboards. Get started today and gain control of your Google Cloud environment in just minutes!
Grafana Cloud is the easiest way to get started with metrics, logs, traces, dashboards, and more. We have a generous forever-free tier and plans for every use case. Sign up for free now!
