

Grafana Beyla 2.0: distributed traces, scalable Kubernetes deployments, and more
In November 2023, we released Grafana Beyla 1.0, the first major milestone in our pursuit of zero-code (and zero-effort) eBPF instrumentation. We delivered a way — through a single command-line — to automatically instrument any application supporting HTTP/gRPC protocols, as well as provide basic network packet flow information.
Now, it’s time to turn the page and announce Grafana Beyla 2.0, the next major release of the open source project that delivers a number of performance and functional improvements, deeper alignment with the OpenTelemetry project, and so much more.
First, what is Grafana Beyla?
Grafana Beyla is a vendor-agnostic, open source eBPF zero-code instrumentation tool that lets you easily get started with OpenTelemetry and Prometheus application observability. We use eBPF to automatically inspect application executables and the OS networking layer, allowing us to capture essential application telemetry for HTTP/S and gRPC services. Beyla can also instrument the networking layer with eBPF, provide deep insights into the network flow of applications, and correlate that information with application-level transactions.
You can use Beyla to instrument any application service running on an eBPF-enabled Linux system. Perhaps you just want to get started quickly with OpenTelemetry, or perhaps you’re migrating from proprietary instrumentation to OpenTelemetry. Here are some examples of use cases where Beyla really shines:
- Instrumentation for programming languages where OpenTelemetry SDK zero-code auto-instrumentation is not supported, such as Rust, C++, Erlang, Zig, Ruby, Swift, Perl, Lua, Dart, R, Java GraalVM Native, and Julia.
- Instrumentation for legacy applications where it’s not easy to migrate the codebase to OpenTelemetry SDK-compatible frameworks.
- Instrumentation for applications where the source is not available or that are proprietary and/or distributed in binary form.
- A unified way to capture application-level metrics across different technologies.
- Capturing network-level metrics, regardless of the L3/L4/L7 protocol, that are used to build service graphs and reachability reports.
The use cases above demonstrate how Beyla fits into the current OpenTelemetry ecosystem. However, if we look at the future of OpenTelemetry use and adoption, Beyla plays an even bigger role.
For example, we recently had someone open a feature request to implement support for JSON-RPC, a protocol used heavily in blockchain services, in Beyla. Implementing support for a new protocol in OpenTelemetry across all programming languages is a monumental task, especially if there are many different client/server library implementations that use that new protocol standard. Implementing new protocol support in Beyla is relatively quick, and it would work regardless of the programming language the service is built with, or what client library was used.
What’s new in Beyla 2.0?
Beyla 2.0 delivers a number of new features, as well as refined features from previous minor releases. As such, the details below reflect a lot of the work we’ve done over the past year to advance the open source project.
Distributed traces
Beyla 2.0 fully supports distributed traces for any programming language, representing an industry first for application instrumentation.
The lack of inter-service context-propagation of the W3C Traceparent header made Beyla 1.0 not suitable for collecting distributed traces. We had implemented various approaches to mitigate this before. For example, we had a Go-specific implementation of context-propagation that worked only with system administrator privileges and couldn’t be used on security-hardened Linux installations. We also had an intra-node context-propagation implementation, but as it only worked on services running on the same node, it never really met the expectations of our users.
With Beyla 2.0, we are introducing a new option to enable context-propagation for HTTP services implemented with any programming language. The new context-propagation support doesn’t require administrator privileges and is fully compatible with OpenTelemetry SDK-instrumented services. You can read more about it in our distributed tracing docs.
In the next few minor releases, we hope to expand the context-propagation support to gRPC/HTTP2 services, and eventually make it enabled by default if you are generating traces with Beyla.
Reduced permissions
Running eBPF always requires some elevated permissions, but certain permissions should be avoided in order to minimize your attack surface.
Since the 1.0 release, a lot of work has gone into Beyla to modularize the eBPF code and use finer-grained eBPF permissions. We’ve completely eliminated the need to run Beyla with system administrator privileges. Users can choose the level of permissions that works best for them and their security requirements; in cases where they choose not to grant permissions for a specific feature, we will gracefully degrade the functionality. For example, some users might choose to generate metrics, but not distributed traces.
In the past, we made extensive use of the BPF file system to share memory between the different BPF modules in Beyla. This was one of the last reasons we needed system administrator privileges. Mounting the BPF file system in containerized environments, such as Kubernetes, was not possible without some administrator access. In Beyla 1.8, we introduced the novel use of sharing BPF memory between the eBPF programs and we effectively eliminated the need for the BPF file system.
Scalable Kubernetes deployments
Beyla makes extensive use of Kubernetes APIs to annotate traces and metrics with service-level metadata. Providing Beyla with cluster-level visibility helps connect the dots between services that run on different nodes. However, if you are deploying Beyla on large clusters, with hundreds of nodes, the API usage from Beyla can negatively affect the performance of the Kubernetes API. For this reason, we have introduced a new Kubernetes Beyla Cache service, which you can now install through our Helm chart and scale according to your cluster size.
To deploy the new Kubernetes Beyla Cache service on large clusters, simply add the following settings in the values.yaml when deploying Beyla:
k8sCache:
  replicas: 1 # or any value larger than 0
Deeper alignment with OpenTelemetry
Since the day we implemented multi-process support in Beyla, we have used various heuristics to determine a suitable service name for the metrics and traces we produce. The zero-code/zero-configuration aspect of Beyla deployments means that we are not configuring service names for our application services like one would normally do with an OpenTelemetry SDK. Therefore, Beyla has to pull attributes from the application deployment to determine a meaningful service name for end users. This would often be the name of the service in Kubernetes, the name of the applications executable, or perhaps a name given to the service in a cloud deployment.
In Beyla 2.0, we’ve fully aligned the way we set the service name, the service namespace, and the service instance name, according to the specifications used by the OpenTelemetry Collector and the OpenTelemetry Kubernetes Operator. This makes the integration of Beyla-produced telemetry with OpenTelemetry-generated logs and profiles seamless. Going from Beyla metrics and traces to logs and profiles in Grafana Cloud has never been easier.
Support for new protocols
Since our 1.0 release, which only tracked the HTTP and gRPC protocols, we’ve added support for HTTP2, SQL, Redis, Kafka, PHP-FPM (FastCGI), and Unix Sockets. This means Beyla can now work with a much broader set of services and track more functionality within those services.
We started tracking network and connection metrics, which allows users to build solutions for service graphs. We worked hard to pick the right defaults, balancing ease of use with generating too many metrics.
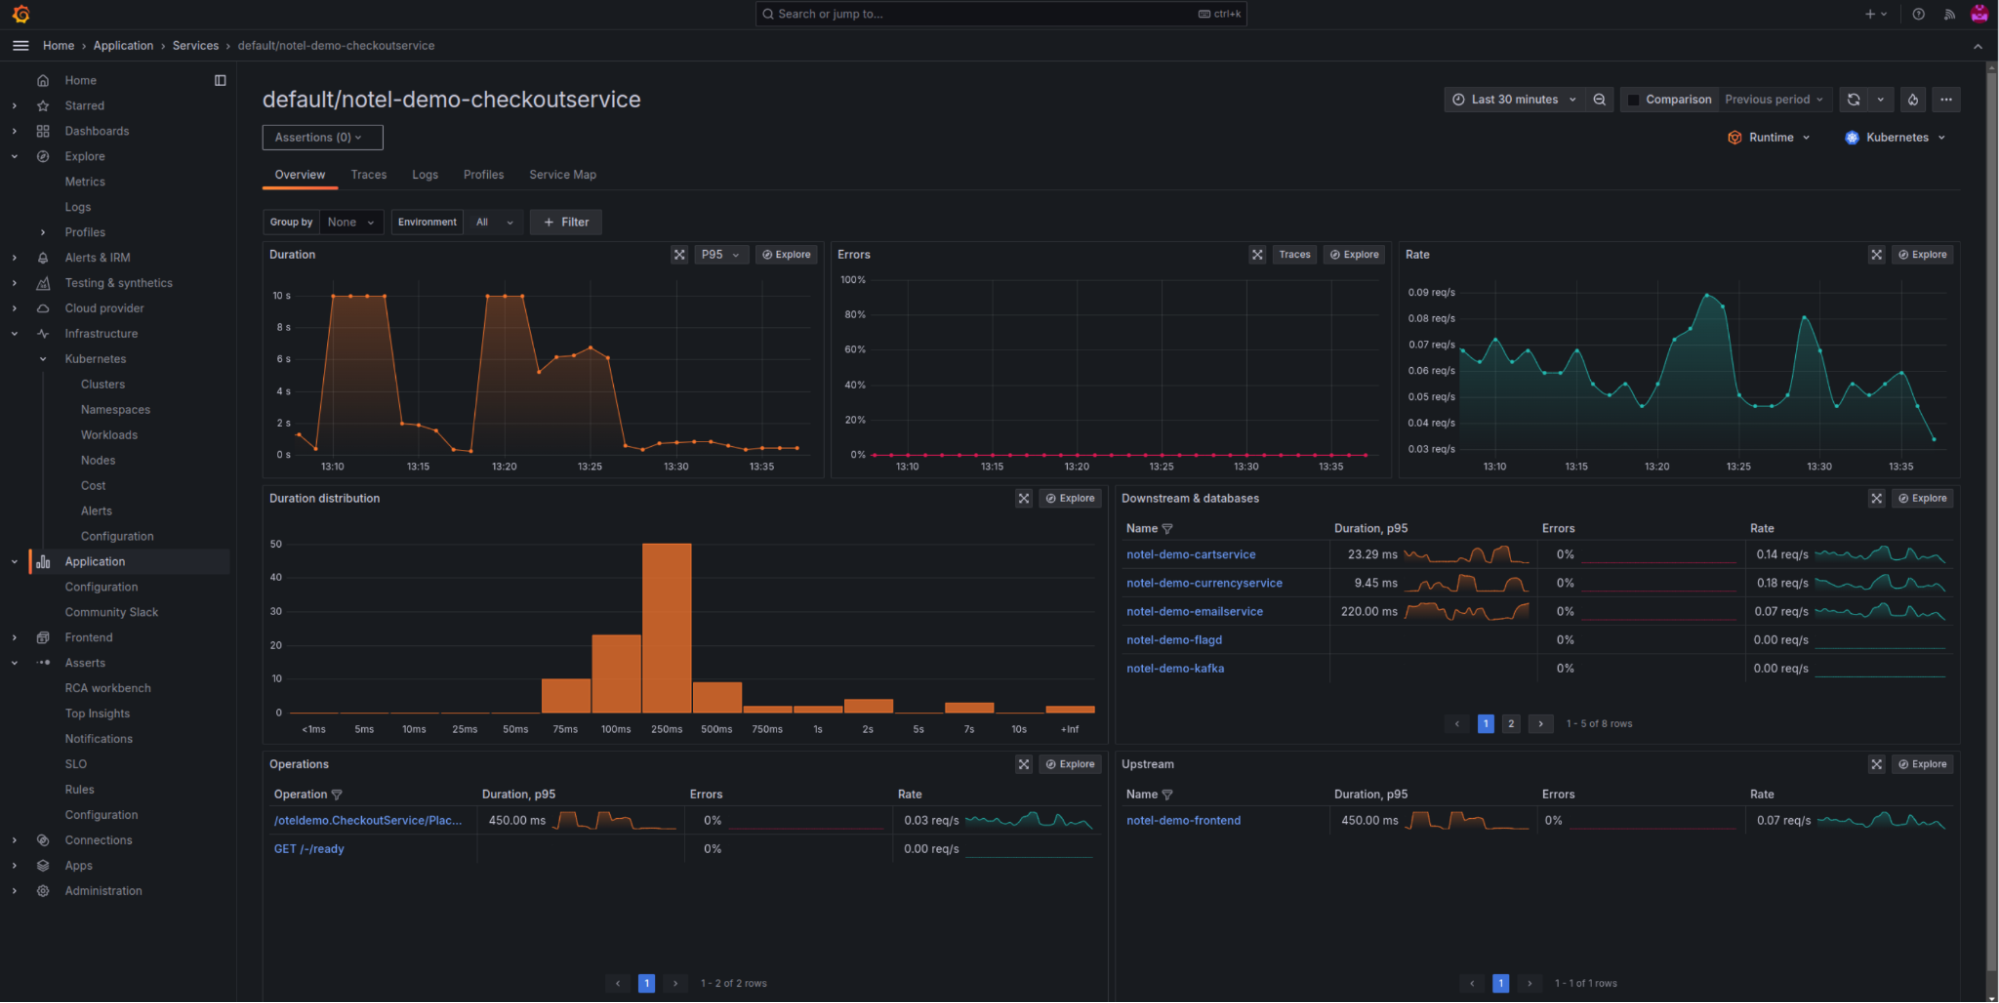
After all this effort, it was great to see the full OpenTelemetry Demo instrumented with a single Beyla daemonset deployment at ObservabilityCON 2024. A single Beyla instance produced service-level application metrics for all the different technologies and protocols used to implement the services in the OpenTelemetry Demo. We tested the OpenTelemetry Demo by stripping away all existing instrumentation code and monitoring services, while keeping the bare-bones, uninstrumented applications talking to each other.
Following up on this work, once we implement gRPC support for the new Beyla distributed traces context-propagation, we’ll be able to show service-level application metrics and full distributed traces in the OpenTelemetry Demo, all with a single Beyla instance.
Beyond Grafana Beyla 2.0
Leveraging the OpenTelemetry eBPF Profiler
We believe combining traces and profiles is the future of observability. Profiling delivers contextual stack traces that complement tracing, offering more precise insights than manually added spans ever could. After all, no matter how many trace points you add, there’s always one missing when it comes to pinpointing the root cause of a slow transaction. If we can correlate Beyla-generated TraceIDs with the OpenTelemetry profiler, we can overcome these challenges related to zero-code instrumentation and internal application insights.
Better support for the top five programming languages
Beyla’s strength has always been the ability to instrument applications written in any programming language. We don’t want to shift away from that focus. However, we do intend to add better language support for the top five programming languages (Java, .NET, NodeJS, Python, and Go) for web service developers. This will allow us to further enrich the insights Beyla is able to provide out of the box. For example, we are hoping to be able to provide basic JVM runtime metrics, without any JVM agents or logging enabled.
Beyla’s donation proposal to the OTel project
As you might already know, we’ve made a proposal to donate Beyla to the OpenTelemetry project. We’ll be sure to keep you updated there, and look forward to driving further innovation around zero-effort instrumentation through close collaboration with the OTel community.
Get started with Beyla
Ready to get started? Please check out our quickstart guides to learn how to instrument your first application with Grafana Beyla.
You can also engage with our community of users and developers by joining our Community Slack and dropping any questions or feedback in the #beyla channel.


