Grafana Tempo 2.7 release: new TraceQL metrics functions, operational improvements, and more!
Grafana Tempo 2.7 is here, and while the latest release is primarily focused on performance and operational improvements, we managed to sneak in some new TraceQL features, too!
Watch the video below to learn more about the TraceQL features, or continue reading to get a quick overview of the latest updates in Tempo. If you’re looking for something more in-depth, don’t hesitate to jump into the Grafana Tempo 2.7 release notes or the changelog.
TraceQL features
It wouldn’t be a Tempo release without at least a few new TraceQL features.
Instrumentation scope
OpenTelemetry includes some useful information at the instrumentation scope that was previously not queryable in TraceQL. The primary use of this scope is to query your trace data based on the various libraries and clients that are producing data.
{ resource.service.name = "foo" } | rate() by (instrumentation:name)This query, for example, will show you the various libraries producing instrumentation for a given service:

Metrics
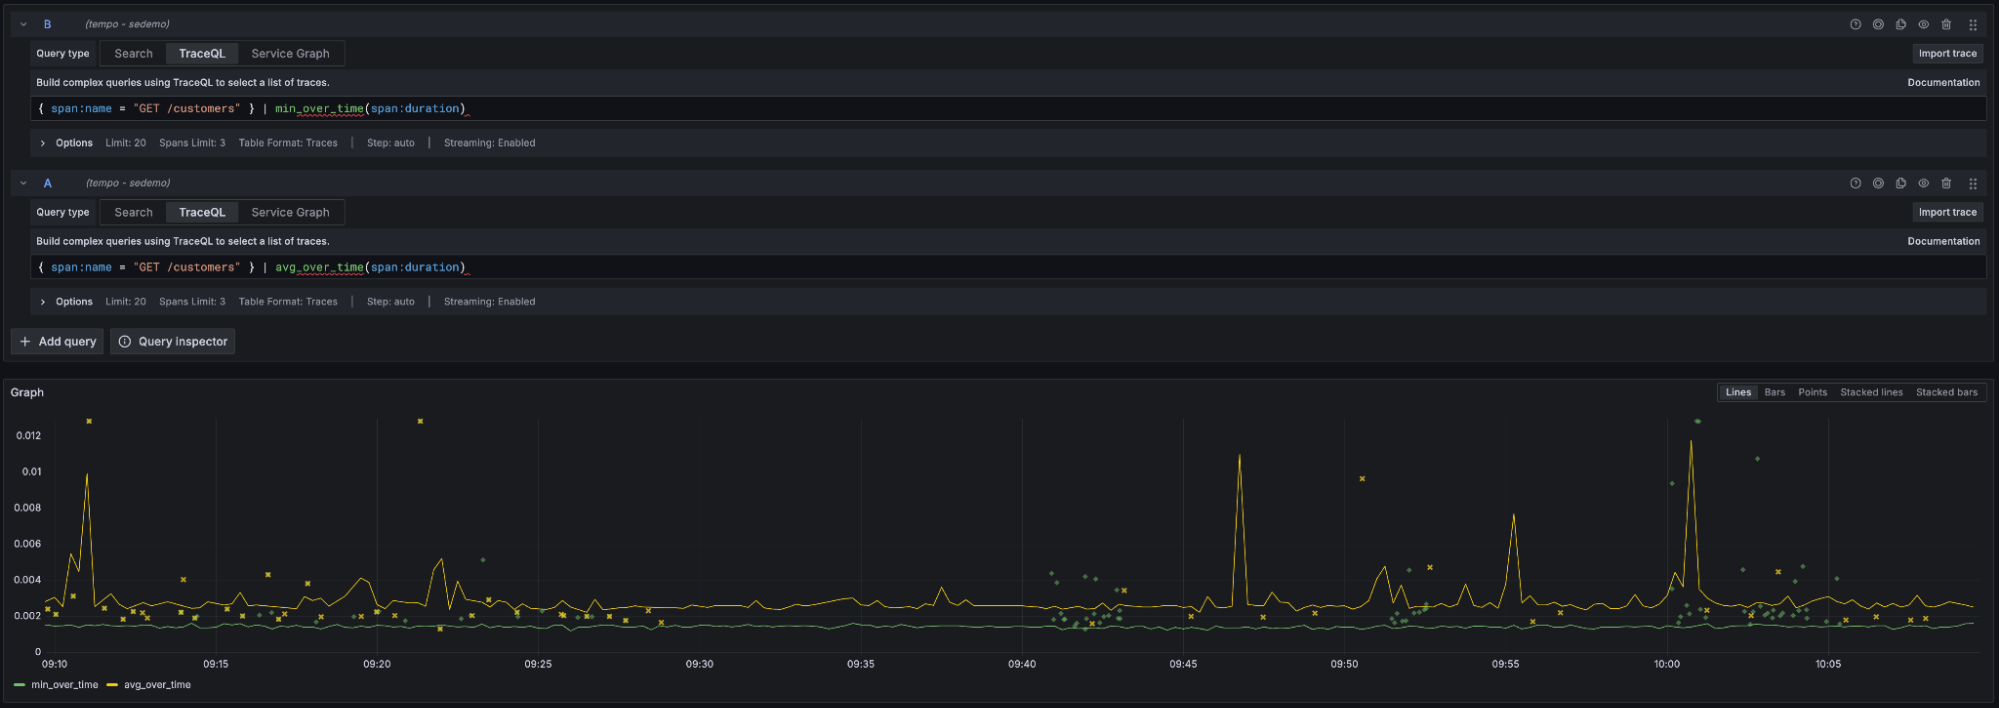
We’ve also added three new TraceQL metrics functions that you may find useful: avg_over_time, min_over_time, and max_over_time. These new functions do exactly what their names suggest!

avg_over_time and min_over_time on span duration.Performance improvements
We spent a lot of time improving performance and resource usage in the 2.7 release.
As Grafana Cloud Traces — the fully managed distributed tracing system powered by Grafana Tempo — has grown, we have felt some internal growing pains related to operating enormous Tempo clusters, and are working to reduce resource consumption. If you’re interested in the details, check out the PRs that are linked throughout this section. Otherwise, we hope you’ll simply enjoy a leaner and more performant Tempo.
Query frontend resources
Larger queries can sometimes create 10s or even 100s of thousands of jobs. In some cases, creating all these jobs came with the cost of allocating millions of objects. This release reflects a serious attempt to improve the performance of the frontend by reducing resource allocations in the following ways:
- Reduce unnecessary channel creation
- Reduce allocations due to repeated marshalling of dedicated columns
- Only pass needed headers to queriers
Ingester memory
The ingester contained very old code designed to reduce allocations by pooling byte slices used while unmarshalling proto on gRPC ingestion. This code was about four years old and was negatively impacting memory usage by massively over-allocating byte slices. We’ve seen 20-30% reduced go heap in ingesters in various clusters with the following updates:
- Prealloc adjustments to reduce memory usage
- Added two metrics to observe and three environment variables to control prealloc behavior

TraceQL performance
We are always looking to improve TraceQL performance. Tempo is a relatively young database and we expect continued improvements in this area for years to come. That said, here are few updates with 2.7:
- Dynamically reorder binary operators to favor faster operands
- Use Prometheus fast regular expression engine
- Improve performance of select() queries
Tag value lookup
Tag value lookups are currently performed exhaustively. In most cases, returns happen in a reasonable amount of time, but over larger datasets or with complicated conditions, they can take awhile. This release has a number of improvements to our various tag value lookups, including:
- Two improvements to the speed and resource usage of value collection
- Per-block disk caching of tag value lookups
- Two additional parameters to the tag values endpoint to allow them to exit early
Breaking changes
There are a few minor breaking changes in this release. I’ll highlight the three that are likely to impact you here, but for more details, please refer to the release notes and 2.7 upgrade guide.
An upgrade to our OpenTelemetry dependency is changing the way the distributors need to be configured. Previously, OTel defaulted to listening on 0.0.0.0, but this was deemed a security risk. Now OTel listens on localhost by default. If you are configuring Tempo manually and relying on this behavior to ingest traces, you will likely need to update your config. Full details are in the release notes linked above.
In addition, we have moved to using the Prometheus fast regular expression matcher. This means that Tempo regular expressions will now be fully anchored. Previously, { span.foo ~= "bar" } was a substring search, but now it is an exact match. This change not only enhances performance, but makes TraceQL’s regex behavior consistent with Grafana Loki, Grafana Mimir, and Prometheus, which we feel has some worthwhile benefits.
Finally, we are turning off gRPC compression between components because we are seeing nice performance improvements in distributors, queriers, and query frontends. If you would like to re-enable, we recommend using snappy. Please see the release notes for details.
Hopefully these changes will not be too disruptive! One is a nice performance improvement and the other addresses a security concern, so we believe they are worth it, but are always open to feedback.
What’s next in Grafana Tempo?
Our new RF1 rearchitecture is currently running in our development clusters. We’re cleaning up the bugs and preparing to move it into our staging and production clusters next. As soon as we get this change into a stable spot, we will prepare a big release with a lot of details about how to upgrade. Expect TraceQL performance improvements and massively reduced TCO!
If you are interested in hearing more about Grafana Tempo news or search progress, please join us on the Grafana Labs Community Slack channel #tempo, post a question in our community forums, reach out on X (formerly Twitter), or join our monthly Tempo community call. See you there!
And if you want to get even closer to where the magic happens, why not have a look at our open positions at Grafana Labs?
The easiest way to get started with Grafana Tempo is with Grafana Cloud, and our free forever tier now includes 50GB of traces along with 50GB of logs and 10K series of metrics. Sign up today for free!


