Grafana Alerting: Save time and effort with Grafana-managed recording rules
Grafana Alerting has seen steady growth and adoption since it was revamped in Grafana 9. Since then, we’ve been busy making your alerts more robust, more reliable, and easier to manage.
As part of that process, Grafana Alerting has adopted several concepts from Prometheus. The Prometheus alerting model is well understood and flexible, and with Grafana Alerting we want to bring that same flexibility to all Grafana data sources.
That’s why we’re excited to tell you about Grafana-managed recording rules, a powerful new tool in Grafana Alerting — added in Grafana 11.3 — that can save you time and effort in setting up and managing incident response.
What is a recording rule?
Do you have any expensive or slow data source queries? Are you tired of embedding the same slow query in all your dashboards, and having to wait for the same query to run over and over every time you open the page?
You can use recording rules to help solve this problem. To quote the Prometheus docs, “Recording rules allow you to precompute frequently needed or computationally expensive expressions and save their result as a new set of time series.”
With recording rules, you can tell Grafana to execute any data source query in the background, and save the results in a designated Prometheus time-series database.
By building on the powerful Grafana Alerting rules engine, the results will be automatically kept up-to-date in the background for you. Then, you can update your dashboards and alert rules to quickly query that saved series instead, deduplicating your slow and expensive queries and speeding up your dashboards.
What else can I do with recording rules?
In addition to the benefits outlined above, there are other things you can do with Grafana-managed recording rules:
- Reduce your cloud costs. If you are using a data source that charges by the query, you can use recording rules to reduce the cost of running Grafana as a whole. By recording your most expensive queries into Prometheus, you can reduce the number of times that Grafana is hitting the data source, letting you build many dashboards for the same data while only paying for the queries once. This helps keep your observability costs low while writing as many dashboards as you like.
- Query multiple data sources and combine the results with expressions. If you need to combine two disparate sources of information, you can mix data source queries in the same rule, the same way you would in a dashboard panel. You can then write the combined result into Prometheus for quick access later.
- Try Prometheus without committing to a full migration. If you aren’t sure where to start with Prometheus, Grafana-managed recording rules support reads from any data source supported by Grafana Alerting and saves the results in Prometheus. You can use this to ETL a subset of your data and test out Prometheus-driven dashboards or start learning PromQL on your real data. We hope this feature improves the onboarding experience for existing Grafana users who are interested in changing where their data is stored.
How do I get started?
To keep operations light, Grafana does not ship with an embedded time-series database. You’ll need to set up your own Prometheus-compatible database, such as Grafana Mimir, to store the results of recording rule evaluations.
You can start by enabling the grafanaManagedRecordingRules feature toggle.
For now, recording rules only support a single target. Enable the feature, and provide your target credentials in Grafana’s config.ini:
[recording_rules]

enabled = true

url = http://my-example-prometheus.local:9090/api/prom/push

basic_auth_username = my-user

basic_auth_password = my-pass

[recording_rules.custom_headers]

X-My-Header = MyValue
Then, you can create a recording rule from the Alerting UI, against any alerting-compatible datasource.
Much like alert rules, your data needs to be collapsed to look like a Prometheus instant query. You can easily accomplish this by adding a Reduce expression in front of most data source queries. This should be familiar to most Grafana Alerting users.
When dealing with more complex expressions involving multiple queries, you can mark which expression you want to record by clicking Set as recording rule output in the query builder.
Recording rules are modeled as an extension of existing Grafana alert rules. That means you can view, search, and manage them in exactly the same way you would alert rules.
Grafana rule groups and folders can contain a mixture of alerting and recording rules. If you define your alerts as code, recording rules are supported in all the same provisioning systems and APIs that you’re already using.
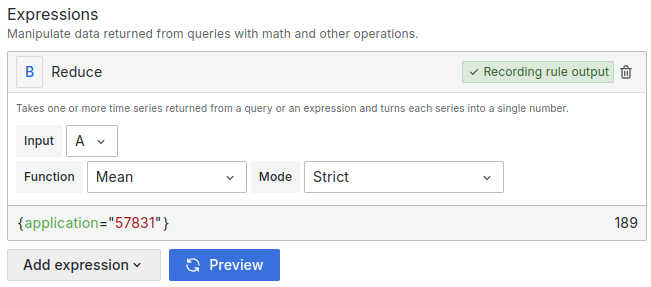
In the screenshot below, you can see a single expression that is already selected as the rule output:

And here, the left expression is showing the Set as recording rule output action link:

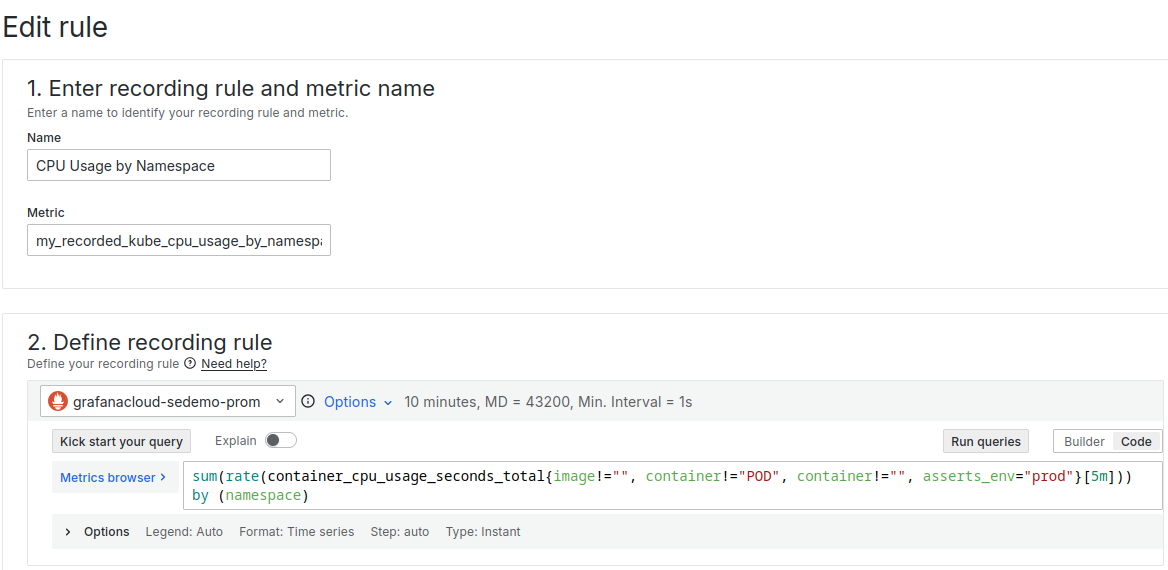
Let’s say we often want to visualize the CPU usage of several Kubernetes pods, broken down by namespace. If we make the same query in several dashboards, it makes sense to record it:

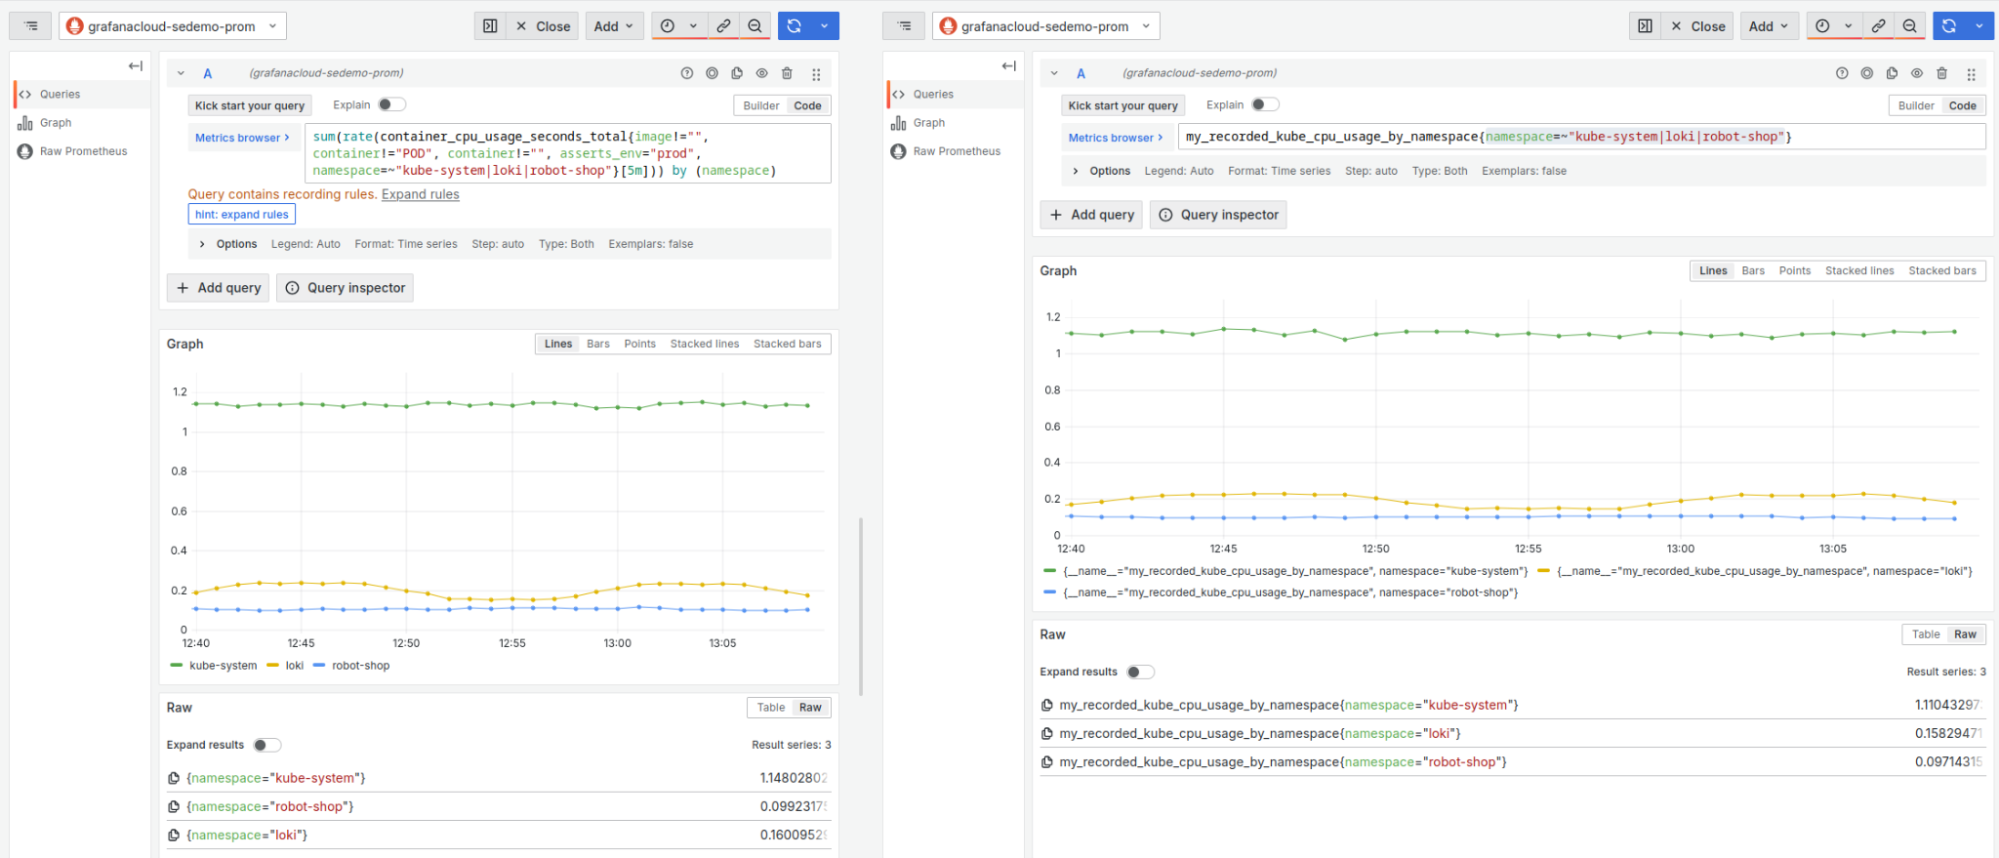
Then, we can reference that data with my_recorded_kube_cpu_usage_by_namespace. Here’s what the underlying query looks like next to the recorded series:

You can see the recorded data following the queried data very closely. The recording rule saved every dimension from the original query — like with Alerting rules, you can query many series with just one rule.
Note how the recorded series also inherits the labels from the original query. This means you can still correlate and filter your recorded data, the same way you did before! Also notice how the same label matcher works for both the original and recorded series: namespace=~"kube-system|loki|robot-shop".
Recorded data often has a “sampling lag” when directly superimposed onto the original query. This is because the recording rule runs once a minute, which may not line up perfectly with the time that you issued the query from the browser. This is especially common for data with high variance. To reduce sampling lag, try increasing the evaluation interval of your recording rule.
What about enterprise recorded queries?
For Grafana Enterprise users, some of this might sound somewhat familiar, as there is an enterprise recorded query (ERQ) feature that can record a limited set of queries. However, Grafana-managed recording rules offer several benefits over ERQs:
- They are open source and available to all Grafana users.
- They fully integrate with the Grafana Alerting engine, meaning they can be managed and operated more easily, and configured in the Grafana Alerting UI.
- They can be mixed and managed alongside Grafana Alert rules.
- They can be provisioned as-code using the same provisioning mechanisms for Grafana Alerting.
- Access can be controlled via RBAC.
- They work on both single-host and highly available (HA) Grafana deployments.
For now, we plan to leave ERQs as they are, but we hope you try out Grafana-managed recording rules as an alternative. We plan to bring the remaining benefits of ERQs to recording rules in the future, including a per-rule configurable Prometheus target and ease of creation from a dashboard.
Eventually, we hope that Grafana-managed recording rules become a superset of ERQs, at which point we want to build an automated migration path between the two, leading to the eventual deprecation of ERQs. Currently, we have no planned date for this.
What’s next for recording rules?
In the future, we hope to bring several improvements to this powerful new functionality:
- Per-rule configurable target data sources, allowing you to use many Prometheus targets at once and manage them via the Grafana UI as data sources rather than config settings.
- Sequential evaluation of rules in rule groups, allowing you to deterministically mix recording rules and alert rules with strong consistency, and bringing even tighter alignment with Prometheus rules.
In addition, bringing this feature under the Grafana Alerting umbrella means that recording rules uptake many of the improvements you already enjoy from Grafana Alerting.
Learn more about Grafana Alerting
If you’d like to learn more, check out our Grafana Alerting documentation or watch this talk on the evolution of Grafana Alerting from GrafanaCON 2024.
And if you’d like to provide feedback on the new recording rules, or if you’d just like to request a new feature for Grafana Alerting in general, please let us know! You can do this by opening an issue in the Grafana GitHub repository, or by asking in the#alerting channel in the Grafana Labs Community Slack.
Grafana Cloud is the easiest way to get started with metrics, logs, traces, and dashboards. We have a generous free forever tier and plans for every use case. Sign up for free now!


