
Exploring OpenTelemetry Collector configurations in Grafana Cloud: a tasting menu approach
I’m a big fan of tasting menus. In the culinary world they let us sample a variety of dishes in small portions, helping us understand and appreciate different flavors and options.
Inspired by this concept and a talk I gave earlier this year, I have crafted a “tasting menu” of OpenTelemetry Collector configurations in Grafana Cloud. This blog post presents four distinct recipes, complete with code snippets and a GitHub repository for full examples and usage instructions, are each designed to introduce you to different aspects of telemetry data collection and management.
Those recipes are part of a cookbook I keep on GitHub. So whether you are just starting with OpenTelemetry or looking to optimize your existing setup, these configurations will help you appreciate a good range of capabilities the OpenTelemetry Collector offers. So, as we say in Portuguese, bom apetite!
Internal telemetry salad
We start with a light yet informative configuration that involves sending the Collector’s own internal telemetry data to external storage. This dish will help you understand how to extract and read internal telemetry data from the Collector, including metrics and traces.
In this configuration, we create one pipeline for each signal type and use the same receiver and exporter for all of them. However, we need to use the debug exporter, as we are not interested in the telemetry that comes to the Collector; we are interested in the telemetry that is generated by the Collector.
Under service::telemetry, we configure how to send the internal traces and metrics to an external OpenTelemetry protocol (OTLP) endpoint. In this case, we are using the OTLP endpoint for a Grafana Cloud instance, obtained from the “OpenTelemetry Configuration” page, which can be found on your “Manage your stack” page.
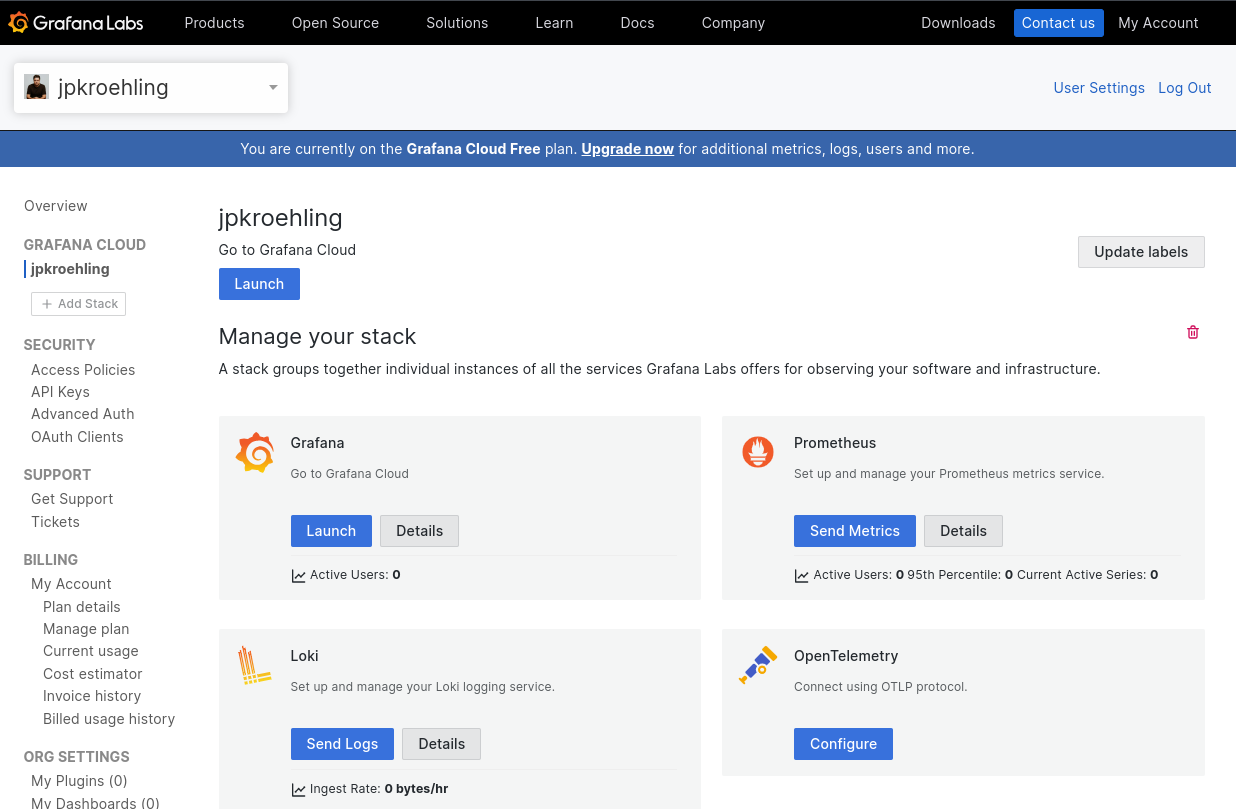
Also on that page, we can look at the environment variable OTEL_EXPORTER_OTLP_HEADERS that is shown after generating a token. Keep this handy, as we’ll need the value of the Authorization header later.

Ingredients
- An OpenTelemetry Collector distribution that is able to ingest OTLP data via gRPC, and export data with the debug exporter. I used OTel Collector Contrib v0.113.0 for this blog post.
- An application that can generate OTLP data, such as telemetrygen
- A configuration file with the
service::telemetrysection properly configured
Configuration example
receivers:
  otlp:
    protocols:
      http:
      grpc:

exporters:
  debug:

service:
  pipelines:
    traces:
      receivers: [otlp]
      exporters: [debug]
    metrics:
      receivers: [otlp]
      exporters: [debug]
    logs:
      receivers: [otlp]
      exporters: [debug]
  telemetry:
    traces:
      processors:
        - batch:
            schedule_delay: 1000
            exporter:
              otlp:
                endpoint: https://otlp-gateway-prod-eu-west-2.grafana.net/otlp/v1/traces
                protocol: http/protobuf
                headers:
                  Authorization: "Basic ..."
    metrics:
      level: detailed
      readers:
        - periodic:
            exporter:
              otlp:
                endpoint: https://otlp-gateway-prod-eu-west-2.grafana.net/otlp/v1/metrics
                protocol: http/protobuf
                headers:
                  Authorization: "Basic ..."
    resource:
      "service.name": "otelcol-own-telemetry"
Preparation
- Change the configuration file to include the correct value for the
Basicauthentication header and endpoint - Run the OpenTelemetry Collector:
otelcol-contrib --config ./otelcol.yaml- Send some telemetry to the Collector. By default, each trace reported by
telemetrygencomes with two spans. Note that this telemetry will be discarded with the configuration provided, but the actions the Collector performed will be recorded:
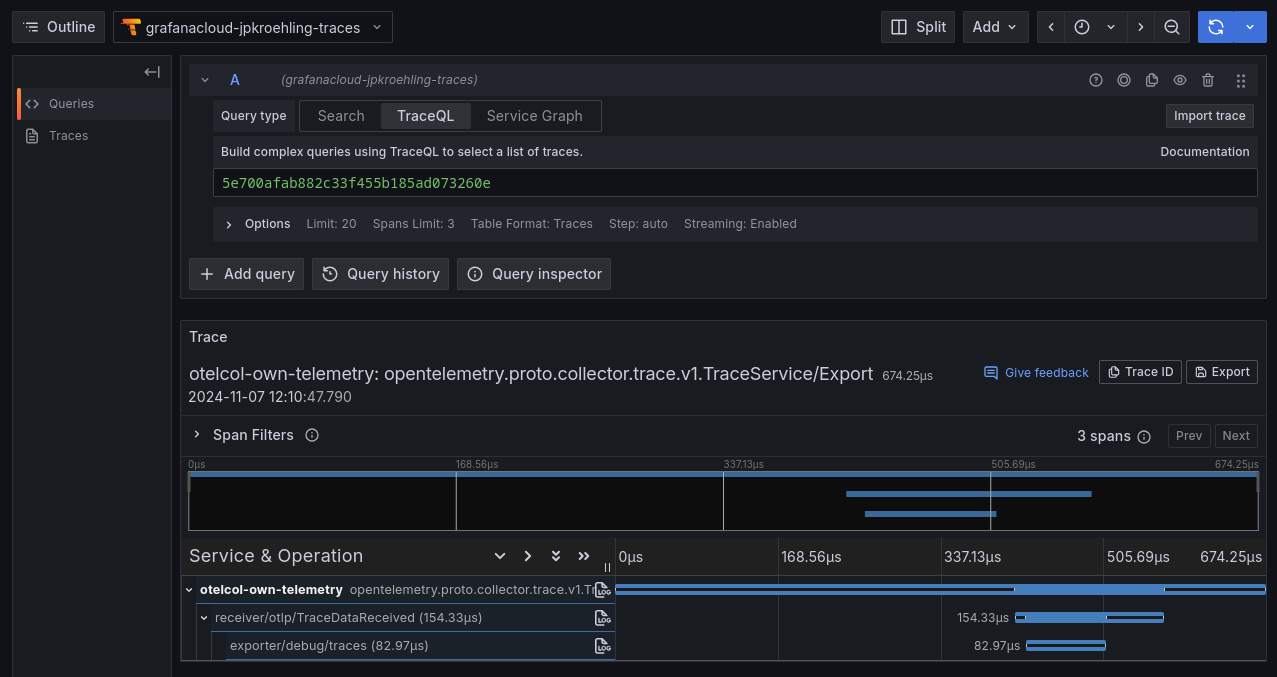
telemetrygen traces --traces 1 --otlp-insecure --otlp-attributes='cookbook="own-telemetry"'- On Grafana Cloud, select the traces data source and you’ll be able to find a trace that represents the Collector processing of the
telemetrygencall:
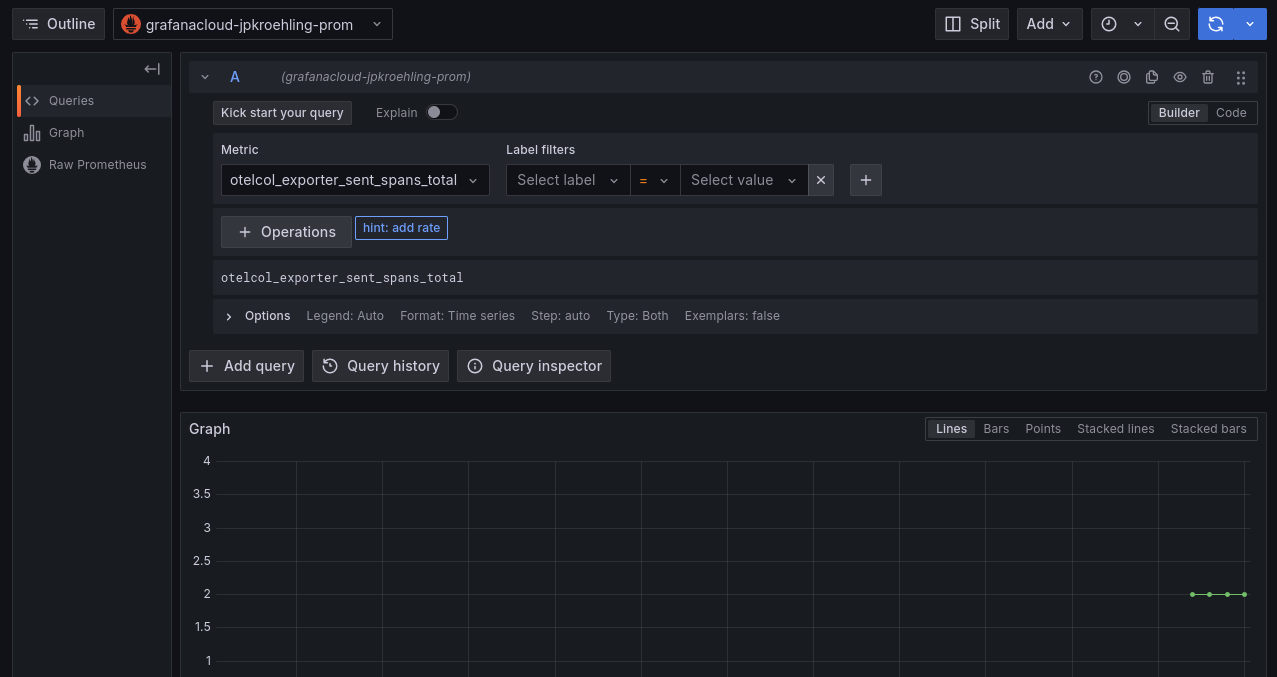
- Now, change to your metrics data source, and select the metric
otelcol_exporter_sent_spans_total. We can see that our Collector reported that it received the two spans.
Tasting notes
We’ve now seen that we can observe the Collector to understand what it is doing—we have easy access to its metrics and traces. But what about the logs?
For the moment, the logs are available only on the console and should be captured separately. Avoid the temptation to use a file log receiver to read the instance’s own log. It might cause an endless loop of events and violates the principle that software should NOT monitor itself.
Mixed events and metrics
Our first main course features a ratatouille of events and metrics from a Kubernetes cluster. The Collector is provisioned by the OpenTelemetry Operator, running in a Kubernetes cluster in “deployment” mode, and adheres to the Single Writer Principle.
Ingredients
- A Kubernetes cluster, such as one provisioned locally via k3d
- The OpenTelemetry Operator running in the cluster
- Your Grafana Cloud credentials in a Kubernetes secret
- A Collector configuration using the
k8s_clusterandk8s_eventsreceivers - A workload that would generate a few Kubernetes events
kubensfrom thekubectxproject
Configuration example
 extensions:
      basicauth:
        client_auth:
          username: "${env:GRAFANA_CLOUD_USER}"
          password: "${env:GRAFANA_CLOUD_TOKEN}"
    receivers:
      k8s_events: {}
      k8s_cluster:
        collection_interval: 15s
    exporters:
      otlphttp:
        endpoint: https://otlp-gateway-prod-eu-west-2.grafana.net/otlp
        auth:
          authenticator: basicauth

    service:
      extensions: [ basicauth ]
      pipelines:
        metrics:
          receivers: [ k8s_cluster ]
          exporters: [ otlphttp    ]
        logs:
          receivers: [ k8s_events ]
          exporters: [ otlphttp   ]
Preparation
- Make sure you have a running Kubernetes cluster and OpenTelemetry Operator configured, and that you have your context set to the
observabilitynamespace. If you don’t know how to start, you can try these commands for a local setup:
k3d cluster create

kubectl apply -f https://github.com/cert-manager/cert-manager/releases/latest/download/cert-manager.yaml
kubectl wait --for=condition=Available deployments/cert-manager -n cert-manager

kubectl apply -f https://github.com/open-telemetry/opentelemetry-operator/releases/latest/download/opentelemetry-operator.yaml
kubectl wait --for=condition=Available deployments/opentelemetry-operator-controller-manager -n opentelemetry-operator-system

kubectl create namespace observability
kubens observability- Create a secret with your Grafana Cloud credentials. In this example, we have them already set as env vars; replace them appropriately.
kubectl create secret generic grafana-cloud-credentials \
--from-literal=GRAFANA_CLOUD_USER="$GRAFANA_CLOUD_USER" \
--from-literal=GRAFANA_CLOUD_TOKEN="$GRAFANA_CLOUD_TOKEN"- We’ll now create a
ClusterRolefor our Collector:
apiVersion: rbac.authorization.k8s.io/v1
kind: ClusterRole
metadata:
  name: otelcol
rules:
- apiGroups:
  - ""
  resources:
  - events
  - namespaces
  - namespaces/status
  - nodes
  - nodes/spec
  - pods
  - pods/status
  - replicationcontrollers
  - replicationcontrollers/status
  - resourcequotas
  - services
  verbs:
  - get
  - list
  - watch
- apiGroups:
  - apps
  resources:
  - daemonsets
  - deployments
  - replicasets
  - statefulsets
  verbs:
  - get
  - list
  - watch
- apiGroups:
  - extensions
  resources:
  - daemonsets
  - deployments
  - replicasets
  verbs:
  - get
  - list
  - watch
- apiGroups:
  - batch
  resources:
  - jobs
  - cronjobs
  verbs:
  - get
  - list
  - watch
- apiGroups:
    - autoscaling
  resources:
    - horizontalpodautoscalers
  verbs:
    - get
    - list
- watch- We’ll create a
ServiceAccountthat will be used by our Collector instance, and we’ll bind the cluster role to the account:
apiVersion: v1
kind: ServiceAccount
metadata:
  name: otelcol-k8s
  namespace: observability
---
apiVersion: rbac.authorization.k8s.io/v1
kind: ClusterRoleBinding
metadata:
  name: otelcol
roleRef:
  apiGroup: rbac.authorization.k8s.io
  kind: ClusterRole
  name: otelcol
subjects:
- kind: ServiceAccount
  name: otelcol-k8s
namespace: observability- We’ll now configure our Collector to obtain metrics and events (as logs) from the Kubernetes cluster.
apiVersion: opentelemetry.io/v1beta1
kind: OpenTelemetryCollector
metadata:
  name: otelcol-k8s
  namespace: observability
spec:
  image: ghcr.io/open-telemetry/opentelemetry-collector-releases/opentelemetry-collector-contrib:0.113.0
  serviceAccount: otelcol-k8s
  envFrom:
    - secretRef:
        name: grafana-cloud-credentials
  config:
    extensions:
      basicauth:
        client_auth:
          username: "${env:GRAFANA_CLOUD_USER}"
          password: "${env:GRAFANA_CLOUD_TOKEN}"
    receivers:
      k8s_events: {}
      k8s_cluster:
        collection_interval: 15s
    exporters:
      otlphttp:
        endpoint: https://otlp-gateway-prod-eu-west-2.grafana.net/otlp
        auth:
          authenticator: basicauth

    service:
      extensions: [ basicauth ]
      pipelines:
        metrics:
          receivers: [ k8s_cluster ]
          exporters: [ otlphttp    ]
        logs:
          receivers: [ k8s_events ]
exporters: [ otlphttp ]- If you don’t have a workload running in your Kubernetes cluster, this one should be enough to generate a few events.
apiVersion: apps/v1
kind: Deployment
metadata:
  name: nginx-deployment
spec:
  selector:
    matchLabels:
      app: nginx
  template:
    metadata:
      labels:
        app: nginx
    spec:
      containers:
      - name: nginx
        image: nginx:1.27.2
        ports:
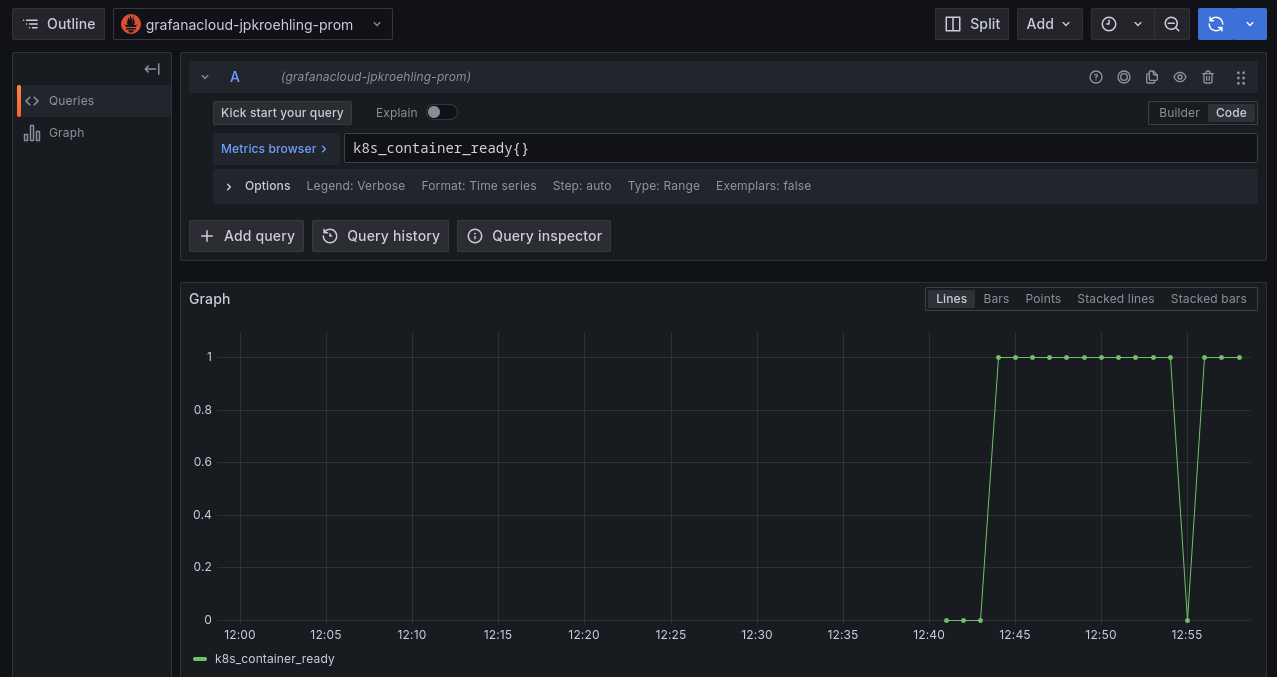
- containerPort: 80- At this point, you should have received a few events in your Grafana Cloud instance.
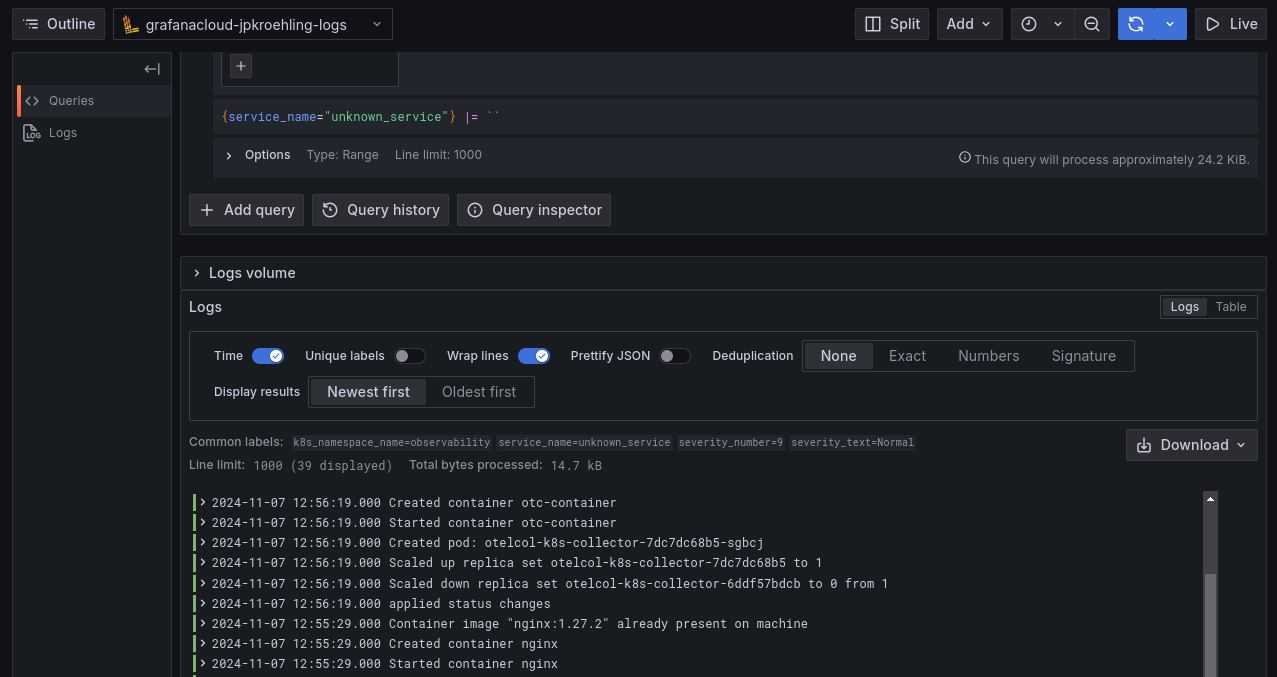
- Kubernetes metrics, such as
k8s_container_ready, should also be available.
Tasting notes
We just had a small taste of what those components can do, and this left us with enough information to explore this idea further: which metrics could be interesting for us to watch? How can we combine metrics to tell a story? That’s where we can go from here.
Bibimbap of logs
The second main course explores a Collector configured in “daemonset” mode to collect an assortment of logs from pods running on the same node, potentially following different formats and from various namespaces. This configuration emphasizes placing the Collector close to the telemetry source.
Ingredients
- A Kubernetes cluster, like in the previous recipe
- The OpenTelemetry Operator running in the cluster
- Your Grafana Cloud credentials in a Kubernetes secret
- A Collector configuration using the
filelogreceiver - A workload that would generate a few Kubernetes events
Configuration example
 extensions:
      basicauth:
        client_auth:
          username: "${env:GRAFANA_CLOUD_USER}"
          password: "${env:GRAFANA_CLOUD_TOKEN}"
    receivers:
      filelog:
        exclude: []
        include:
          - /var/log/pods/*/*/*.log
        include_file_name: false
        include_file_path: true
        operators:
          - id: container-parser
            max_log_size: 102400
            type: container
        retry_on_failure:
          enabled: true
        start_at: end
    exporters:
      otlphttp:
        endpoint: https://otlp-gateway-prod-eu-west-2.grafana.net/otlp
        auth:
          authenticator: basicauth

    service:
      extensions: [ basicauth ]
      pipelines:
        logs:
          receivers: [ filelog  ]
          exporters: [ otlphttp ]
Preparation
- Make sure you have a Kubernetes cluster and an OTel Operator running. Feel free to reuse the one you configured in the previous recipe.
- Next, create a custom resource with the following configuration.
apiVersion: opentelemetry.io/v1beta1
kind: OpenTelemetryCollector
metadata:
  name: otelcol-podslogs
  namespace: observability
spec:
  image: ghcr.io/open-telemetry/opentelemetry-collector-releases/opentelemetry-collector-contrib:0.113.0
  mode: daemonset
  envFrom:
    - secretRef:
        name: grafana-cloud-credentials
  volumes:
    - name: varlogpods
      hostPath:
        path: /var/log/pods
  volumeMounts:
    - name: varlogpods
      mountPath: /var/log/pods
      readOnly: true
  config:
    extensions:
      basicauth:
        client_auth:
          username: "${env:GRAFANA_CLOUD_USER}"
          password: "${env:GRAFANA_CLOUD_TOKEN}"
    receivers:
      filelog:
        exclude: []
        include:
          - /var/log/pods/*/*/*.log
        include_file_name: false
        include_file_path: true
        operators:
          - id: container-parser
            max_log_size: 102400
            type: container
        retry_on_failure:
          enabled: true
        start_at: end
    exporters:
      otlphttp:
        endpoint: https://otlp-gateway-prod-eu-west-2.grafana.net/otlp
        auth:
          authenticator: basicauth

    service:
      extensions: [ basicauth ]
      pipelines:
        logs:
          receivers: [ filelog  ]
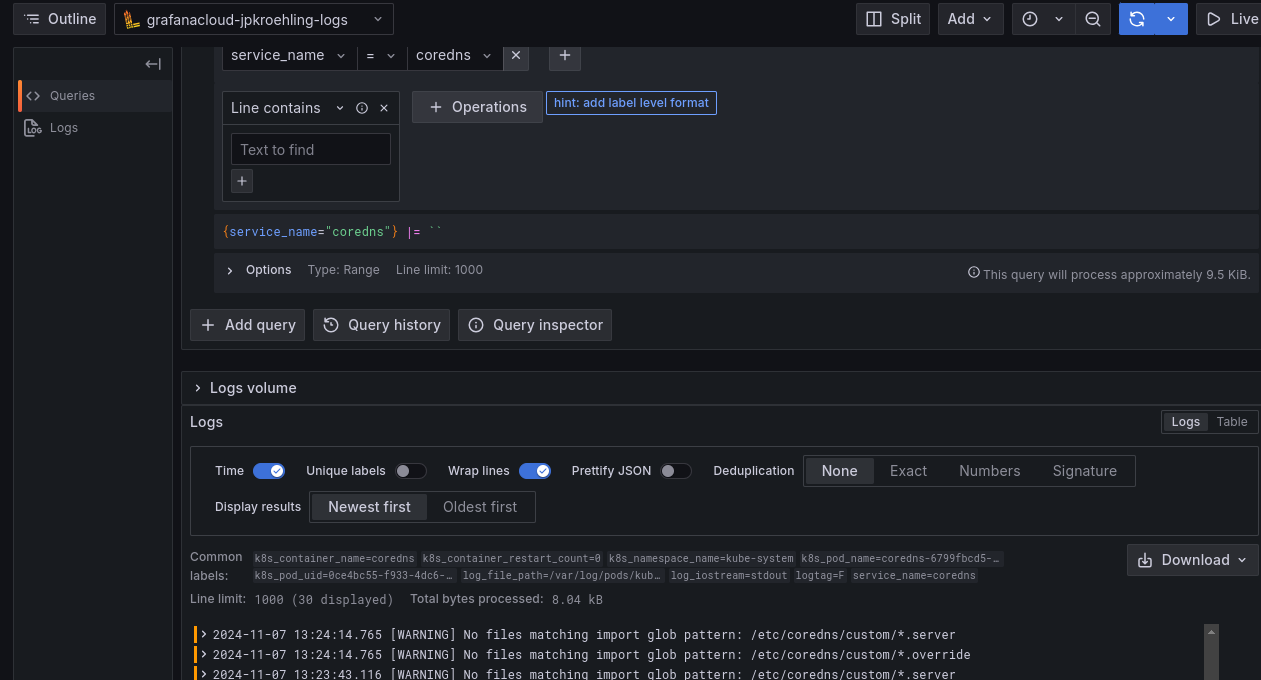
exporters: [ otlphttp ]- After a few moments, you should start seeing logs from the containers in the cluster.
Tasting notes
Logs are umami-rich telemetry data points, exploring all possible tastes we can have: workload- or infra-related, from debug to critical, structured or unstructured. At this point, we’ve covered enough to get you longing for more. And now you’re read to ask: Which rules can you add to your configuration to enrich the metadata better?
Kafka buffer with two Collector layers
For dessert, we present a sophisticated configuration involving a Kafka buffer with two layers of Collectors—appreciated in highly scalable scenarios for its ability to handle a spike in telemetry volume without stressing the backend or affecting the ingestion layer.
The first layer collects telemetry from business services running in Kubernetes and publishes it to a Kafka topic. The second layer consumes these events and sends them to the telemetry storage.
Ingredients
- A Kubernetes cluster, like in the previous recipe
- The OpenTelemetry Operator running in the cluster
- Your Grafana Cloud credentials in a Kubernetes secret
- A Kafka cluster and one topic for each telemetry data type (metric, logs, traces)
- The
telemetrygentool, or any other application that is able to send OTLP data to our collector - Two Collectors, one configured to publish data to the topic, and one consuming the events
Configuration examples
Publisher
This is the configuration we’ll use for the otelcol-pub Collector, responsible for publishing to the queue:
 receivers:
      otlp:
        protocols:
          http: {}
          grpc: {}

    processors:
      transform:
        error_mode: ignore
        trace_statements:
          - context: span
            statements:
              - set(attributes["published_at"], UnixMilli(Now()))

    exporters:
      kafka:
        protocol_version: 2.0.0
        brokers: kafka-for-otelcol-kafka-brokers.kafka.svc.cluster.local:9092
        topic: otlp-spans

    service:
      pipelines:
        traces:
          receivers:  [ otlp ]
          processors: [ transform ]
          exporters:  [ kafka ]
Consumer
This is the configuration we’ll use for the otelcol-sub Collector, responsible for reading from the queue and writing to our Grafana Cloud instance:
extensions:
      basicauth:
        client_auth:
          username: "${env:GRAFANA_CLOUD_USER}"
          password: "${env:GRAFANA_CLOUD_TOKEN}"

    receivers:
      kafka:
        protocol_version: 2.0.0
        brokers: kafka-for-otelcol-kafka-brokers.kafka.svc.cluster.local:9092
        topic: otlp-spans

    processors:
      transform:
        error_mode: ignore
        trace_statements:
          - context: span
            statements:
              - set(attributes["consumed_at"], UnixMilli(Now()))

    exporters:
      otlphttp:
        endpoint: https://otlp-gateway-prod-eu-west-2.grafana.net/otlp
        auth:
          authenticator: basicauth

    service:
      extensions: [ basicauth ]
      pipelines:
        traces:
          receivers:  [ kafka ]
          processors: [ transform ]
          exporters:  [ otlphttp ]
Preparation
- Install Strimzi, a Kubernetes Operator for Kafka.
kubectl create ns kafka
kubens kafka

kubectl create -f 'https://strimzi.io/install/latest?namespace=kafka'
kubectl wait --for=condition=Available deployments/strimzi-cluster-operator --timeout=300s- Install the Kafka cluster and topics for our recipe.
apiVersion: kafka.strimzi.io/v1beta2
kind: KafkaNodePool
metadata:
  name: dual-role
  labels:
    strimzi.io/cluster: kafka-for-otelcol
spec:
  replicas: 1
  roles:
    - controller
    - broker
  storage:
    type: jbod
    volumes:
      - id: 0
        type: persistent-claim
        size: 100Gi
        deleteClaim: false
        kraftMetadata: shared
---
apiVersion: kafka.strimzi.io/v1beta2
kind: Kafka
metadata:
  name: kafka-for-otelcol
  annotations:
    strimzi.io/node-pools: enabled
    strimzi.io/kraft: enabled
spec:
  kafka:
    version: 3.7.0
    metadataVersion: 3.7-IV4
    config:
      offsets.topic.replication.factor: 1
      transaction.state.log.replication.factor: 1
      transaction.state.log.min.isr: 1
      default.replication.factor: 1
      min.insync.replicas: 1
    listeners:
      - name: plain
        port: 9092
        type: internal
        tls: false
---
apiVersion: kafka.strimzi.io/v1beta2
kind: KafkaTopic
metadata:
  name: otlp-spans
  labels:
    strimzi.io/cluster: kafka-for-otelcol
---
apiVersion: kafka.strimzi.io/v1beta2
kind: KafkaTopic
metadata:
  name: otlp-metrics
  labels:
    strimzi.io/cluster: kafka-for-otelcol
---
apiVersion: kafka.strimzi.io/v1beta2
kind: KafkaTopic
metadata:
  name: otlp-logs
  labels:
strimzi.io/cluster: kafka-for-otelcol- It might take a while for the topics to be ready. Watch the status of the following custom resource before proceeding:
kafka/kafka-for-otelcol. Once it’s marked asReady, continue with the next step. - Go back to the
observabilitynamespace.
kubens observability- Create the Collector that will receive data from the workloads and publish to the topic
apiVersion: opentelemetry.io/v1beta1
kind: OpenTelemetryCollector
metadata:
  name: otelcol-pub
spec:
  image: ghcr.io/open-telemetry/opentelemetry-collector-releases/opentelemetry-collector-contrib:0.113.0
  config:
    receivers:
      otlp:
        protocols:
          http: {}
          grpc: {}

    processors:
      transform:
        error_mode: ignore
        trace_statements:
          - context: span
            statements:
              - set(attributes["published_at"], UnixMilli(Now()))

    exporters:
      kafka:
        protocol_version: 2.0.0
        brokers: kafka-for-otelcol-kafka-brokers.kafka.svc.cluster.local:9092
        topic: otlp-spans

    service:
      pipelines:
        traces:
          receivers:  [ otlp ]
          processors: [ transform ]
exporters: [ kafka ]- And now, the Collector
otelcol-subreceives the data from the topic and sends it to Grafana Cloud.
apiVersion: opentelemetry.io/v1beta1
kind: OpenTelemetryCollector
metadata:
  name: otelcol-sub
spec:
  image: ghcr.io/open-telemetry/opentelemetry-collector-releases/opentelemetry-collector-contrib:0.113.0
  envFrom:
  - secretRef:
      name: grafana-cloud-credentials
  config:
    extensions:
      basicauth:
        client_auth:
          username: "${env:GRAFANA_CLOUD_USER}"
          password: "${env:GRAFANA_CLOUD_TOKEN}"

    receivers:
      kafka:
        protocol_version: 2.0.0
        brokers: kafka-for-otelcol-kafka-brokers.kafka.svc.cluster.local:9092
        topic: otlp-spans

    processors:
      transform:
        error_mode: ignore
        trace_statements:
          - context: span
            statements:
              - set(attributes["consumed_at"], UnixMilli(Now()))

    exporters:
      otlphttp:
        endpoint: https://otlp-gateway-prod-eu-west-2.grafana.net/otlp
        auth:
          authenticator: basicauth

    service:
      extensions: [ basicauth ]
      pipelines:
        traces:
          receivers:  [ kafka ]
          processors: [ transform ]
exporters: [ otlphttp ]- Now, we need to send some telemetry to our “pub” Collector. If we don’t have a workload in the cluster available, we can open a port-forward to the Collector that is publishing to Kafka and send data via
telemetrygento it:
kubectl port-forward svc/otelcol-pub-collector 4317
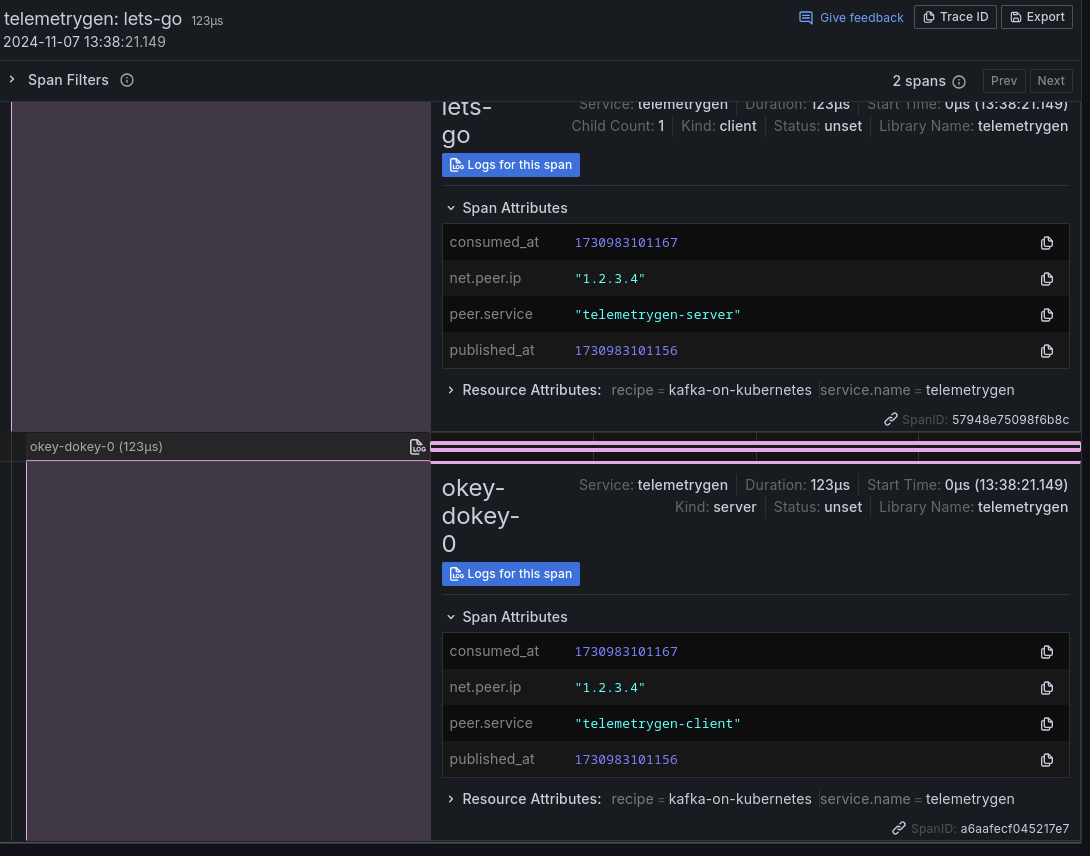
telemetrygen traces --traces 2 --otlp-insecure --otlp-attributes='recipe="kafka-on-kubernetes"'- You should now see two new traces in your Grafana Cloud Traces view, like the following. Note that we are adding new attributes to the spans, recording the timestamp when they were placed at topic (
published_at) and retrieved from it (consumed_at).
Tasting notes
Our desert has a complex taste, which will be appreciated by people who have spiky workloads and need a robust ingestion layer with a backend that might not be fast enough to handle the spikes but fast enough to ingest data over time properly. This way, we don’t need to overprovision our entire pipeline, scaling up and down only the needed parts.
I hope you’ve enjoyed this brief tour of the OpenTelemetry Collector. I hope it inspires you to keep cooking with your telemetry data!
Grafana Cloud is the easiest way to get started with metrics, logs, traces, dashboards, and more. We have a generous forever-free tier and plans for every use case. Sign up for free now!


