Leveraging OpenTelemetry and Grafana for observing, visualizing, and monitoring Kubernetes applications
Ken has over 15 years of industry experience as a noted information and cybersecurity practitioner, software developer, author, and presenter, focusing on endpoint security, big security data analytics, and Federal Information Security Management Act (FISMA) and NIST 800-53 compliance. Focusing on strict federal standards, Ken has consulted with numerous federal organizations, including Defense Information Systems Agency (DISA), Department of Veterans Affairs, and the Census Bureau.
Enterprises today can gain a competitive advantage by enabling developers to rapidly compose new application capabilities by utilizing existing microservices and Kubernetes.
For example, by leveraging a library of reusable microservices, a financial institution can quickly develop and deploy new features, such as real-time fraud detection or personalized customer insights, without having to build these capabilities from scratch. This modular approach not only accelerates development cycles, but also ensures greater flexibility and scalability.
Additionally, when a retail company integrates microservices for inventory management, payment processing, and customer notifications, it can swiftly adapt to market changes and seasonal demands, enhancing its responsiveness and customer satisfaction. This ability to innovate rapidly and efficiently through microservice composition is transforming how businesses compete and succeed in the digital age.
The dark side of composable applications

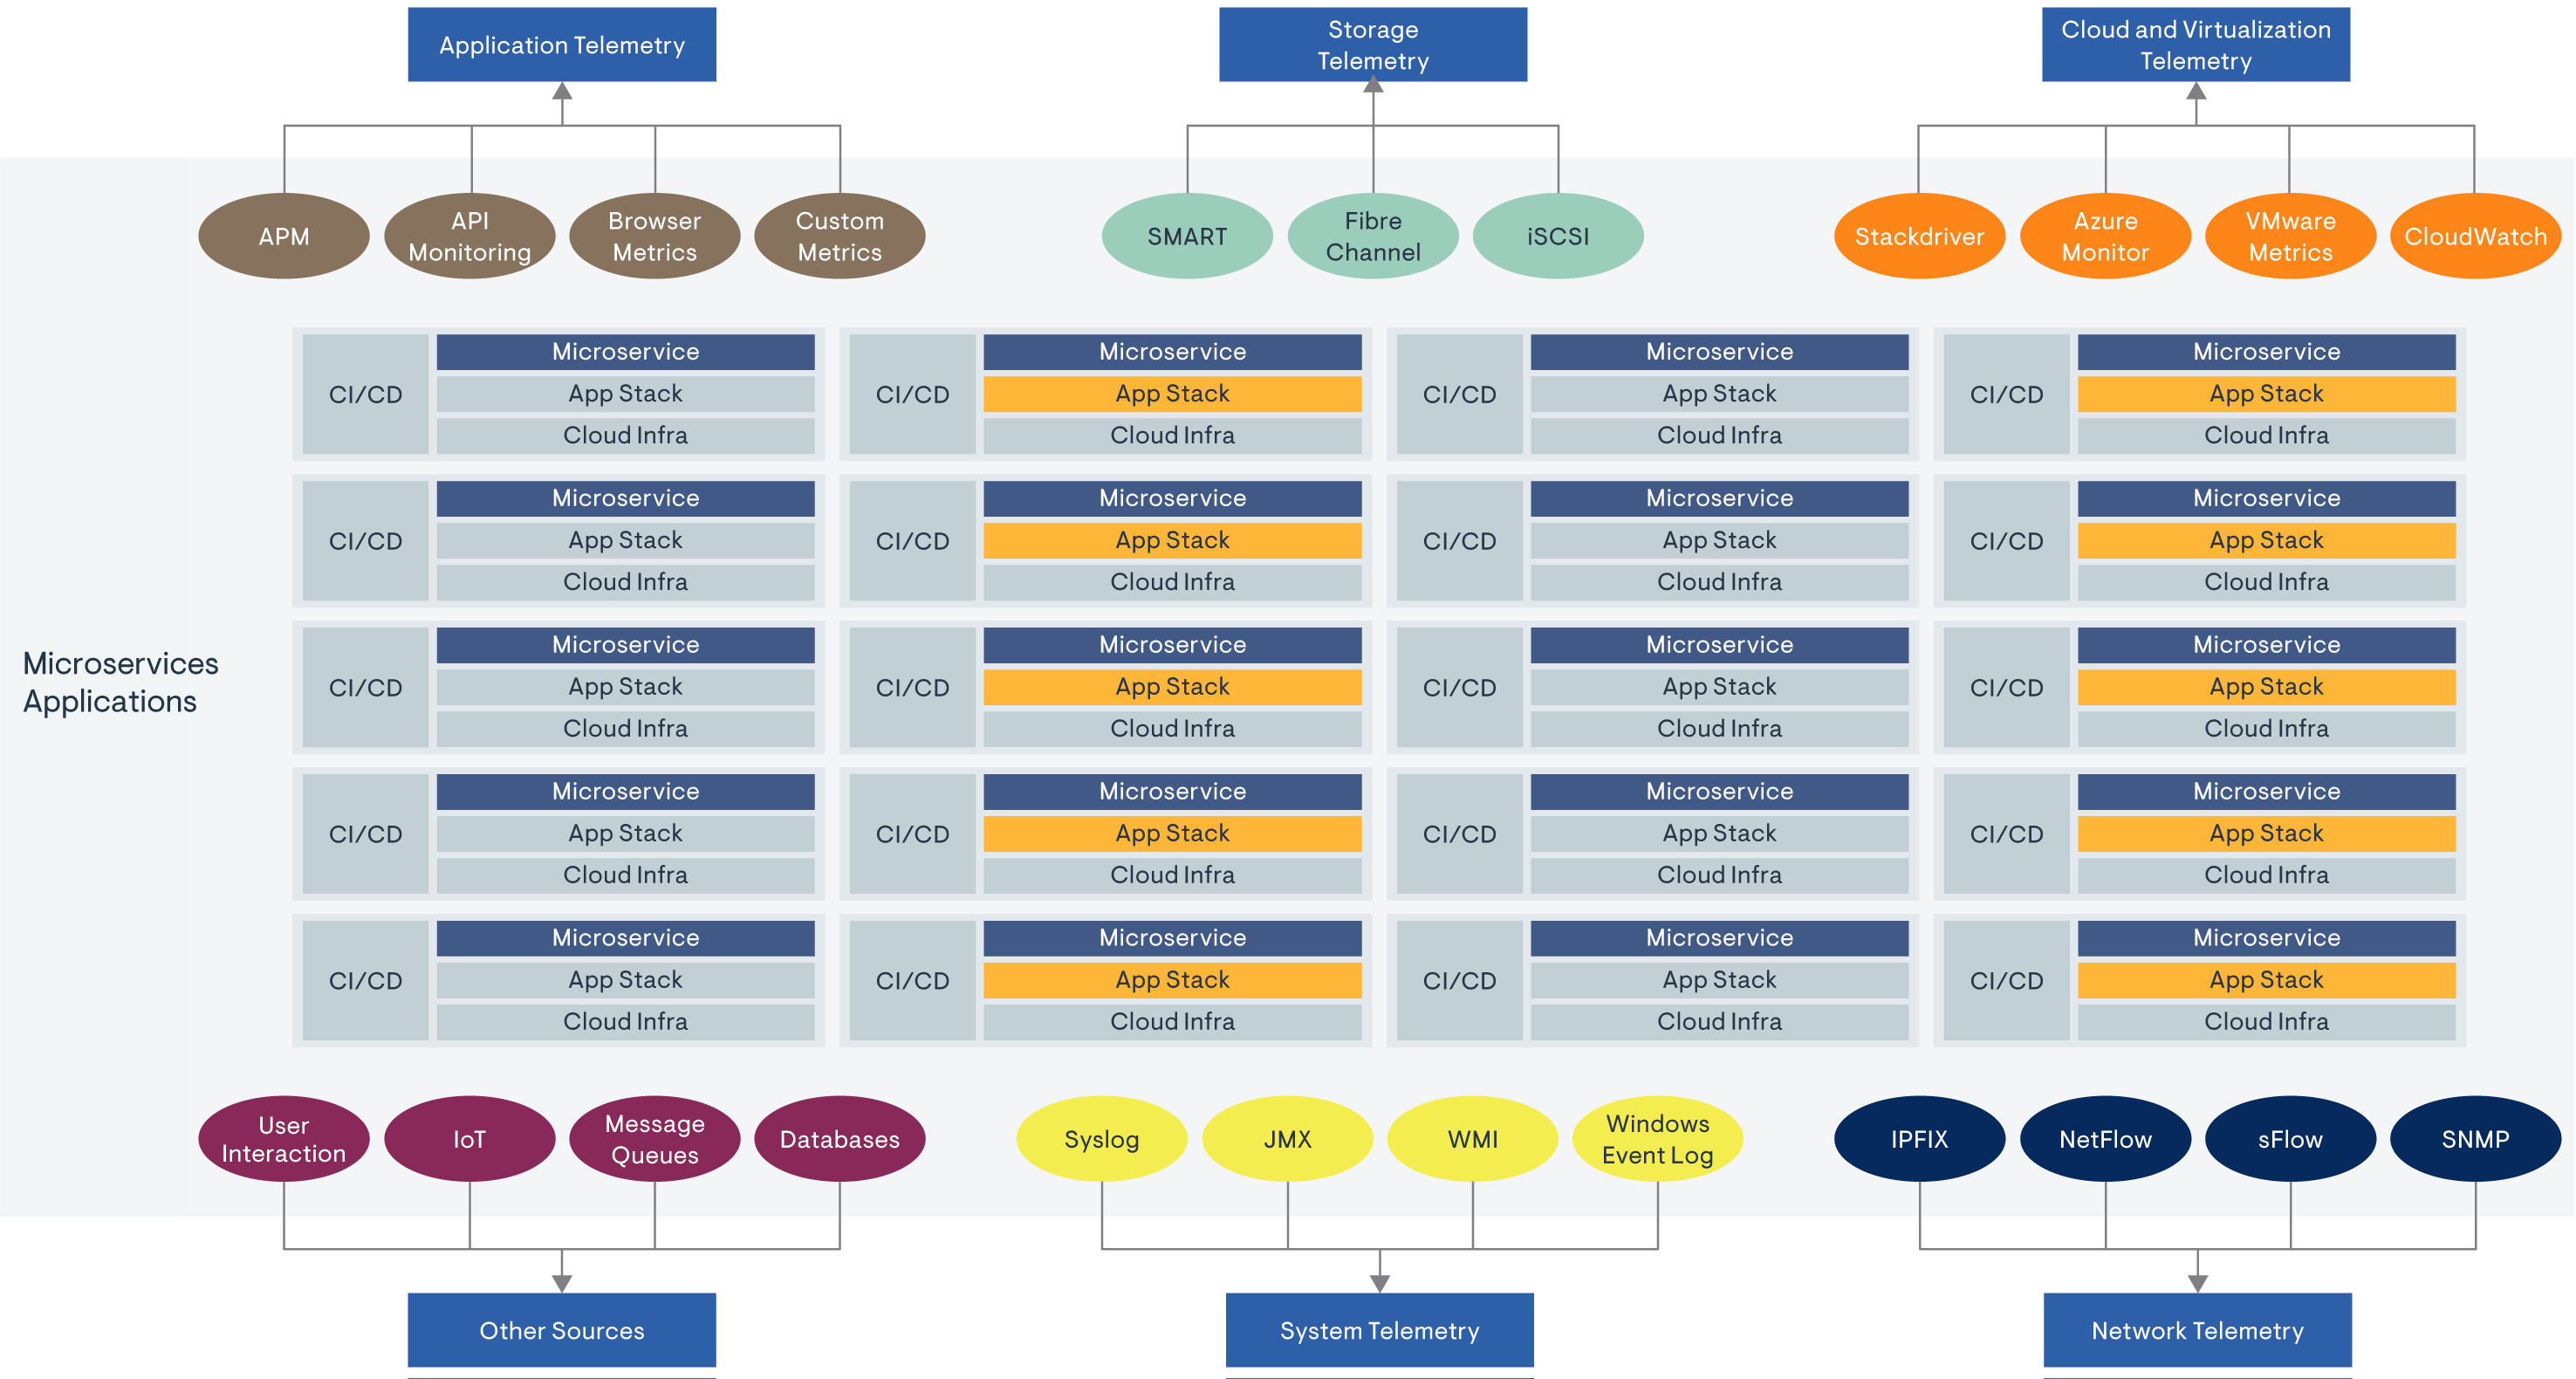
While the composable nature of microservices apps offers significant advantages in terms of agility and modularity, it also introduces considerable complexity in managing disconnected telemetry data. As organizations deploy numerous microservices, each with its own independent technology stack and CI/CD pipelines, they encounter a deluge of heterogeneous telemetry data.
Application telemetry, storage telemetry, and cloud and virtualization telemetry—along with inputs from user interactions, IoT devices, message queues, databases, and various system and network telemetry sources—create a fragmented observability landscape. This fragmentation can drown organizations in data silos, making it difficult to achieve a unified view of system performance and health.
The lack of integration between these disparate telemetry sources can lead to blind spots, inefficient troubleshooting, and increased operational overhead as teams struggle to correlate data across different services and infrastructure components. Consequently, the significant challenges in managing and making sense of the distributed telemetry data can undermine the promised benefits of microservices.
The importance of OpenTelemetry

Organizations need unified observability that spans their entire technology stack. One way to achieve this is to standardize on a single observability tool, but that can create a significant vendor lock-in issue, complicating future tool changes. OpenTelemetry offers a standardized, vendor-neutral method for instrumenting applications and their infrastructure components to generate consistent, contextual, and application-centric telemetry data. This eliminates the vendor lock-in problem, enabling organizations to significantly reduce migration costs if they decide to switch tools in the future.
Of course, standardizing on a single tool sounds good in theory. But in practice, organizations often use a variety of additional observability tools and platforms, such as Prometheus, Jaeger, Zabbix, Fluentd, Elasticsearch, Nagios, OpenSearch, Zipkin, Skywalking, and Logstash. This diversity can lead to data silos and inconsistent telemetry data pipelines, which are often managed by different teams within the organization.
Absorbing these silos into OpenTelemetry is generally possible and highly beneficial. With its vendor-neutral standard and support for a wide range of languages, OpenTelemetry can streamline telemetry data collection, improve data consistency, and enhance the overall observability strategy.
Nevertheless, most organizations face significant challenges in doing so. The primary obstacles include the lack of necessary skills and resources to integrate these disparate systems quickly and reliably, as well as the high costs associated with such an undertaking.
To address these challenges, organizations need to invest in training their teams in OpenTelemetry and related technologies. Additionally, adopting a phased approach to integration can help manage costs and minimize disruptions. Leveraging professional services or consulting firms with expertise in OpenTelemetry can also expedite the process and ensure a smoother transition.
Accelerate OpenTelemetry implementation through Loki, Mimir, Tempo, Beyla, Pyroscope, and Alloy
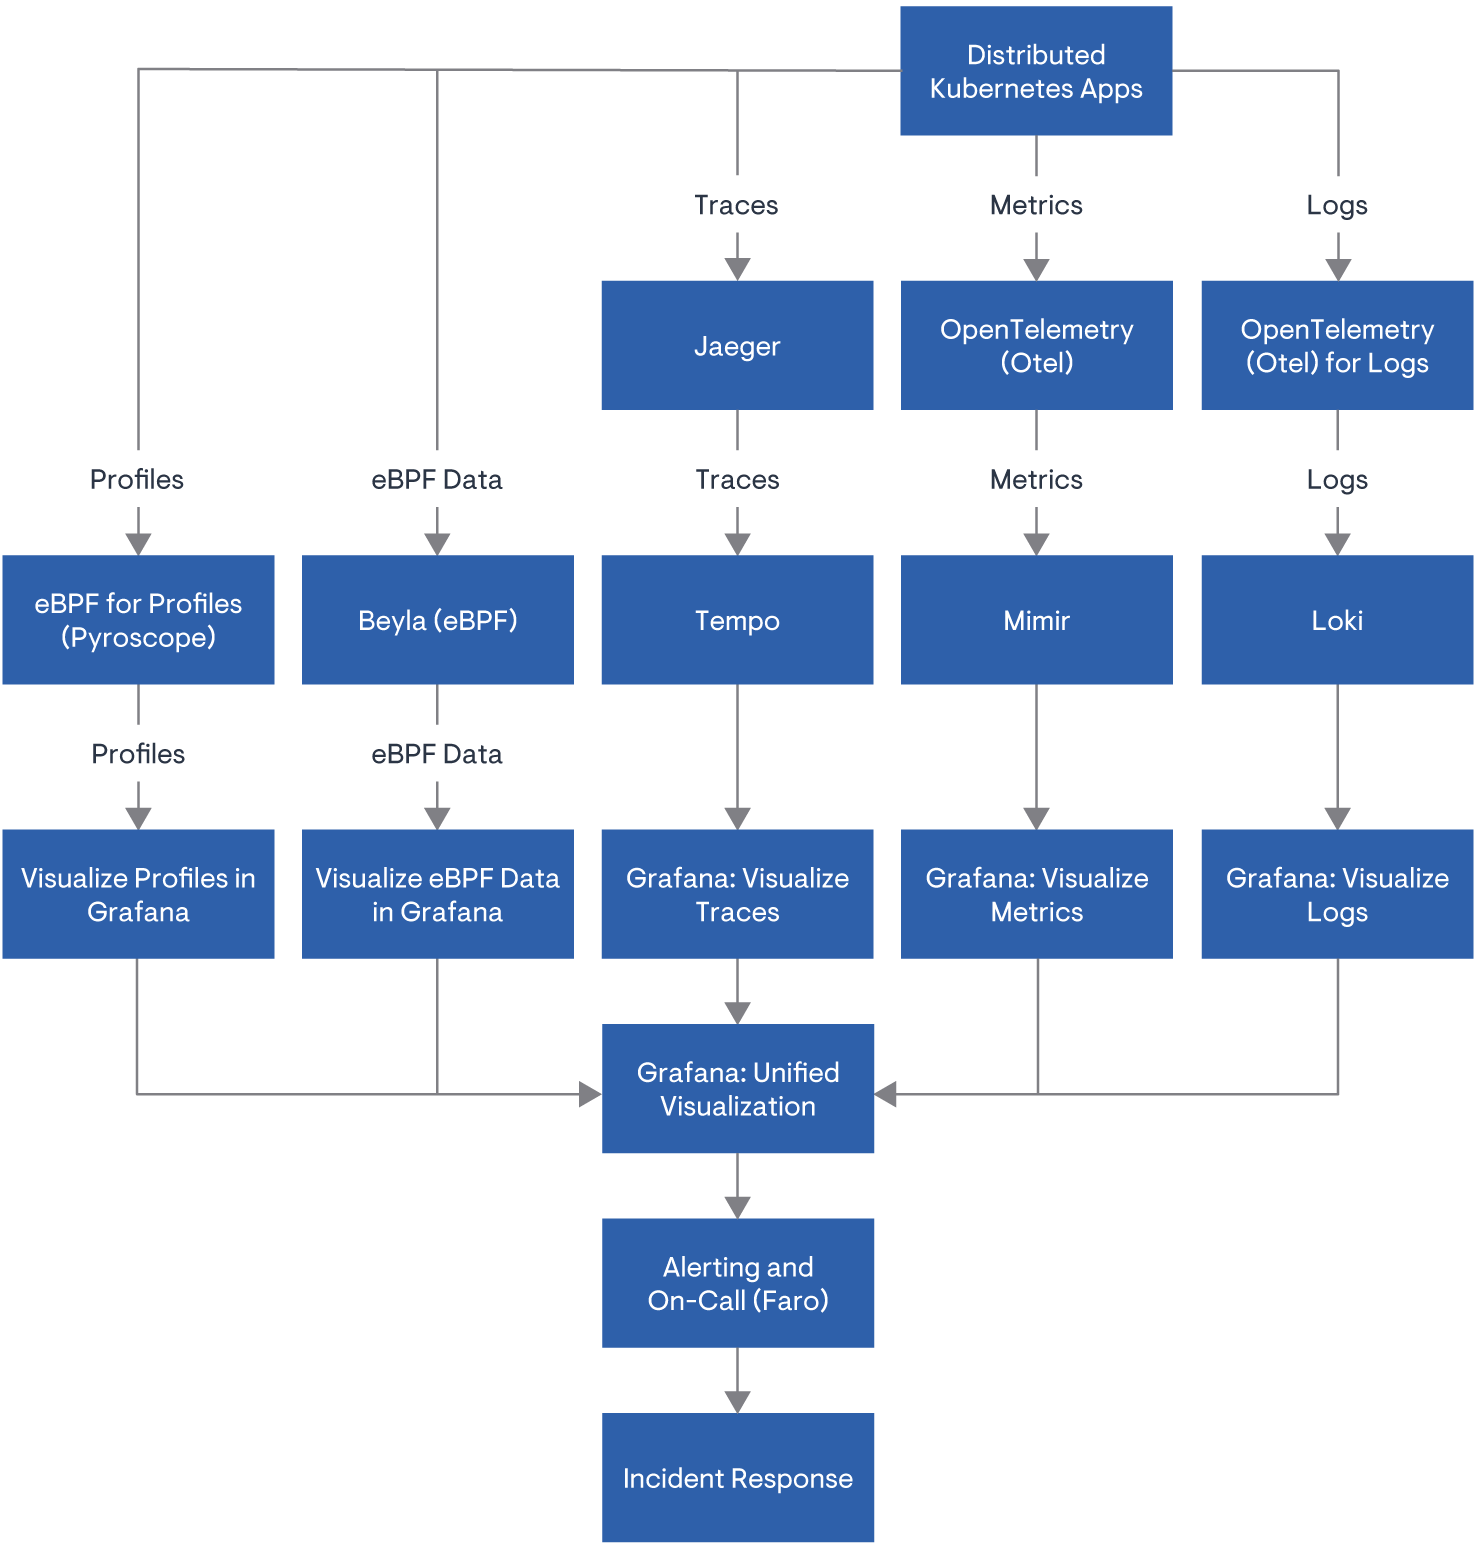
Grafana’s suite of open source observability tools—Loki, Pyroscope, Mimir, Tempo, Alloy, and Beyla—complements OpenTelemetry (OTel) by providing a seamless integration that simplifies and enhances the adoption of standardized telemetry data.
OpenTelemetry offers a framework for generating consistent, contextualized telemetry data across the various components of an organization’s technology stack. However, the challenge lies in effectively collecting, storing, and visualizing this data. Grafana’s tools address these challenges head-on, ensuring that organizations can fully leverage OpenTelemetry without the associated complexities and costs.
- Loki, for instance, complements OpenTelemetry by providing a scalable and efficient log aggregation system that can ingest and query logs that OTel-instrumented applications generate.
- Mimir enhances this by handling the vast volumes of metrics data, ensuring they are efficiently stored and readily available for analysis.
- Tempo, with its distributed tracing capabilities integrate seamlessly with OpenTelemetry traces, allowing for a unified view of request flows across microservices.
- Pyroscope adds continuous profiling, giving detailed performance insights that are contextualized with OTel’s telemetry data.
- Beyla provides eBPF-based auto-instrumentation to ensure that all telemetry data—logs, metrics, traces, or profiles—can be visualized and acted upon in real time within Grafana’s unified dashboards.
While OTel has surged in popularity, especially after its GA announcement at KubeCon last year, Prometheus remains the leader in core infrastructure monitoring with over 10,000 integrations. Grafana’s newest OSS project, Alloy, is the successor to Grafana Agent, integrating its observability codebase and lessons from challenging use cases to create an efficient OTel Collector distribution that also handles Prometheus-compatible metrics. Alloy supports advanced use cases with features like GitOps-friendly configuration, native clustering, secure Vault integration, and embedded debugging utilities.
Together, these tools transform OpenTelemetry’s rich telemetry data into actionable insights, providing a cohesive and comprehensive observability strategy. Organizations can benefit from OpenTelemetry’s standardized data collection while leveraging Grafana’s powerful analytics and visualization capabilities, resulting in a more efficient, reliable, and cost-effective observability solution. This synergy ensures that teams can easily correlate and analyze diverse telemetry data, leading to enhanced operational efficiency and improved system performance.
One dashboard to rule them all
Grafana’s integration with OpenTelemetry truly brings to life the concept of a single, unified dashboard for comprehensive observability. By combining the power of OpenTelemetry’s standardized telemetry data and semantic conventions with Grafana’s robust suite of tools—Loki, Pyroscope, Mimir, Tempo, Beyla, and Alloy—organizations can achieve unparalleled visibility into their systems. This unified approach eliminates the data silos and inconsistencies that typically plague observability efforts, enabling teams to quickly and efficiently correlate logs, metrics, traces, and profiles.
With Grafana’s intuitive interface and powerful visualization capabilities, all relevant telemetry data is accessible in one place, simplifying analysis and accelerating troubleshooting. This one dashboard to rule them all not only reduces the complexity and cost associated with adopting OpenTelemetry, but also empowers organizations to proactively manage and optimize their IT infrastructure. The result is a more resilient, efficient, and high-performing technology stack that provides a significant competitive advantage in today’s fast-paced digital landscape.
To learn more about OpenTelemetry, check out the complete OpenTelemetry: Challenges, priorities, adoption patterns, and solutions report.


