Grafana Cloud updates: redesigned dashboard filters, more ways to use RBAC, and more
We consistently roll out helpful updates and fun features in Grafana Cloud, our fully managed observability platform powered by the open source Grafana LGTM Stack (Loki for logs, Grafana for visualization, Tempo for traces, and Mimir for metrics).
In case you missed them, here’s our monthly roundup of the latest and greatest Grafana Cloud updates. You can also read about all the features we add to Grafana Cloud in our What’s New in Grafana Cloud documentation.
And if you’re not a Grafana Cloud user yet, sign up for an account today! You can try any of these features (and more) for free with our generous Cloud Free plan.
Enhancements to dashboards and visualizations
This month, we’re sharing new features that make it easier for Grafana Cloud users to work with dashboard filters, that offer more flexibility when using correlations, and more.
Redesigned filters for dashboards
Creating dashboard filters is now a smoother and faster process (with fewer clicks required) in Grafana Cloud.
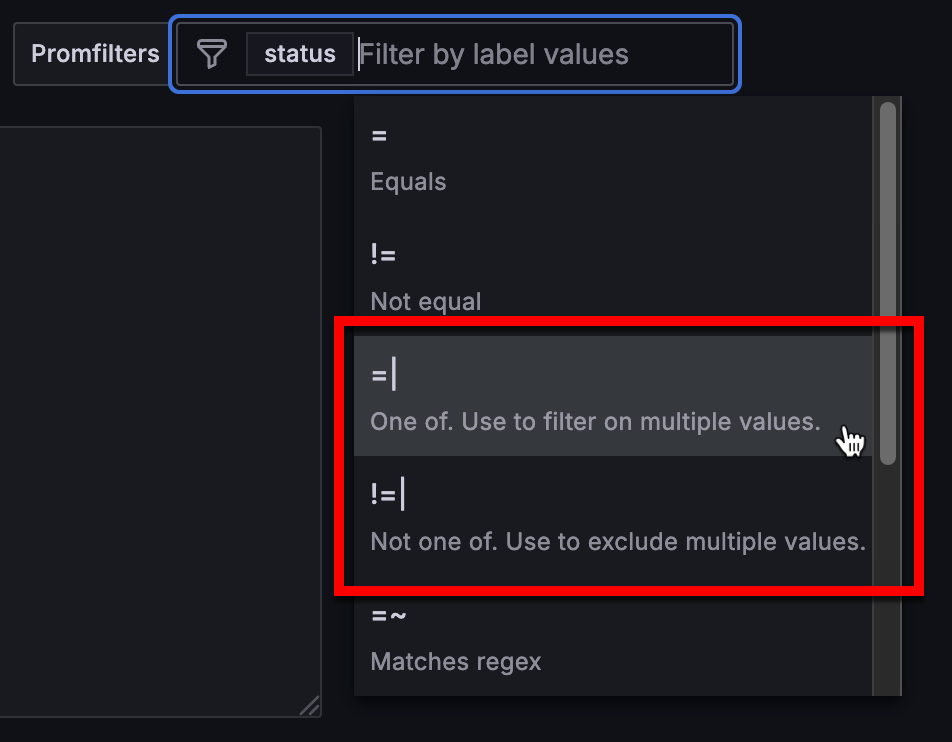
We’ve redesigned filters so they’re more prominent on your dashboard, and so that filters based on the same ad hoc filter variable are more clearly related. In the new design, you can click anywhere in the filter field to start creating a filter, and Grafana will automatically detect which part of the filter you’re setting up.
Another prominent update is that labels can now have multiple values using the new multi-select operators.

To try out these redesigned filters, enable the newFiltersUI feature flag.
Legend support in bar gauge visualizations
Legend support is now available in bar gauge visualizations, an update that reflects our continued effort to standardize legends and make them available across more panels. You can customize legends by navigating to the Legend section in panel options.
You can also hide names in each bar gauge, since they are redundant to the legend. To do that, in the Name placement option, choose Hidden.

Auto-formatted table cell values
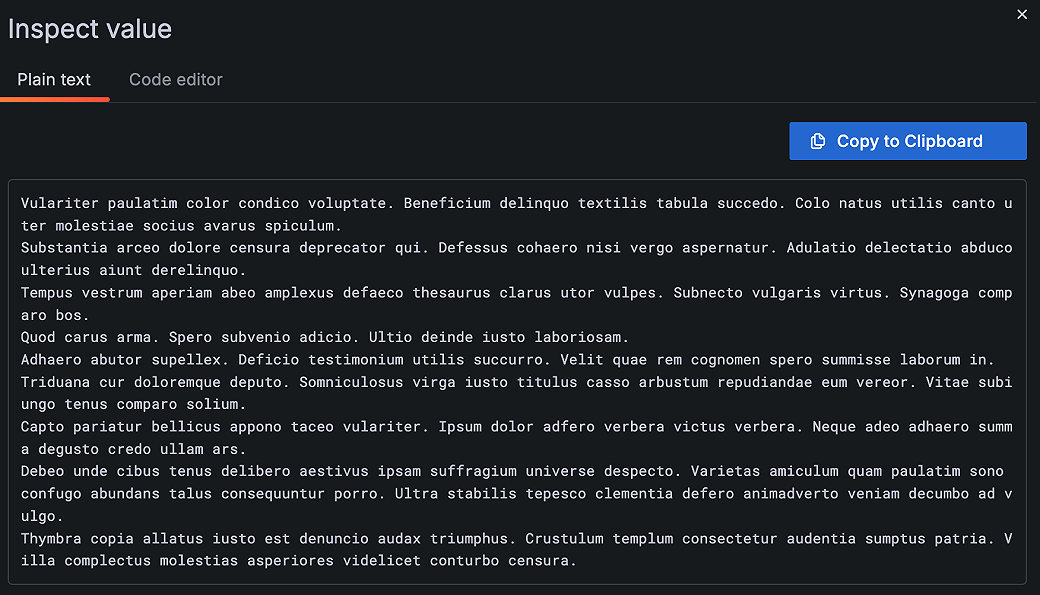
It’s tough to scan long JSON blobs or stack traces in a compact table. As of Grafana 11.3, you don’t have to squint — just inspect that cell! We’ve improved the inspect value experience in table visualizations with the addition of tabs in the Inspect value drawer: Plain text and Code editor.
When the Cell inspect value switch is toggled on, clicking the inspect icon in a cell opens the drawer. Grafana automatically detects the type of data in the cell and opens the drawer with the associated tab showing. Bonus: You can switch back and forth between tabs.

For more information, check out our table documentation.
Add correlations to external URLs in Explore
In Grafana, correlations are a way to set up links between data sources — for example, clicking on a customer ID in a log line to open up a Salesforce query for that customer in Explore. Previously, the generated link would only be from one query to another, meaning results from a query could only generate links to open a second Explore panel with other query results.
Now you can create correlations that link to an external URL. For example, you could link from that customer ID directly to Salesforce itself by inserting that customer ID into the URL. The format follows the standard Grafana format for using variables, just like in data links.
RBAC for plugins
Plugins can now leverage Grafana’s role based access control (RBAC), enabling plugin developers to define roles and permissions to control access to routes.
To define roles and their default assignments, you can add a roles section to your plugin.json file. Grafana will then automatically register those roles and assign them to the corresponding basic roles: Viewer, Editor, Admin, and Grafana Admin.
If you’d like to test this and explore RBAC for plugins further, refer to this plugin example for guidance. You can also check out our documentation to learn more.
RBAC for notifications in Grafana Alerting
Speaking of RBAC, admins can manage contact points, mute timings, and notification templates through role-based access control (RBAC). You can now choose who can create, edit, and read contact points, mute timings, and notification templates using permissions or fixed roles.
For mute timings and notification templates, you can grant all users all permissions or no permissions. For contact points, you can extend or limit permissions to individual contact points.
This feature is currently in public preview in Grafana Cloud. To learn more, please refer to our technical docs.
Grafana holiday season release freezes
Each year, we implement two release freezes to accommodate for the holiday season. This year, our release freezes for Grafana Cloud will be implemented on:
- Nov. 25, 2024 to Dec.2, 2024
- Dec. 19, 2024 to Jan. 2, 2025
During these times, no scheduled releases will be executed. However, this does not apply to changes that may be required during the course of an operational or security incident.
You can learn more in our blog post.
Grafana Cloud is the easiest way to get started with metrics, logs, traces, dashboards, and more. We have a generous forever-free tier and plans for every use case. Sign up for free now!


