Visualize real-time CAN-to-USB data via custom Grafana dashboards and the MQTT plugin
Martin Falch, co-owner and head of sales and marketing at CSS Electronics, is an expert on CAN bus data. Martin works closely with end users, typically OEM engineers, across diverse industries (automotive, heavy-duty, maritime, industrial). He is passionate about data visualization and has been spearheading the integration of the CANedge/CANmod with Grafana dashboards through various data sources.
At CSS Electronics, we develop professional-grade, simple-to-use CAN loggers, CAN USB interfaces, and sensor-to-CAN modules. To make this happen, we rely on CAN bus, a protocol used for communicating sensor data within trucks, cars, ships, robots, and more.
Our end users are primarily engineers working at automotive or industrial equipment manufacturers like Hyundai, Bosch, or John Deere. These users often need to visualize data from their equipment in real-time to diagnose issues, monitor performance, or to detect or alert upon certain conditions. This is commonly done via devices that enable CAN-to-USB streaming and software/API tools.
However, traditional software tools for CAN-USB streaming are not great at visualizing the real-time data in customizable dashboards, something an increasing number of users are interested in.
To solve this, we used the MQTT data source plugin for Grafana and our Python API to enable users to set up custom CAN-USB streaming dashboards in less than five minutes.
CSS Electronics’s solution: Grafana + MQTT
To get started, you’ll need a device that can stream CAN data via USB to a PC in real-time, while also integrating with the open source python-can library.
A large number of products exist that satisfy these criteria including our CANmod series:
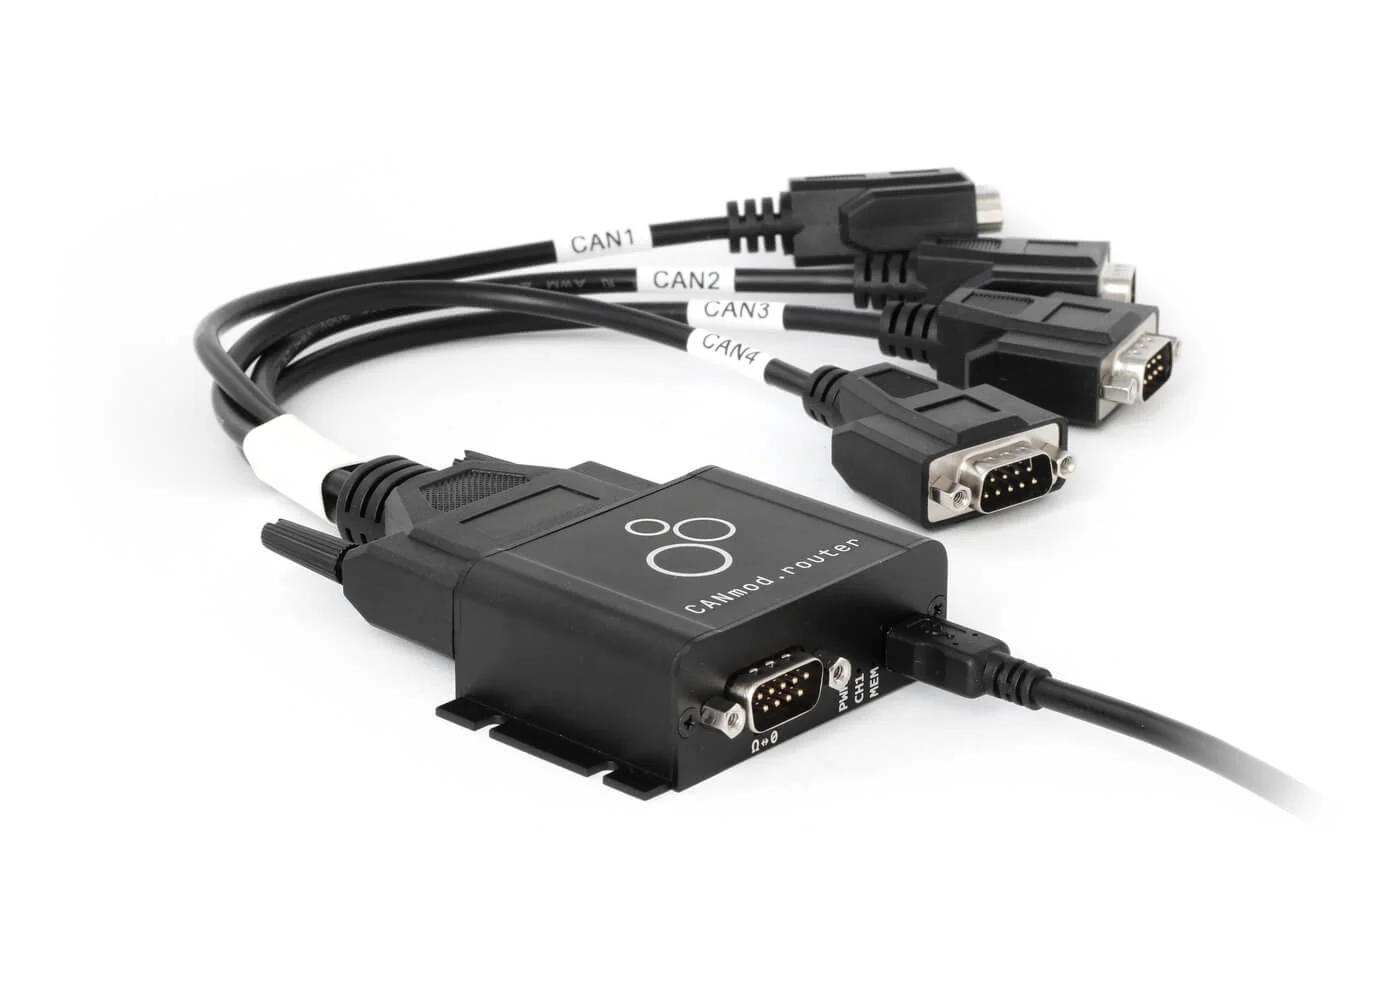
- CANmod.router: Interface 4 x CAN buses, and output via CAN or USB
- CANmod.gps: Measure GPS/IMU data, and output via CAN or USB
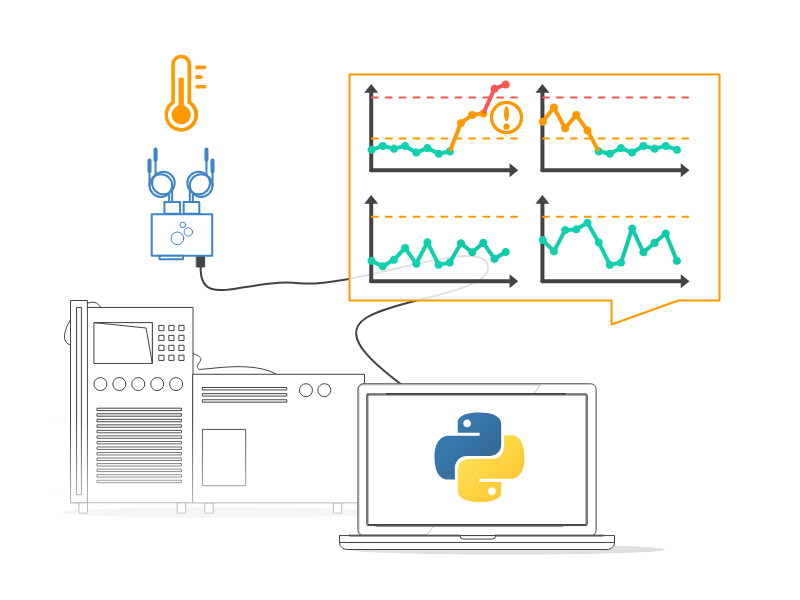
- CANmod.temp: Measure temperature data, and output via CAN or USB
- CANmod.input: Measure analog/digital/pulse signals, and output via CAN or USB
Our integration with python-can enables end users of our CAN bus interfaces to send or receive raw CAN frames in real-time via simple Python scripts. Further, the raw data can be decoded into human-readable signals/parameters like temperature and speed through the use of a DBC file. A DBC file is simply a text file that contains information specific to, say, a particular vehicle model on how to translate the raw CAN bus frames from the application.
Building on python-can, we created a small can2mqtt.py script (< 100 lines) that enables end users to point to one of our CAN-USB interfaces (and a DBC file) to perform real-time decoding of the CAN data stream and forward the decoded parameters to an MQTT-broker. With this setup, users can then visualize the data in Grafana dashboards using the MQTT data source plugin. The script can be found in the Python API documentation for our devices.

Multiple devices and remote visualization
The CAN-USB-MQTT setup can be deployed multiple times in parallel to enable the integration of multiple device data sources. For example, you may want to visualize data across three temperature-to-CAN modules (CANmod.temp). This is easily done by referencing the individual COM ports and simply running the command-line script multiple times in parallel. The MQTT topics are defined as “[COM Port]/[Message Name]” so you have unique references for each data source and CAN message.
In the simplest setup, users can run everything on one PC:
- Connecting the CAN-USB device
- Running the Python script
- Deploying the MQTT-broker
- Running Grafana locally
However, it’s also easy to enable access to the data on a local WiFi network or over the internet via port forwarding. This naturally opens up a vast amount of use cases far beyond ad hoc analysis, as the data can now be used in remote data visualization, telematics, predictive maintenance, and more.
Within Grafana, the dashboard can be set up to display the most recent X seconds of data, enabling beautiful real-time visualization of the data across time series plots, gauges, stats and more.
Managing complex data: variables, dashboard separation, and alerts
Real-time CAN bus data visualization adds a number of unique challenges.
For example, it is quite normal for a single CAN bus to contain hundreds (or even thousands) of unique parameters—some of which may be broadcast at frequencies above 500 Hz. Of course, the MQTT data source plugin should not be used to visualize all of this data simultaneously, as doing so would make it impossible to analyze—and drag down the dashboard performance.
Instead, use Grafana variables to create dynamic dropdown menus for selecting which signals to visualize in certain plots. For example, the dashboard may contain a dropdown that allows end users to select which signal to visualize in a specific panel. This way, a single-panel dashboard can be used to flexibly visualize data across hundreds of unique signals—while still retaining simplicity and high performance.
Another way to manage the data is to create separate dashboards for each type of analysis. For example, an engineer may create five separate analysis-specific dashboards, each containing multiple panels and signals that are meaningful to compare in a specific way. The user can then quickly jump back and forth between dashboards using Grafana’s dashboard links.
When working with vast amounts of data, it can also be relevant to set up automated detection of certain events. Unfortunately, this is not possible directly via the MQTT data source plugin. However, you can implement this directly in the Python script facilitating the integration (and use the plugin to supplement the notifications with real-time visualization). Alternatively, multiple MQTT-based alert systems exist that can be integrated into the existing workflow.
To illustrate some of the potential use cases, let’s briefly look at two popular examples.
Set up CAN-based monitoring and alerting systems

In many production, testing, or development use cases, you may need to deploy an automation script that records raw CAN data, decodes it, and reacts to certain patterns in the data.
For example, you may have a temperature-sensitive process where you could deploy one or more CANmod.temp units to measure temperatures, and then stream this data to a PC—and send an alert if certain thresholds are crossed.
Or, you could use a CANmod.router to record CAN bus data during an automotive lab test and script it to transmit certain CAN-based commands when certain predefined events happen. The data can be visualized via Grafana and MQTT, enabling a clear visualization of the alert conditions as a supplement to the script-based reactions.
Visualize vehicle data across multiple customized dashboards

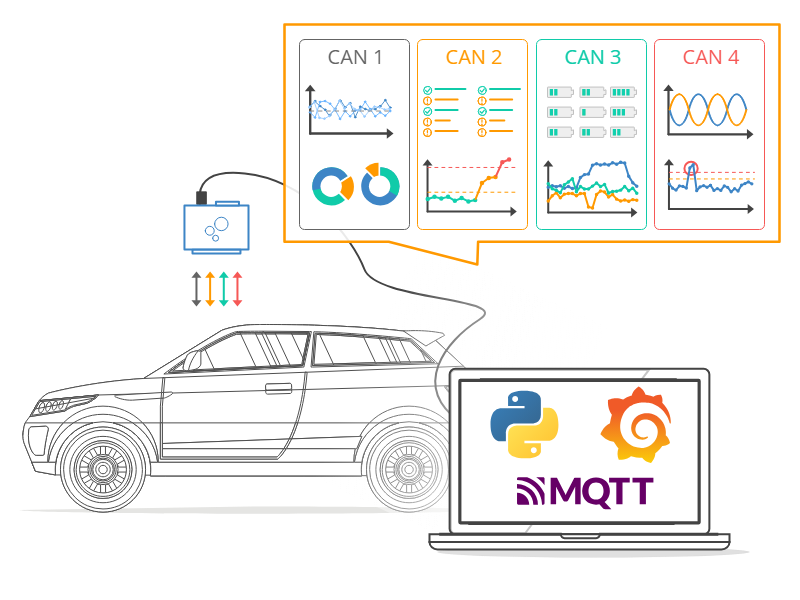
In automotive lab testing, you often need to visualize data from multiple CAN buses in a prototype vehicle. Keeping track of all the data can be complex and most CAN-USB software tools offer limited visualization options.
However, with our MQTT plugin for Grafana, you can easily deploy custom Grafana dashboards to display the data from your CAN-USB device. In particular, you can create separate custom dashboards to focus on specific vehicle analyses and easily jump between them.
Plus, you can deploy this locally on the host PC as a development/diagnostic tool,or you can port-forward the MQTT data stream for remote access (e.g., to share with remote engineering teams).
Learn more
The MQTT data source plugin for Grafana offers a 100% free method for visualizing USB-streamed CAN bus data in real-time. Grafana offers a completely different degree of customization and flexibility in how the data is visualized, making this a game changer for CAN-to-USB streaming use cases.
Learn more in our intro to streaming CAN bus data via Python guide.
Want to share your Grafana story and dashboards with the community? Drop us a note at stories@grafana.com.


