
Visualize GitHub repos, projects, and more: get started with the GitHub data source for Grafana
In 2020, we introduced the GitHub data source plugin for Grafana, helping organizations visualize and gain deeper insights into their use of the popular version control and collaboration platform.
Since then, thousands of users have installed the data source, and we’ve been working hard to extend its capabilities and make it even easier to use. In this blog post, we’ll take a closer look at how the GitHub data source plugin enables you to visualize key metrics and data related to your team’s daily GitHub use, reported issues, and more. We’ll also review key features and recent updates, as well as some helpful resources to install and start using the data source today.
Why visualize GitHub in Grafana
Whether you’re an SRE, DevOps engineer, system administrator or product manager, you need a development and version control platform to collaborate with your team on projects, report issues and bugs, track pull requests (PRs), and more. GitHub is one of the most widely used platforms to meet these needs, and has revolutionized code collaboration across the industry.
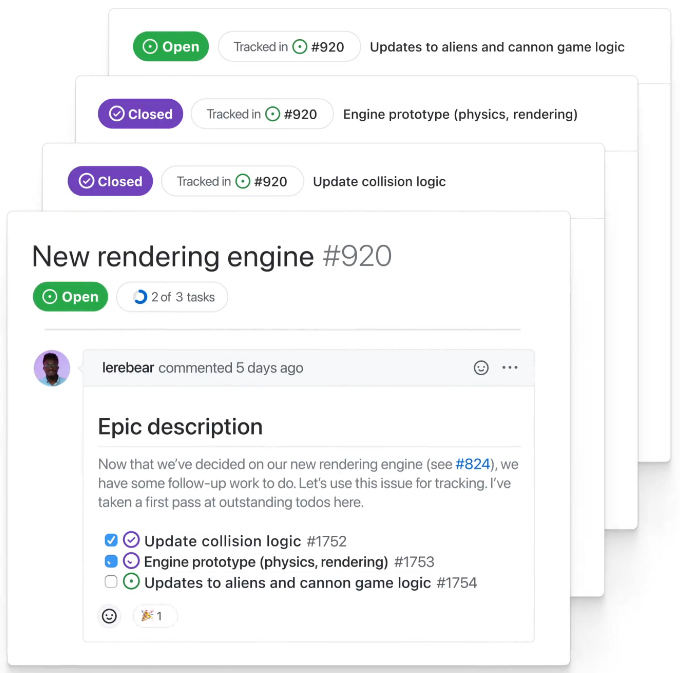
While GitHub is a powerful platform, allowing you to manage a range of tasks required for production-level projects, it can be a challenge to monitor the platform to ensure you’re meeting key requirements and deadlines. For example, your team might be solving all PRs reported internally within a defined timeframe, but what about PRs submitted by external users that relate to product usage or the overall end-user experience?
Similarly, if you are an engineering manager or a product owner and need to work simultaneously on two different projects with multiple teams, it can be difficult to track how many issues the support team resolved after the launch of a new feature or, similarly, how many bugs were found during QA testing.
While you can use the GitHub web UI to keep track of data and view repository status, that UI is somewhat limited, in terms of showing you all the data you need in one centralized location.
This is the exact challenge we aim to solve with our GitHub data source plugin, which uses the GitHub API to fetch the required data defined in the query editor, and then display it in a Grafana dashboard.
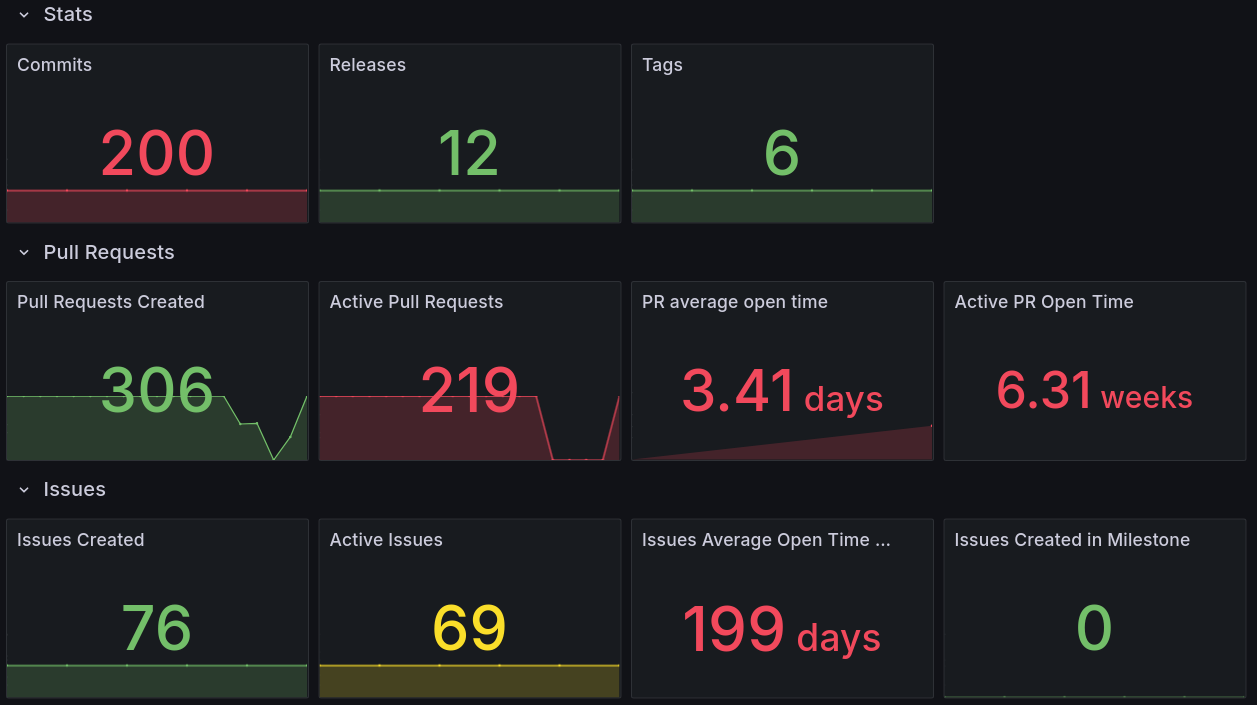
The data source is maintained by Grafana Labs and is available in Grafana Cloud (including in our generous forever-free tier), Grafana Enterprise, and Grafana OSS. You can also use the GitHub data source whether you have a free or Enterprise-level GitHub account.
Key features and recent updates
The GitHub data source plugin provides a range of features to help you quickly and easily visualize your GitHub activity. The plugin currently supports the following query types:
| Query Type | Description |
| Commits | View the number of commits that are made to one or more files in a branch |
| Issues | Track reported issues for bug fixes, feature requests, etc. |
| Contributors | View users who contributed to a GitHub repo |
| Tags | View references that point to specific points in Git history |
| Releases | See when software is released for deployment |
| Pull requests | Visualize the status of PRs, such as open or closed |
| Labels | See categories of issues, pull requests, discussions, etc. |
| Repositories | View different repos for different projects |
| Milestones | Track progress on groups of issues or PRs in a repository |
| Packages | View all available packages |
| Vulnerabilities | View any security vulnerabilities |
| Projects | Visualize projects (collections of data) |
| Stargazers | Visualize the GitHub stars in a repository |
| Workflows | Visualize GitHub workflows |
| Workflow usage | Monitor workflow usage limits |
Variables and macros
You can use variables in your dashboards and queries to make them more dynamic and interactive. Rather than having to hard-code options to query and visualize GitHub data, variables allow you to select a value from a drop-down to easily change the data being displayed.
Similarly, you can use macros within query syntax to make queries more dynamic. For example, you can add the multiVar macro to expand a multi-value variable into a GitHub query string, or use the day macro to return the day in UTC time. Here’s an example of using the macro $__multiVar(prefix,$var) in the Query field.

To learn more about variables and macros, refer to our technical docs.
Annotations
With annotations, you can overlay events on your graphs to provide team members with additional context when looking at a visualization. For example, with annotations for the GitHub data source plugin, you can display events related to GitHub commits, issues, PRs, releases and tags.

To learn more about annotations, check out our documentation.
Caching
Caching for the GitHub data source is enabled by default. This stores query data temporarily and automatically fetches it if the same query is requested again, helping to reduce dashboard loading times and improve the user experience.
Note: Caching reduces the number of calls made to GitHub via the API. However, if the queries are requested too rapidly, the GitHub rate limit will apply, and it may take up to 5 minutes to return the query result.
GitHub App authentication
As part of a recent update, you can now authenticate the GitHub data source using a GitHub App, providing an alternative to the classic personal access tokens (PATs). GitHub App authentication offers enhanced security by granting more granular permissions and reducing the risk of over-permissioning.
You can learn how to set up GitHub App authentication in our documentation.
Get started with the GitHub data source plugin
We offer detailed, step-by-step documentation on how to install and configure the GitHub data source plugin. In addition, you can find live, real-time examples of dashboards on the Grafana Play platform that help showcase usage of the plugin.
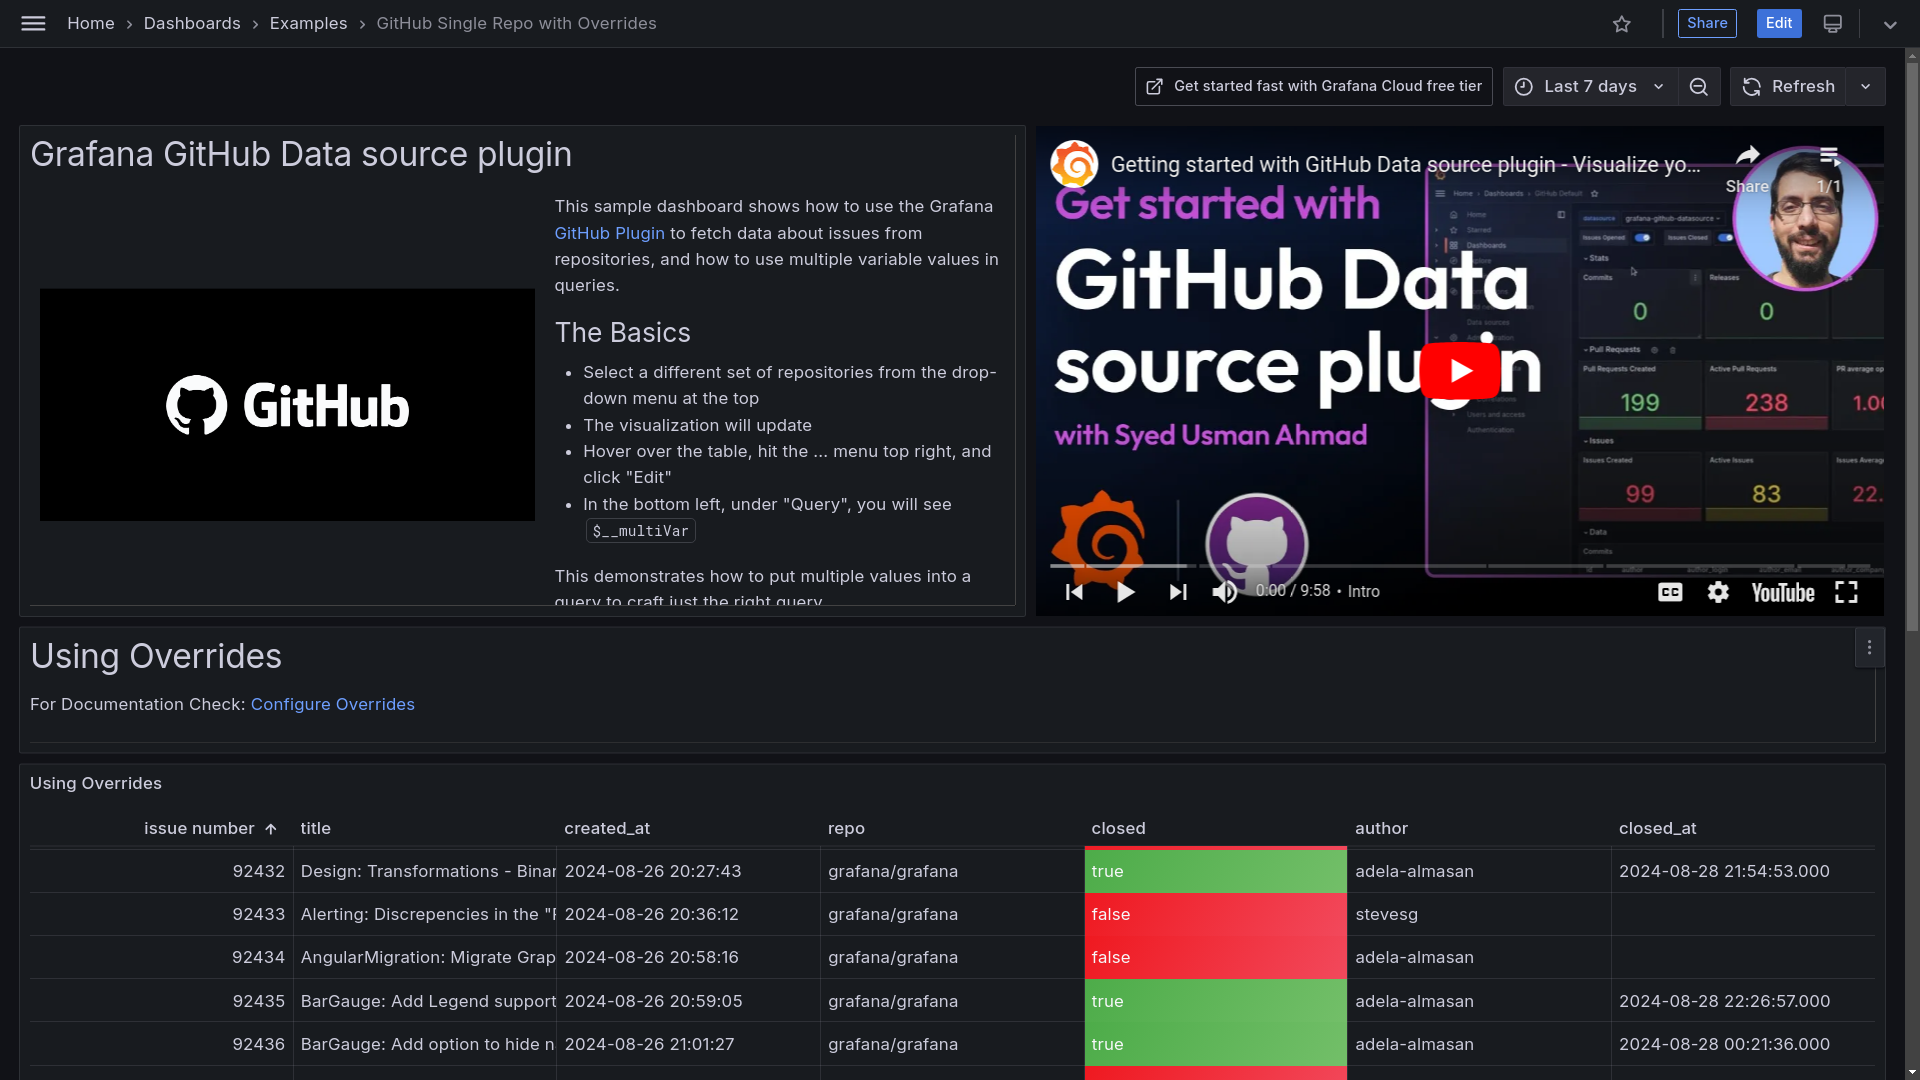
Also on Grafana Play, you can find examples of how to use the GitHub data source to fetch data about issues from repositories, as well as how to use multiple variable values in queries.
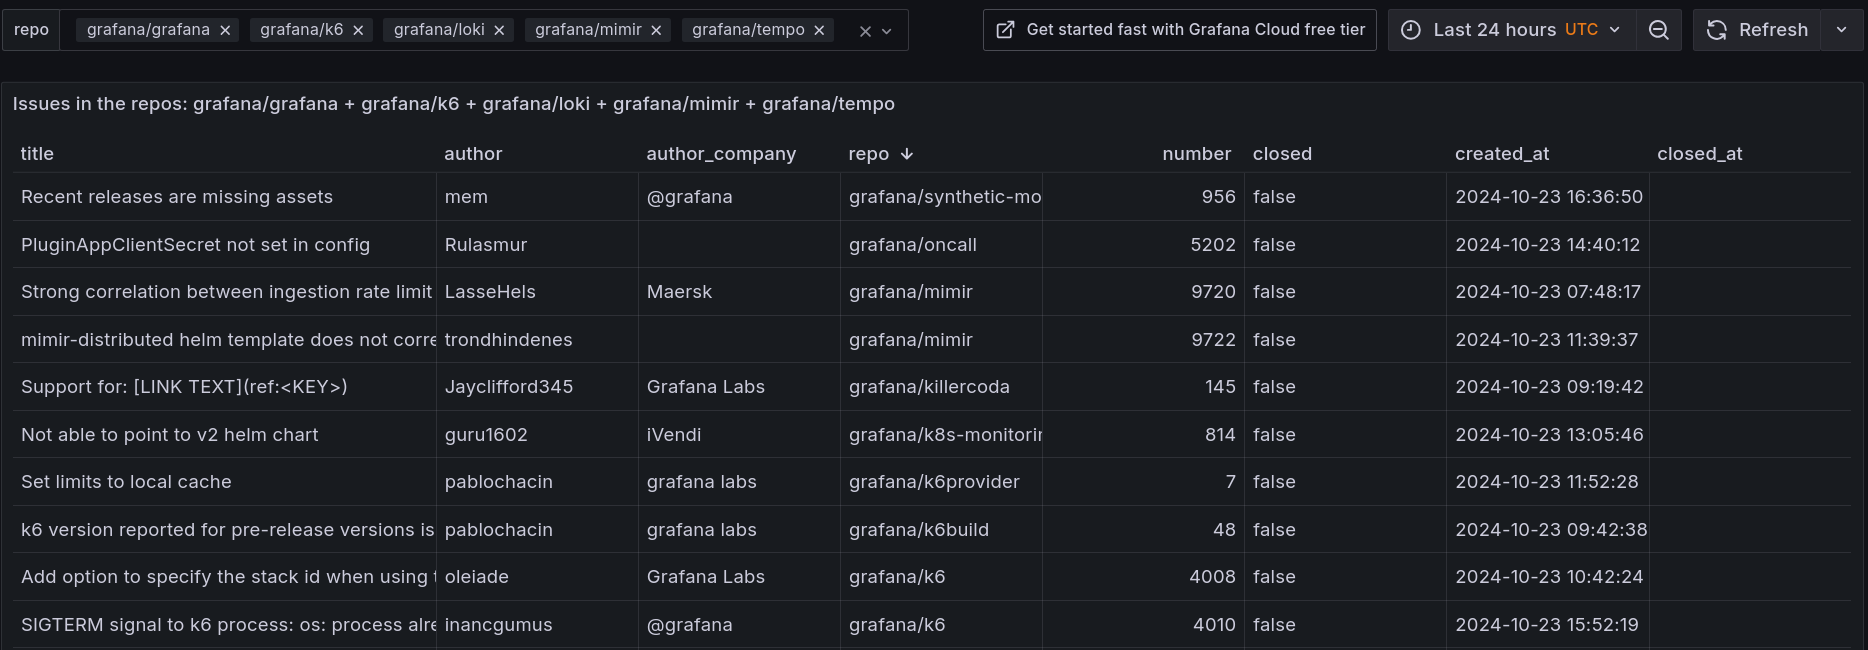
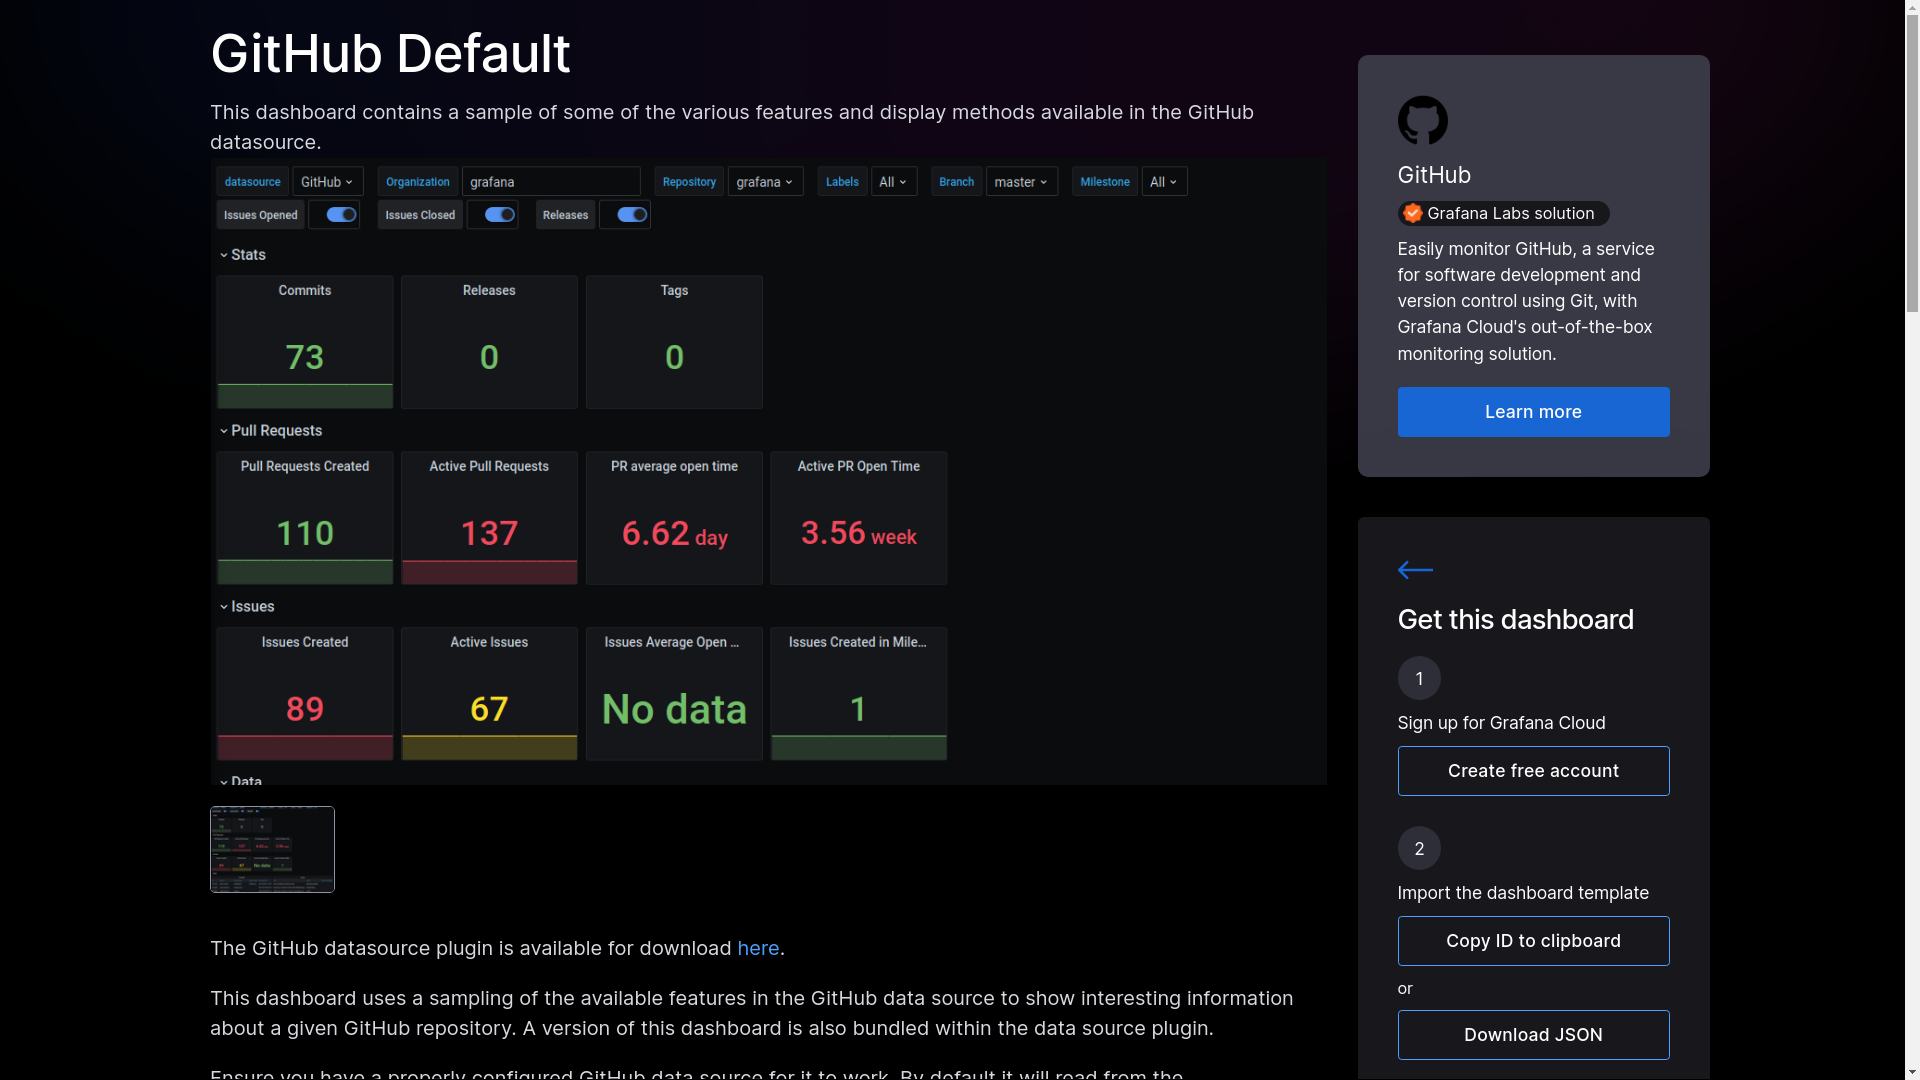
Lastly, we have a collection of pre-configured dashboards for the GitHub data source on the Grafana dashboard marketplace, along with step-by-step instructions on how to import them.
Want to get involved?
We’d love your feedback on the GitHub data source plugin, and how we might improve it moving forward. Please try it out and let us know what you think, and also consider contributing! And again, if you want more information to help you get started, please check out our technical docs.


