
From multi-line queries to no-code investigations: meeting Grafana users where they are
Note: As of Feb. 20, 2025, the Explore apps (Explore Metrics, Explore Logs, Explore Traces, Explore Profiles) are now the Drilldown apps (Metrics Drilldown, Logs Drilldown, Traces Drilldown, Profiles Drilldown).
When it comes to observability, different people have different levels of expertise. Some can readily rip out 50-line PromQL queries, complete with masterful usage of functions like group_left and label_replace. Others haven’t gotten much further than typing in a metric name and hitting “Run query.”
No matter their experience level, however, they all want the same thing: to utilize the vast volumes of telemetry data they’re collecting to help them keep their software running and, ultimately, deliver value to their end users.
We’ve long served the community of experts and early adopters, but as more organizations embrace observability, we’ve seen the need to evolve our Grafana LGTM Stack (Loki for logs, Grafana for visualization, Tempo for traces, and Mimir for metrics) to serve a wider set of users. One of our earliest attempts to address this was the creation of the Prometheus query builder, which we launched in Grafana 9, over two years ago.
Since then, we’ve made countless improvements so our observability stack is more approachable to those with limited experience. And last month, we hit our biggest milestone yet on this journey, with the release of queryless telemetry exploration experiences for all four pillars of observability: metrics, logs, traces, and profiles.
We call these our Explore apps, and in this blog I’ll show you how they help us meet users where they are, so that everyone—from beginners to experts—can get value out of their telemetry data and realize the full potential of observability.
The full spectrum of approaches to telemetry investigations
With the release of our Explore apps for all four pillars of observability, users can now choose from three different options in Grafana to help them get insights from telemetry stored in Prometheus (or Mimir), Loki, Tempo, or Pyroscope.
Code. Query languages like PromQL, LogQL, and TraceQL are incredibly powerful. Users who are well versed in them can write queries that answer extremely specific and complex questions about the state of their systems. However, getting started can be tough, as the initial experience here is an empty text box with a blinking cursor.
Low code. Builder mode provides more of a visual programming experience. It’s a great way to pick up the query languages for those with limited experience that are curious to learn. It allows you to point and click to string together various operations, and provides guardrails to help avoid common mistakes (It won’t let you apply a sum before a rate!).
No code. This is where the Explore apps shine. Open up these UIs and you don’t see any query language whatsoever. Instead, you’ll drop into screens with already populated graphs. From there, you can click your way around to add more filtering criteria and group by attributes of interest.
Which one of these three you choose is completely up to you! We find the push-to-start, no-code experience of the Explore apps is particularly appealing to new users. But even some of our more veteran internal developers are switching over to the Explore apps because they find them a faster way to answer many of the most frequent questions they need to ask about their systems.
A closer look at the Explore apps
Getting developers to learn observability query languages is one of the biggest blockers to adopting observability. Developers want the benefits of observability but don’t want to learn an entire new language in order to realize them. They’re busy people, with lots of other things to do (like writing new features!).
This is also a huge blocker to switching among observability tools. Observability teams might be excited about the feature set of a new observability database, but the idea of having to teach their entire R&D organization a new query language in order to use it is daunting.
With the Explore apps, we’ve removed the need for any knowledge of a query language so anyone can immediately dive in and start making sense of the health of their software systems and infrastructure.
Explore Metrics and Explore Logs
We announced Explore Metrics and Explore Logs earlier this year. They allow you to navigate data stored in Prometheus or any Prometheus-compatible backends like Grafana Mimir (via Explore Metrics) or Grafana Loki (via Explore Logs) without having to write any PromQL or LogQL.
We’ve seen a ton of enthusiasm and adoption since then, and last month we promoted them to Generally Available status across all of our deployment modes: Grafana Cloud, Grafana Enterprise, and Grafana open source.
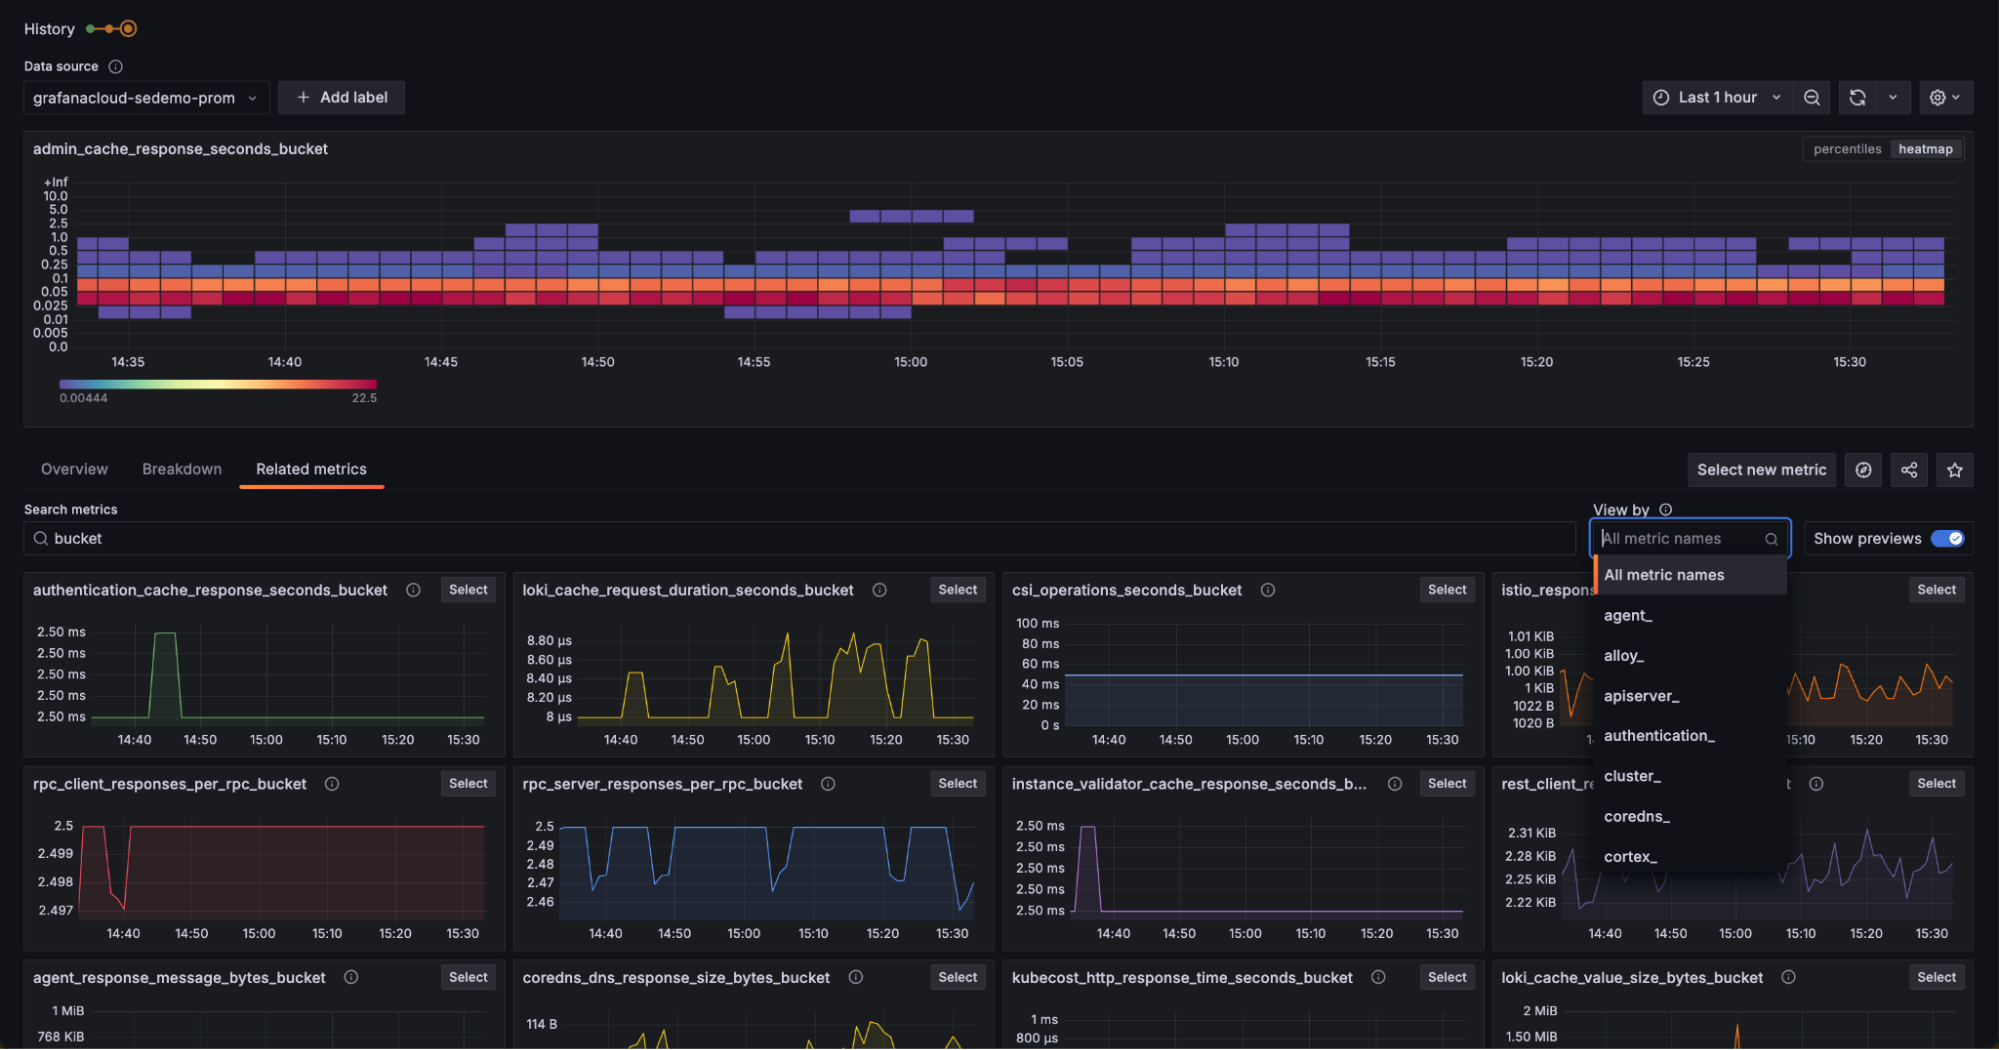
The shift to GA came with some notable updates. For example, we improved the “Related metrics” section in Explore Metrics, making it easier to filter by common metric name prefixes.
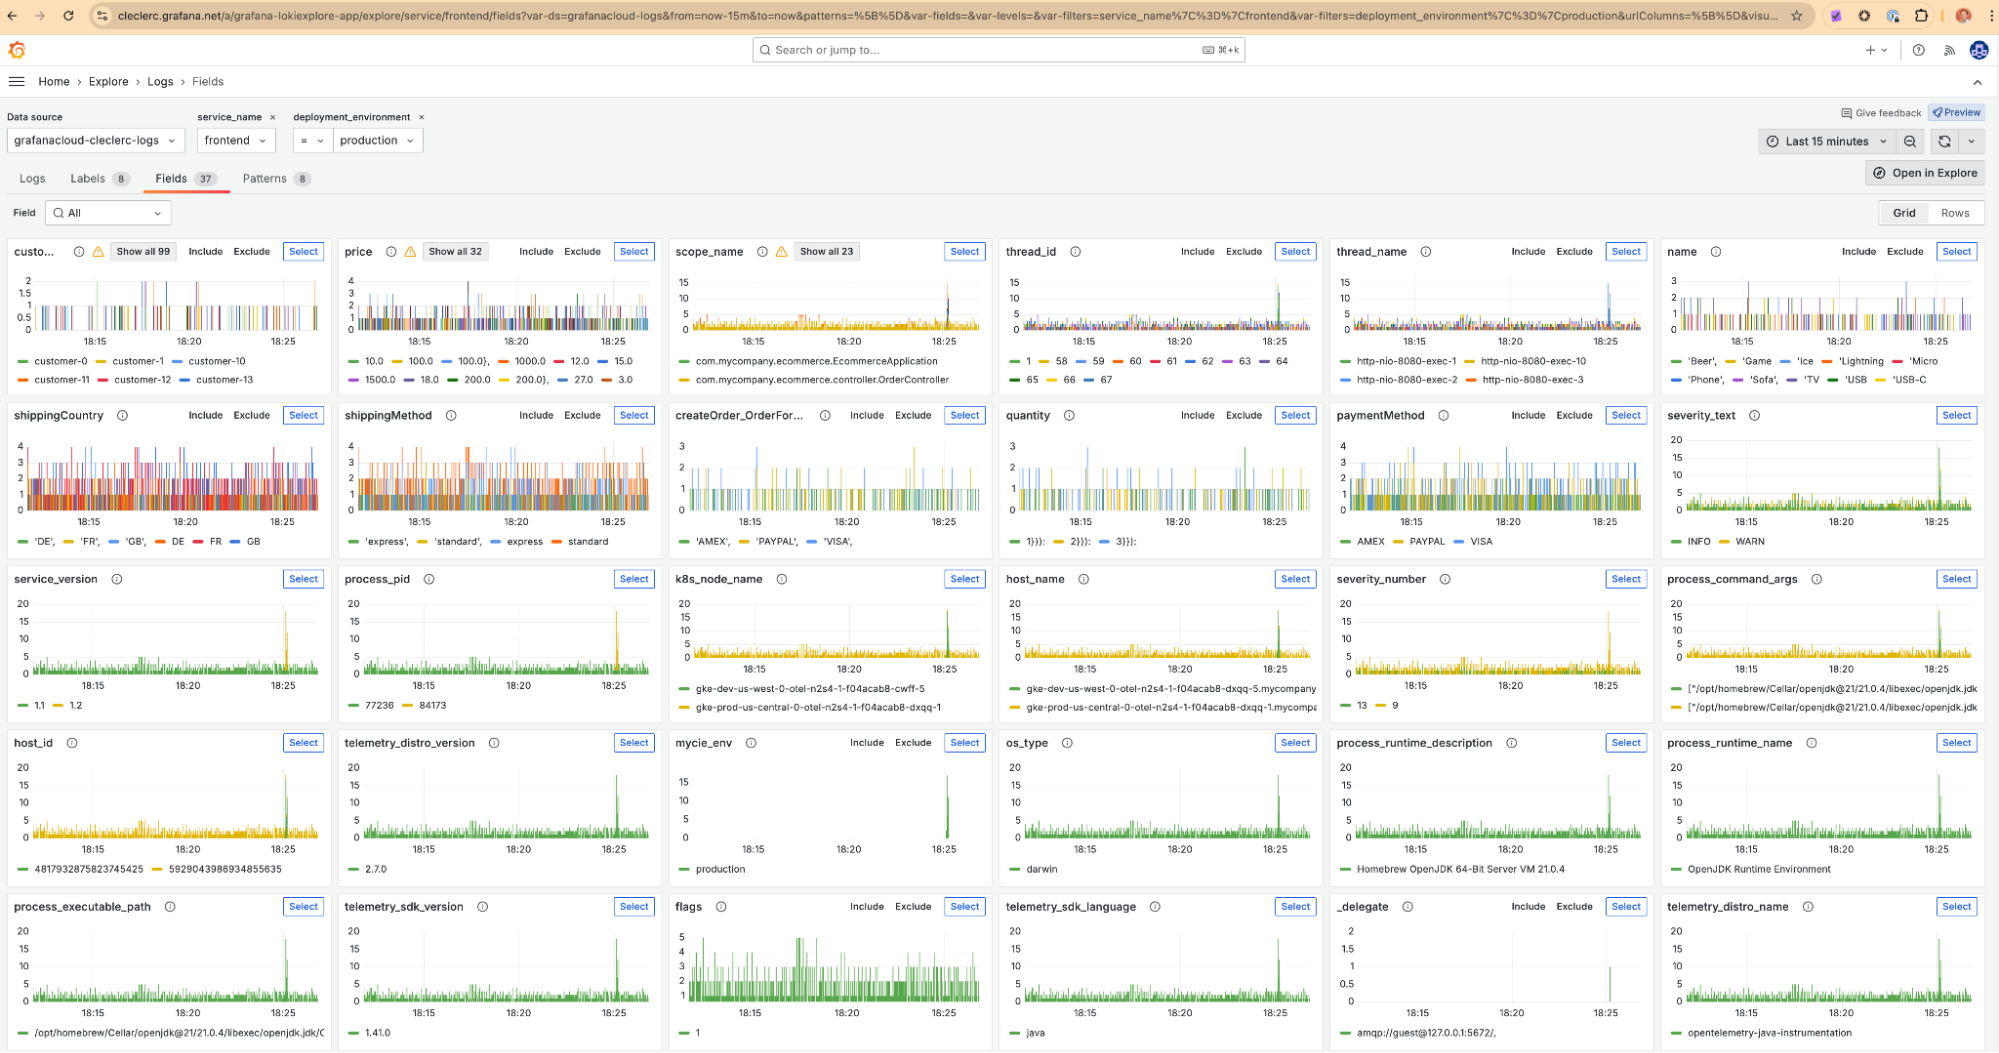
In Explore Logs, we added the ability to automatically visualize attributes stored in Loki’s structured metadata in the “Fields” tab. This is particularly useful for those using OpenTelemetry logging, since certain OTel attributes are better stored as structured metadata rather than in the index.
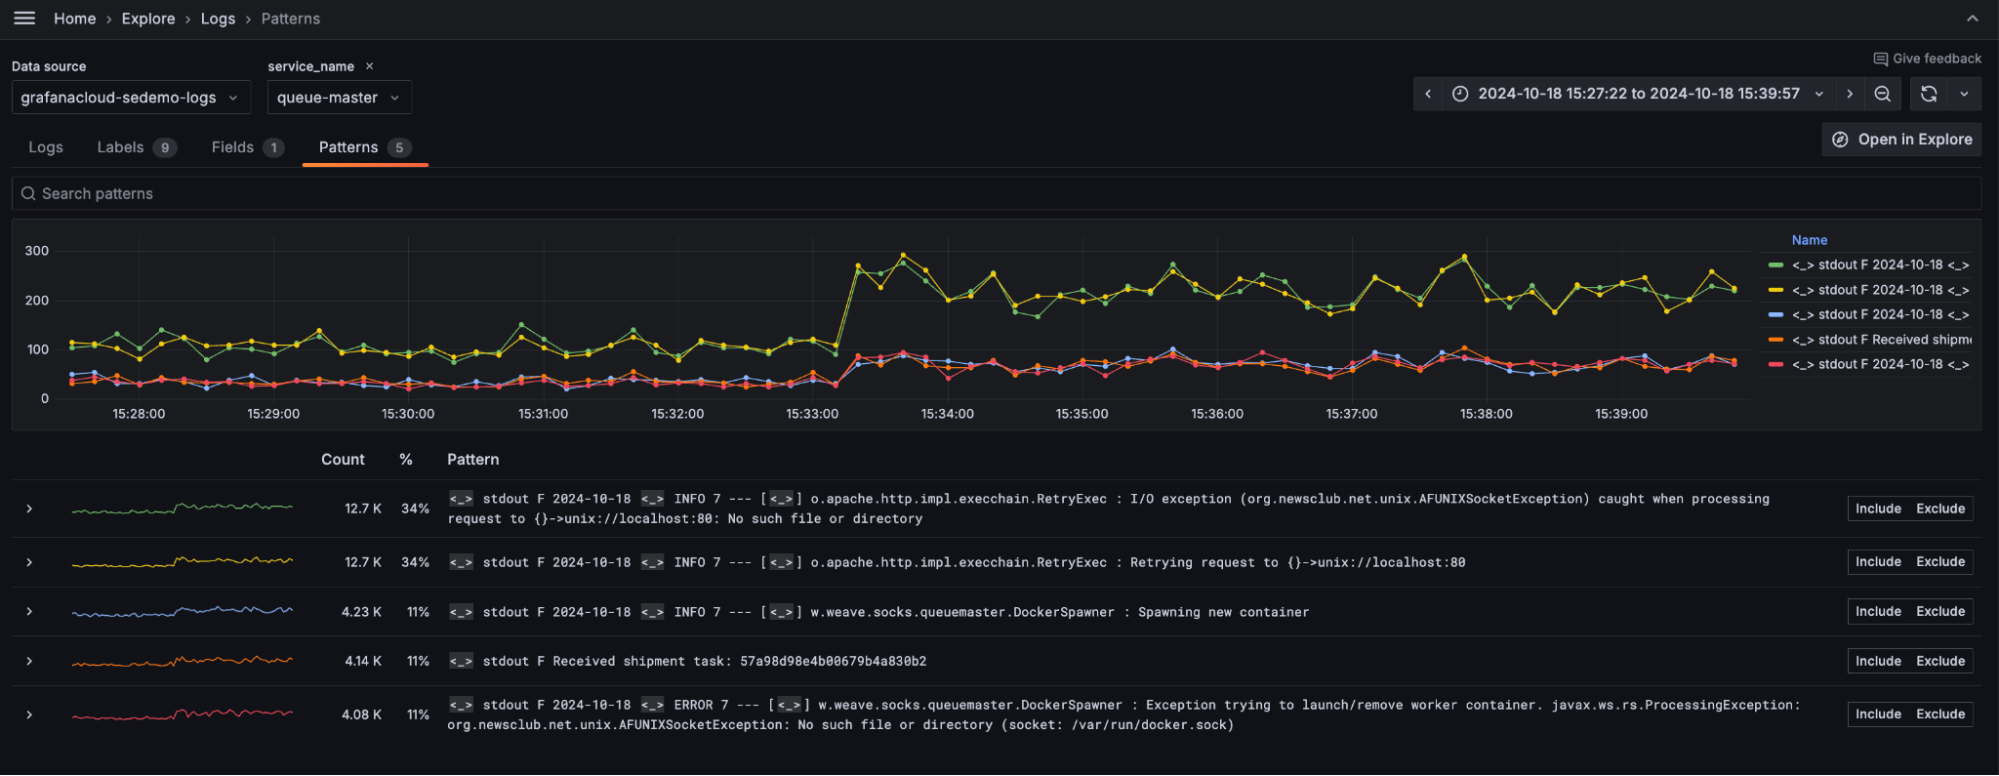
We’ve also tuned the Explore Logs pattern-detection functionality to quickly surface the most common patterns in your log lines, and to allow you to see which patterns have shown the most significant changes in frequency-of-occurrence.
And we’ll be making many more upgrades in the months ahead. In Explore Metrics, we’ll be adding support for higher-resolution, native histograms and upgrading the experience for working with metrics in OTel format. In Explore Logs, we’re adding streaming support both to the graphs of log volume over time and the log line panels so you spend less time waiting around for results.
Explore Traces and Explore Profiles
Following the success of Explore Metrics and Explorer Logs, we’ve extended that same experience to all the pillars of observability. Explore Traces and Explore Profiles are now available in Public Preview for Grafana Cloud, Grafana Enterprise, and Grafana OSS.
These new additions to the Explore apps suite bring the same queryless navigation to traces and profiles, enabling users to quickly assess what’s wrong. This is especially valuable for these two signals, since, in our experience, the average engineer is less familiar with how to use them than logs and metrics. As a result, they will disproportionately benefit from having an intuitive, point-and-click UI to help them get started.
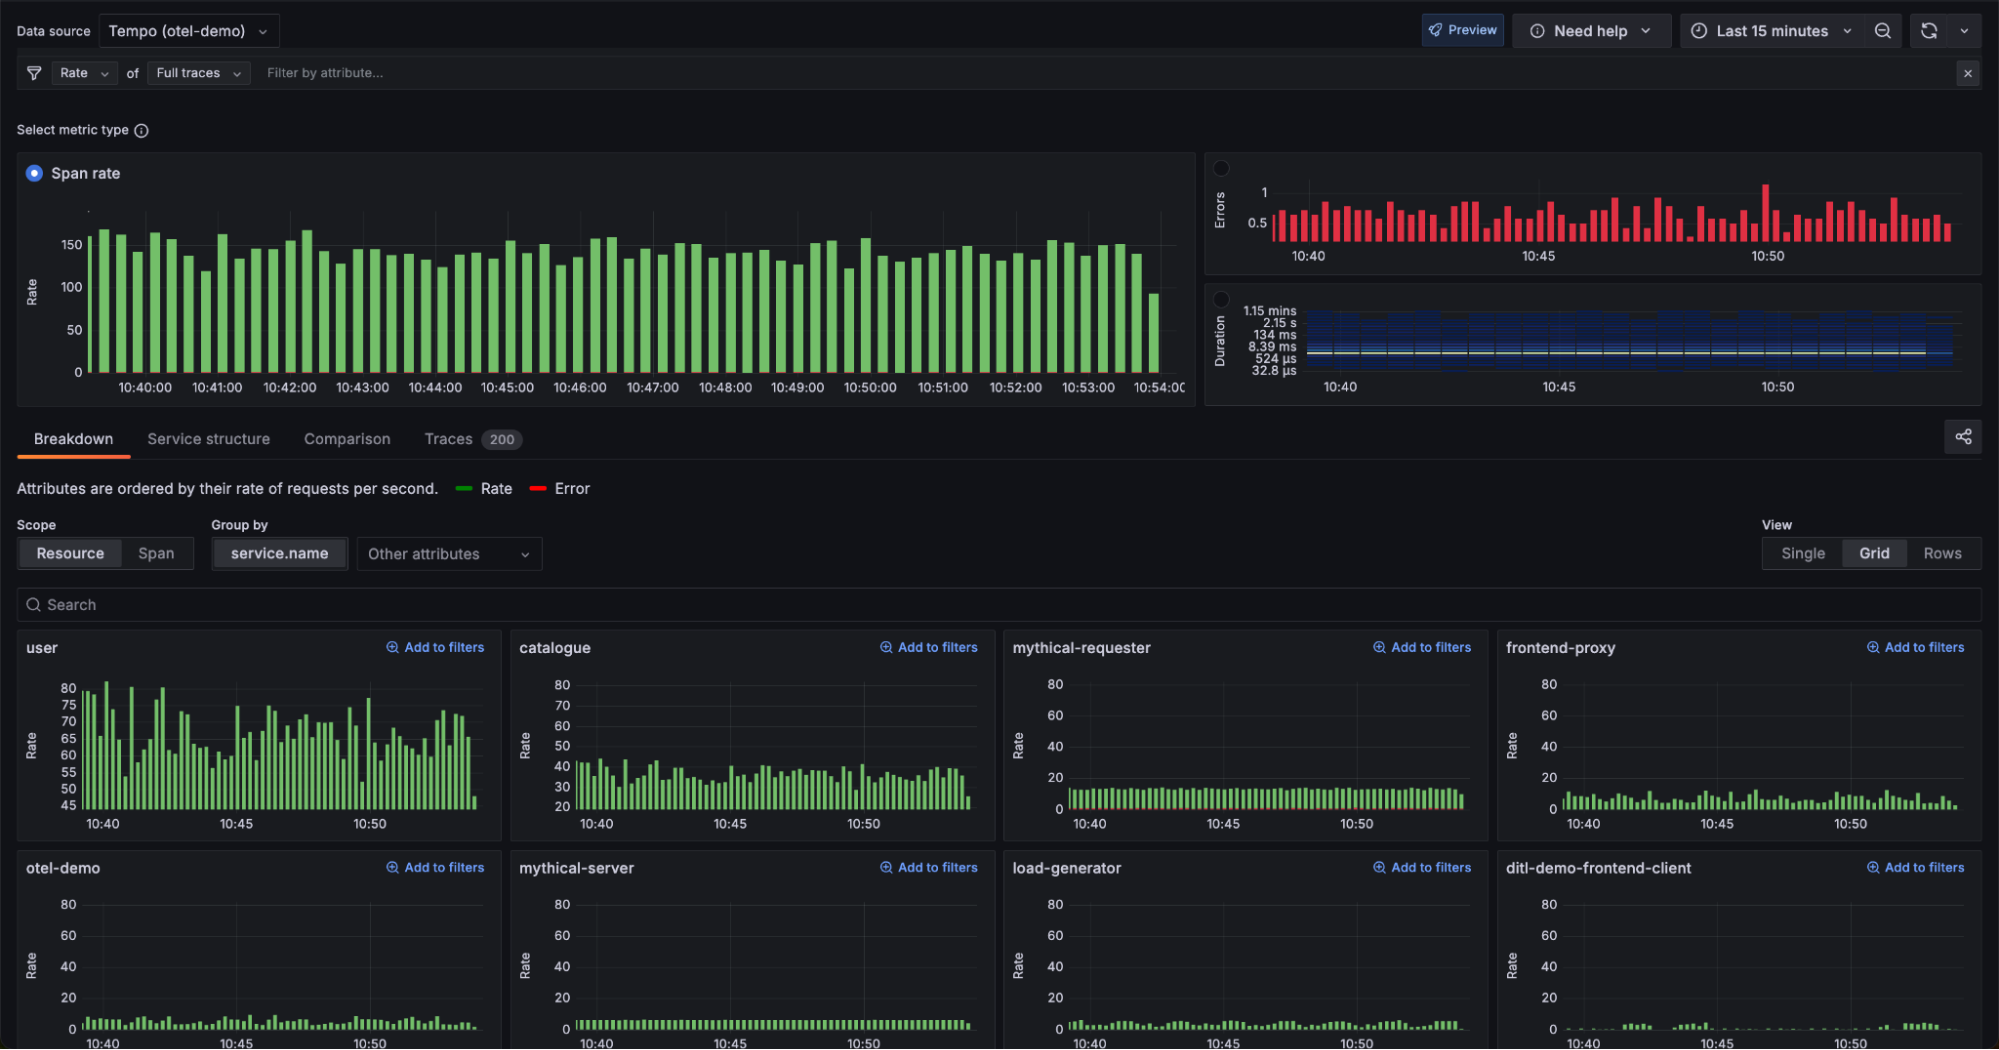
The Explore Traces landing page, for example, drops you into a familiar, RED-method view that shows request rate, error rate, and latency across all received traces. In the “Breakdown” tab, it groups these same quantities by service, so you can see how they differ from service to service.
One of the most exciting parts of Explore Traces is the “Comparison” tab. It allows you to compare a set of spans of interest to a baseline set on a per-attribute basis. You can quickly scan the page to pick out which attributes show the greatest variance between the baseline set and the selection set. This is a valuable debugging tool, since you’re often trying to answer questions like, “What is different between slow and/or erroring spans and normal spans?”
Take for example, the screenshot below. In this example the “selection” spans are all the erroring spans for the productcatalogservice seen in the last five minutes, and the “baseline” spans are all the non-erroring spans for that same service during that same time.
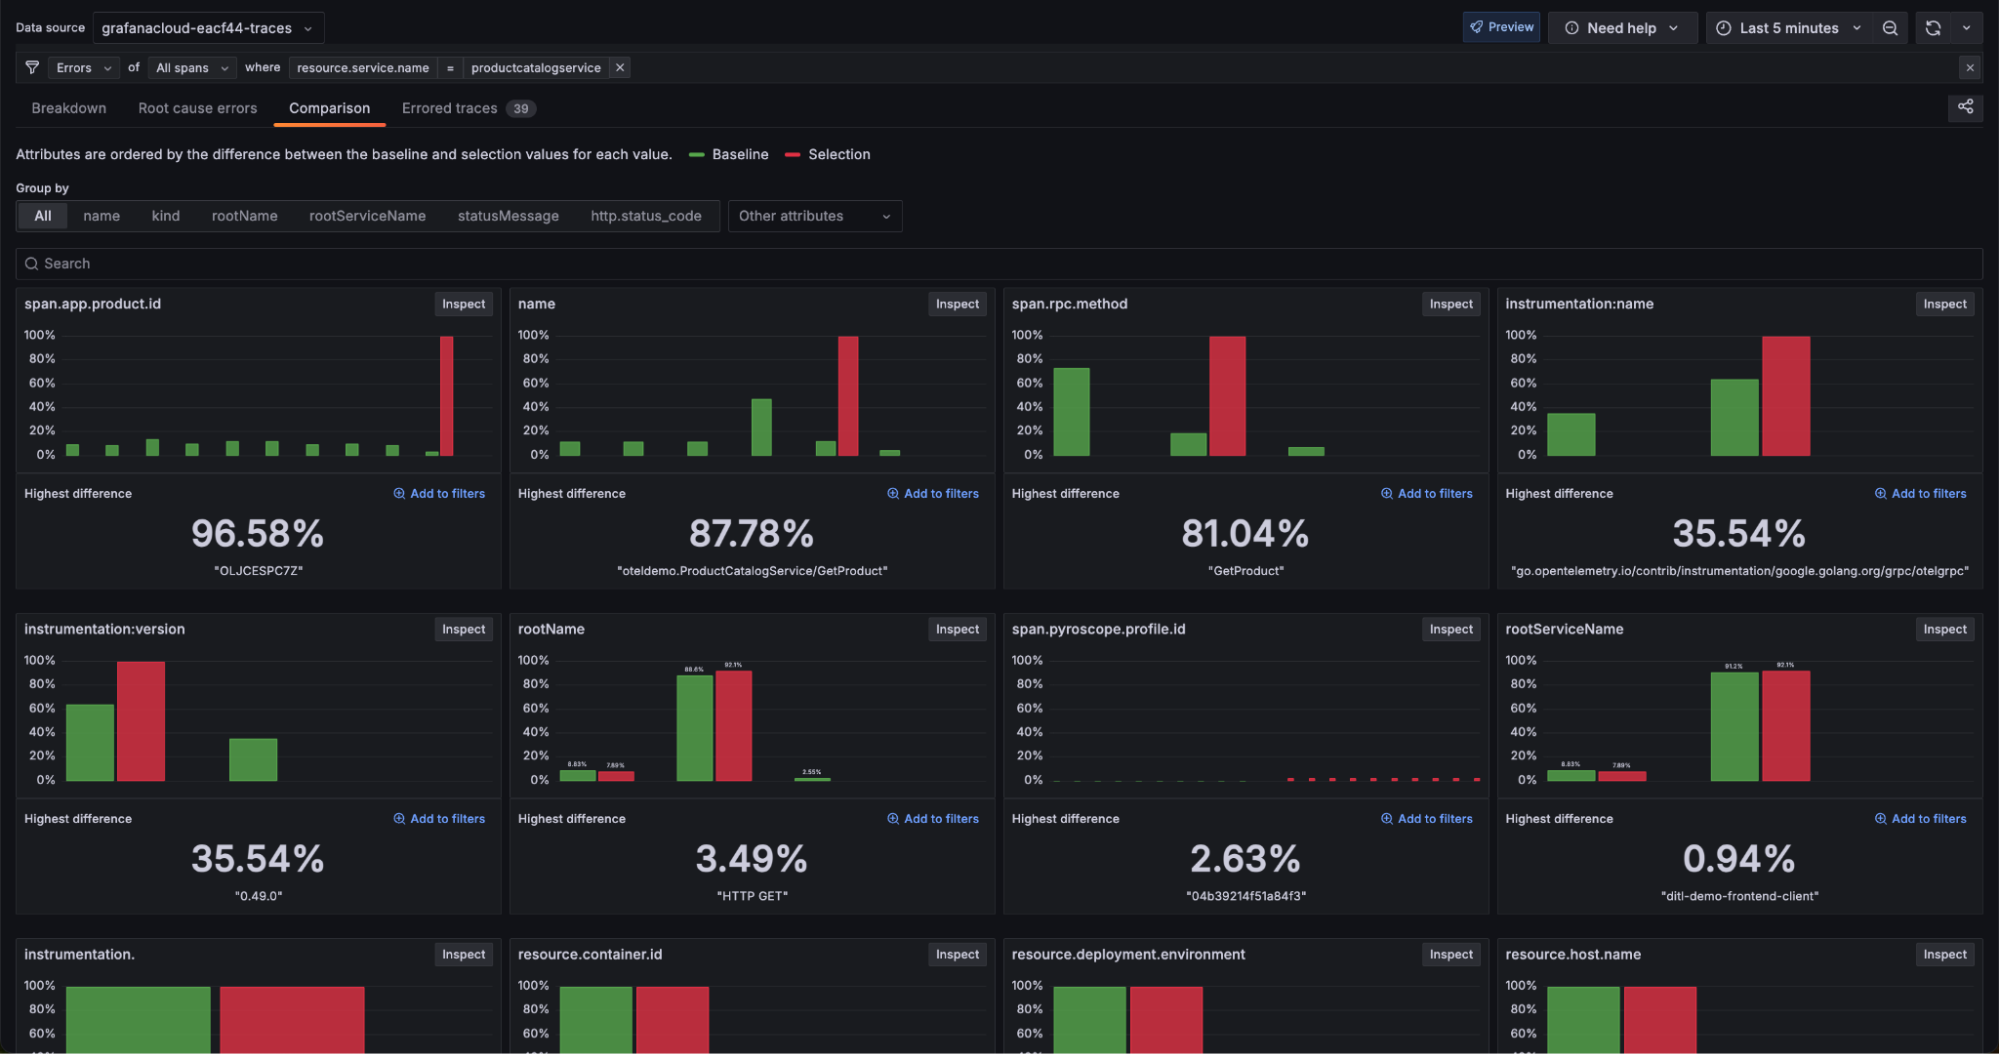
At a glance, you can see a comparison of the “selection” and “baseline” spans across all attributes on those spans, such as “product.id,” “instrumentation.version”, and “deployment.environment." Even better, the attributes that show the greatest differences are sorted to the top. By looking at the leftmost panel in the top level, I can easily see that all the erroring spans have the same product ID (OLJCESPC72). This would be an extremely helpful piece of information during a debugging process—allowing me to know that the errors are localized to a specific product ID, whereas all the other product IDs seem to be behaving as expected.
Explore Profiles brings the same queryless UI to navigating profiles stored in Grafana Pyroscope, our open source, highly scalable, distributed tracing database. While Grafana Cloud users have had access to a queryless UI since the original release of Grafana Cloud Profiles in August 2023, we’ve made numerous changes in the past few months. First, we revamped the landing page to provide a service-centric view, mirroring the design of Explore Logs and Explore Traces.
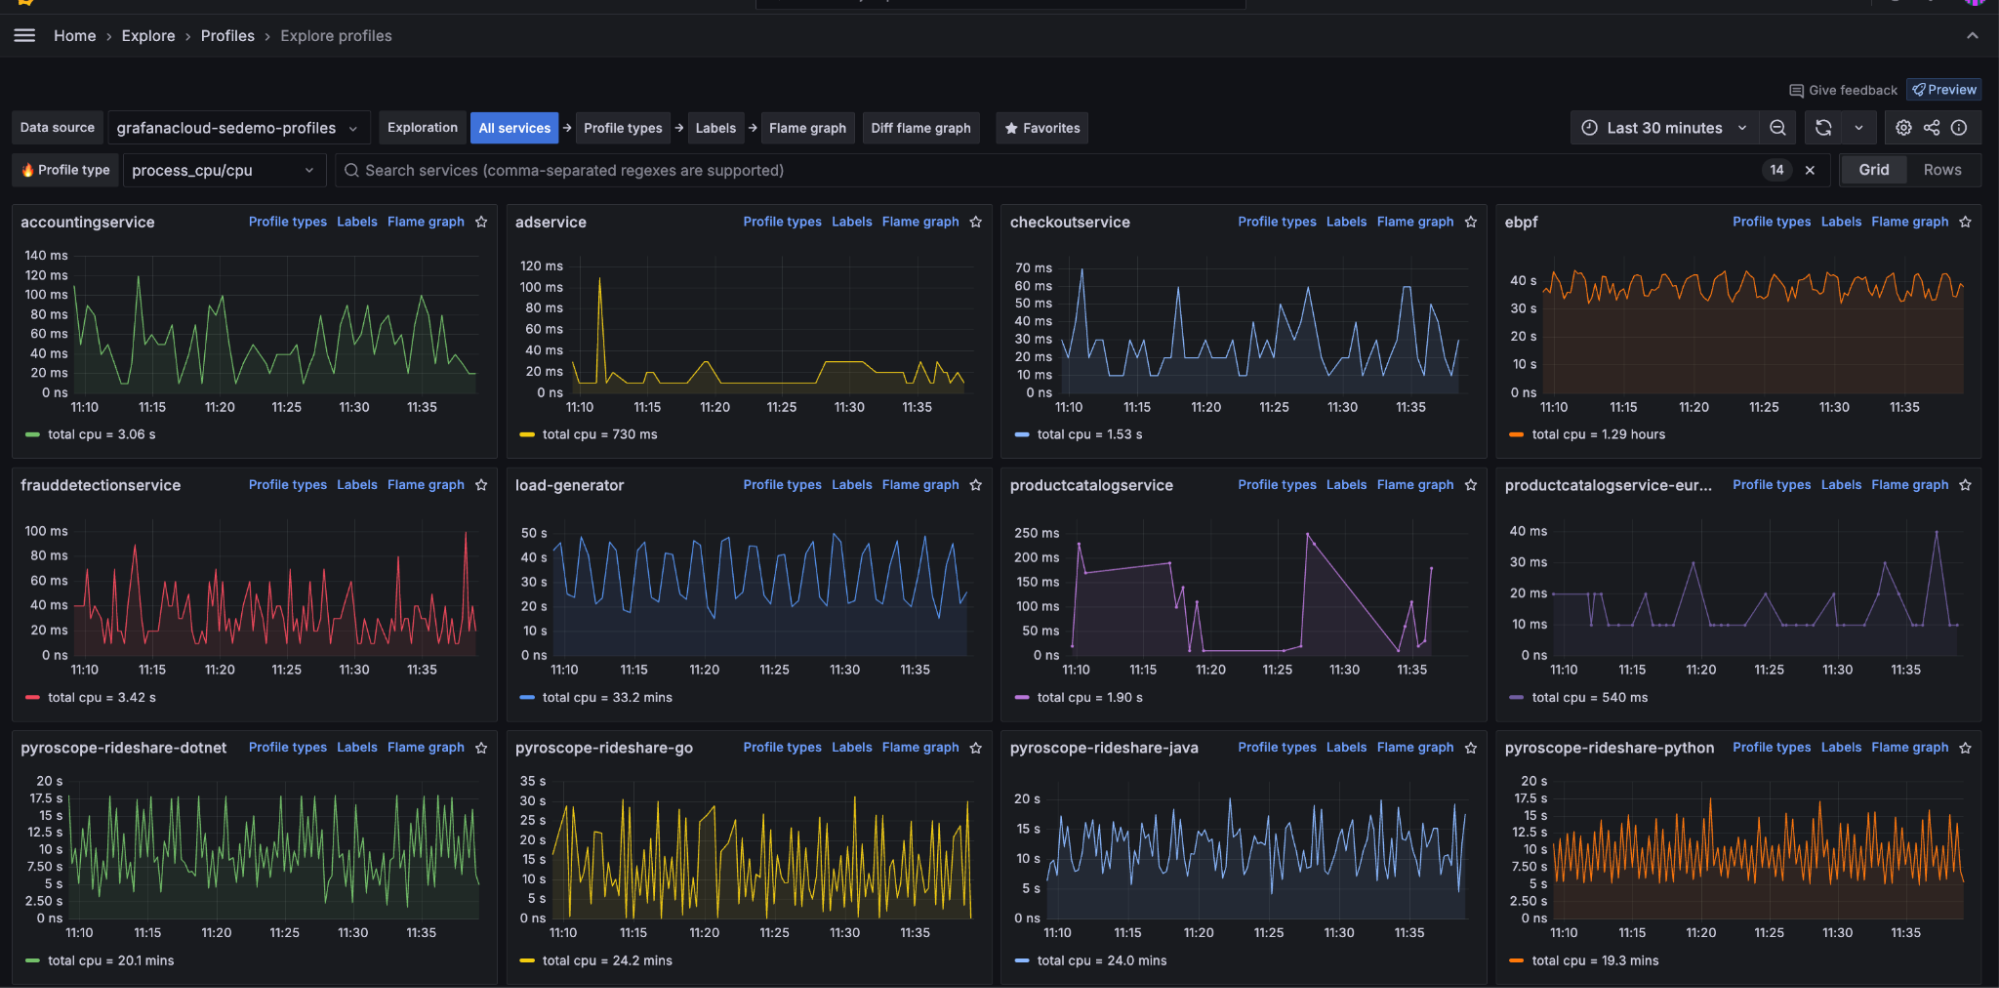
From there, we made it easy to drill into a particular service’s available profile types (e.g., CPU, memory) and labels (e.g., region, service_version, namespace). You can also go straight to the flame graph, which you can quickly make sense of with the help of our Flame graph AI.
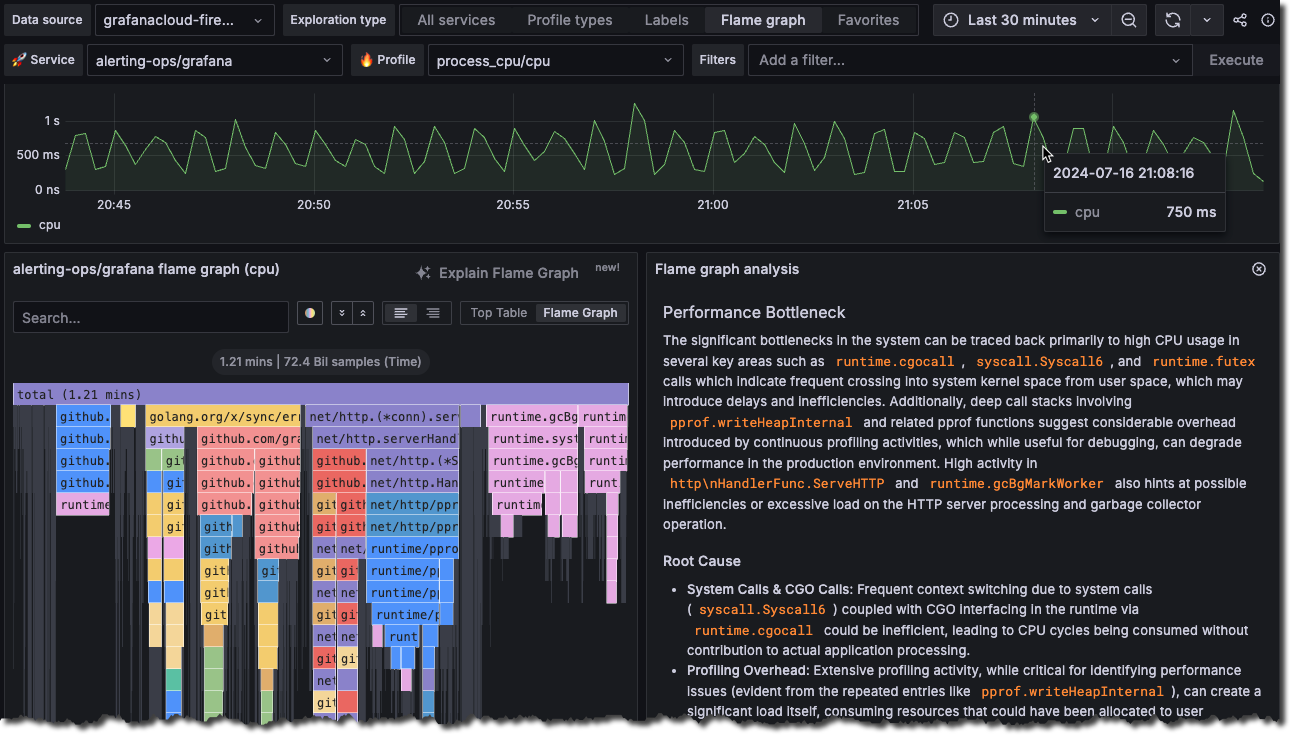
And lastly, we’ve made it available to our open source Pyroscope community, so that all Explore apps are now available across our Cloud, Enterprise, and open source offerings.
What’s next
We’ll be hard at work over the coming months testing and incorporating your feedback to get Explore Traces and Explore Profiles to the point that we’re ready to promote them to General Availability. At that point, all four apps will be in GA status.
But, for us, GA only marks the start of our journey! There’s so much more we know can be done to improve the experience of navigating your telemetry data, and to help you sort through the noise to get to the signal that much faster.
Have any feedback or ideas you want to share to help us get there? Reach out in our community slack or open an issue in GitHub (Explore Metrics, Explore Logs, Explore Traces, Explore Profiles).
Grafana Cloud is the easiest way to get started with continuous profiling, metrics, logs, traces, and dashboards. We have a generous forever-free tier and plans for every use case. Sign up for free now!


