Monitor your generative AI app with the AI Observability solution in Grafana Cloud
Generative AI has emerged as a powerful force for synthesizing new content—text, images, even music—with astounding proficiency. However, monitoring, optimizing, and maintaining the health of these complex AI systems is challenging, and traditional observability tools are struggling to keep pace.
At Grafana Labs, we believe that every data point tells a story, and every story needs a capable narrator. That’s why we’re excited to tell you about our newest feature: the AI Observability solution, powered by OpenLIT, an open source SDK.
A focus on generative AI use cases
The AI Observability solution is a Grafana Cloud integration designed to provide insights into gen AI use cases. It leverages OpenLIT, the open source SDK that has been engineered to monitor, diagnose, and optimize generative AI systems. This means you can now observe every nuance of your AI models, from performance bottlenecks to anomaly detection, all within the unified Grafana interface.
Key features and capabilities
Here are just some of the ways you can use AI Observability in Grafana Cloud:
- Performance monitoring: Track model performance metrics in real-time; analyze latency, throughput, and error rates; and visualize data with a pre-built dashboard.
- Cost optimization: Monitor cost consumption across large language model (LLM) applications, identify inefficiencies, and optimize resource allocation to manage expenses effectively.
- End-to-end tracing: Understand model predictions in greater detail, track data flow from input to output, and ensure comprehensive traceability.
- Prompt and response tracking: Monitor and analyze prompts and responses to evaluate prompt effectiveness and user interactions.
Who will benefit?
This feature is crafted for AI engineers, data scientists, DevOps professionals, and organizations leveraging gen AI to drive solutions. Whether you’re generating natural language responses, creating synthetics from data, or building intelligent content recommendations, monitoring these systems in real-time can elevate their reliability, efficiency, and performance.
Leveraging OSS for auto-instrumentation
By leveraging OpenLIT, we can provide auto-instrumentation for more than 30 gen AI tools, including LLMs, vector databases (vector DBs), and various frameworks like LangChain and LlamaIndex. The simple but powerful setup process lets you start gaining insights almost immediately.
The OpenLIT SDK generates OpenTelemetry traces and metrics, ensuring that this integration is OpenTelemetry-native. This not only facilitates smooth integration with existing systems but also adheres to industry standards for observability.
Real life example walk-through
Now that we’ve described what the AI Observability integration is, let’s take a look at how you can put it to work today.
Imagine that you’ve recently released several new LLM-powered features to your customers—say, features that help users write appealing item descriptions for their online store—and now you need to know:
- How many LLM requests are being made?
- Is the feature stable and responding quickly to users?
- If you re-write the prompts, can you tell if the new version is better?
- How much is this feature costing you? And more specifically, how much is each request costing you?
Getting started
In our hypothetical scenario, you’re already a Grafana Cloud customer (and if you aren’t, you can sign up for a forever-free account today), so you go ahead and set up the AI Observability integration to get some answers by following these steps:
- Log into your Grafana Cloud instance.
- In your Grafana interface, go to the Connections section.
- Use the search bar to find the “AI Observability” integration.
- Follow the steps provided to configure and initialize the AI Observability integration.
You can also refer to the quickstart, which is available in the AI Observability documentation.
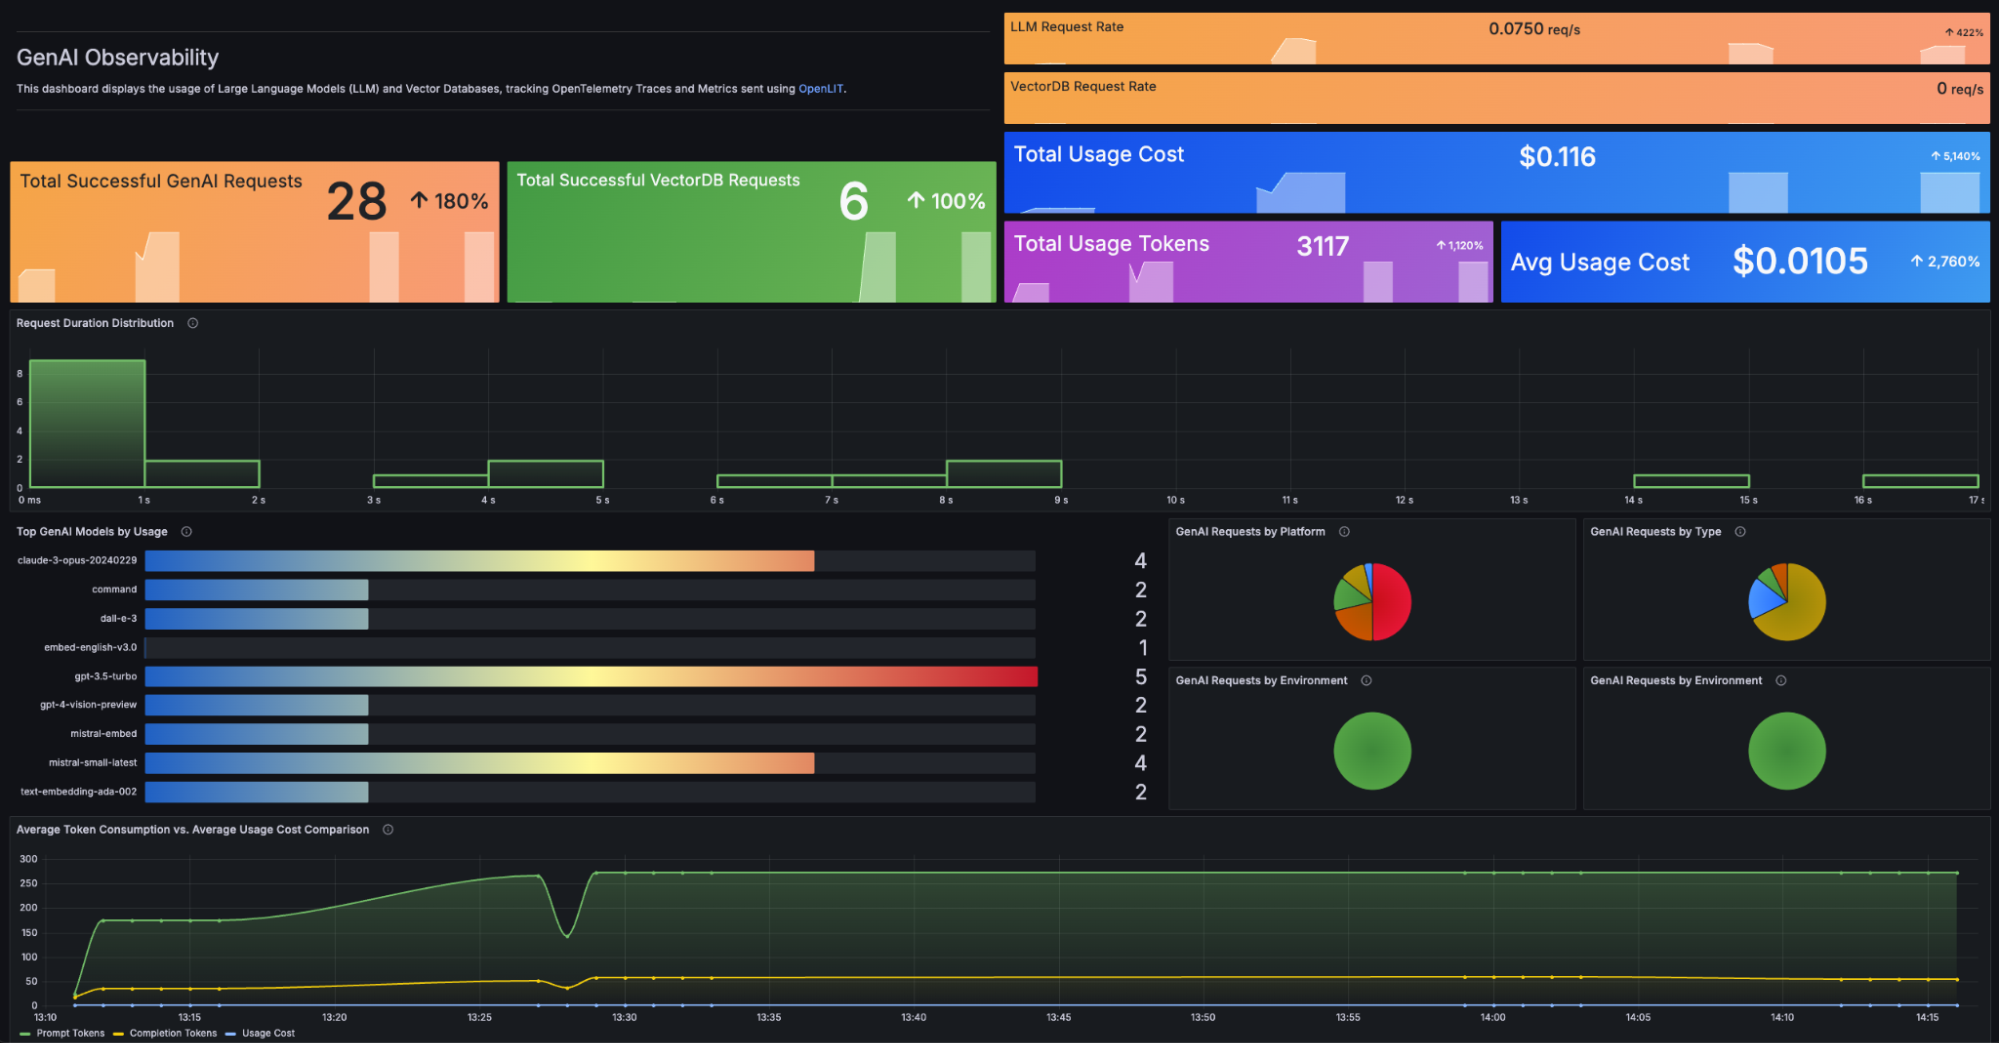
After you’ve walked through setting up monitoring and installing dashboards: go ahead and click View Dashboards and open the “GenAI Observability” dashboard:

How to get the most out of AI Observability
Now that you have everything set up, let’s get back to those questions you needed to answer about your new LLM-powered features.
At a high level, you can review overall usage (i.e., Are request rates rising or dropping?) to get some useful clues into whether your features are taking off or stalling out.
You can also keep an eye on the costs of your LLM service—total usage vs. average per-request— across all your models and types of calls, such as image generation or chat completions.
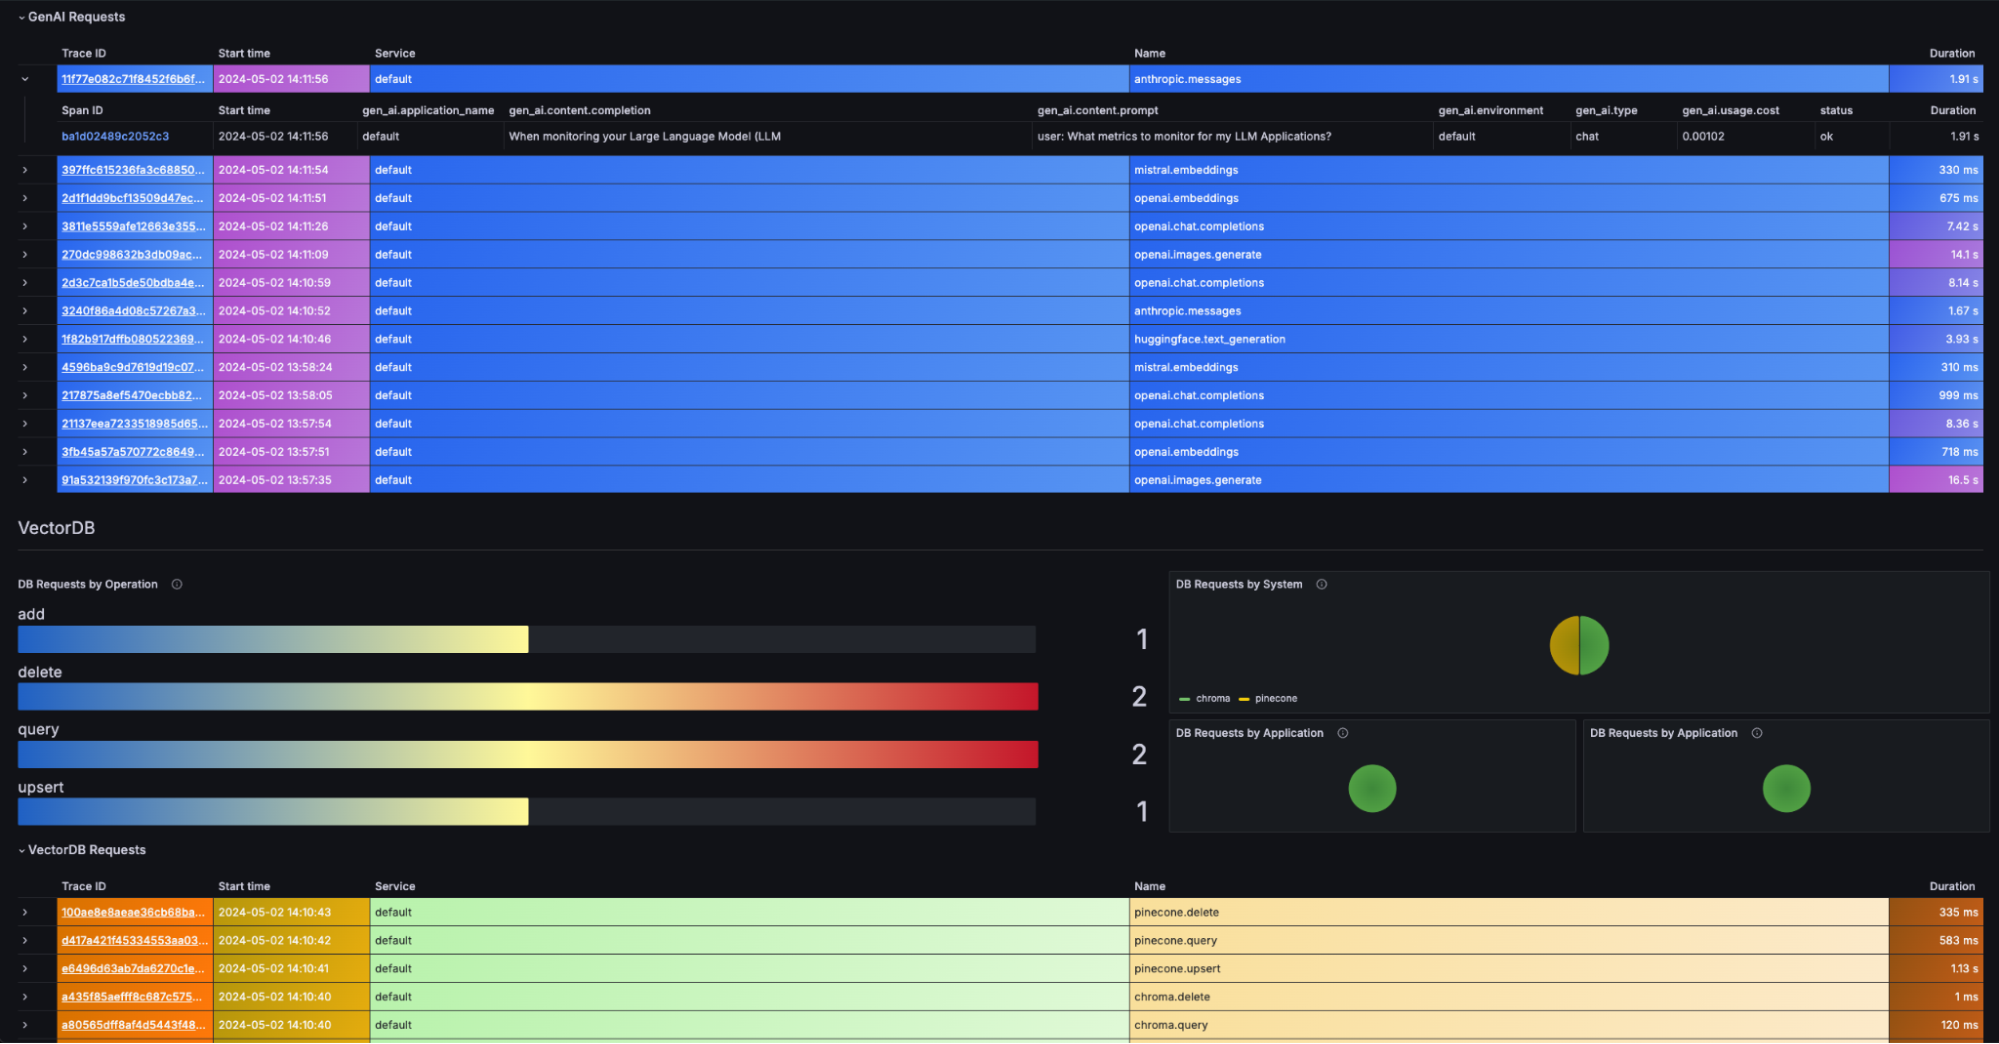
Next, let’s say you’re worried about increasing latency in an LLM application. Your pre-built dashboard includes a panel listing request details in the dashboard’s time range, so you can choose an example request with a high duration and click into the trace for full details—such as the original prompt and completion response.
With these details, you might try optimizing your prompt, or switching to a faster model.
There are similar request details and traces available for your vector DB calls as well:

Next steps
To learn more about how to get started, check out our AI Observability official documentation. You can also find more information about about LLM observability by checking out these other recent blog posts we’ve written:
- An Introduction to Observability for LLM-based applications using OpenTelemetry
- A complete guide to LLM observability with OpenTelemetry and Grafana Cloud
- A Guide to LLM Observability with OpenTelemetry
Grafana Cloud is the easiest way to get started with metrics, logs, traces, dashboards, and more. We have a generous forever-free tier and plans for every use case. Sign up for free now!


