

How to quickly configure Grafana Cloud Application Observability with Open Telemetry Operator
Monitoring application health is a lot like monitoring your personal health. Vital signs such as heart rate, blood pressure, and overall well-being can spot problems before they escalate, helping us maintain good health.
Similarly, application health requires constant monitoring of performance indicators like CPU usage, memory consumption, and application response times. As with personal health, when we feel symptoms of being unwell we take corrective actions—whether through rest, lifestyle changes, or medical intervention. Similarly when applications suffer outages, developers and SREs need to quickly assess root causes, impact and required modifications to prevent repeat service disruption.
When an application exhibits symptoms of instability or degradation such as unusual request rates, error spikes, and slow response times, SREs and developers need to address underlying issues rather than the symptoms themselves. Grafana Cloud Application Observability allows SREs, developers, and operators to quickly pinpoint issues in large distributed systems.
In this guide, we’ll provide a simple step-by-step tutorial of how to light up Application Observability and the Explore apps by way of the OpenTelemetry Operator and your Kubernetes cluster. In just 20 minutes, you’ll be able to automatically inject, configure, and package auto-instrumentation components with your apps in a fully “hands-off” manner.
What are common signals used in application health monitoring?
Which signals should you use to monitor application health? There are many to choose from, so let’s review.
- Metrics allow efficient and rapid insight into the what and the when (e.g., What service broke and at what time?).
- Logs can help decipher why an application experiences a problem (e.g., Why is this service experiencing errors?).
- Traces tell us where problems are occurring (e.g., Where in this distributed system are things failing?).
In a distributed system, knowing which service is in a degraded state may not be sufficient enough. In order to deliver precise root cause analysis you need to understand where in the distributed system things are failing. And this is where tracing offers valuable detail that neither metrics nor logging can offer.
Typically, traces need to be manually configured in the code, which can be a tedious and error-prone process. A solution to this challenge is zero-code/auto-instrumentation, which removes the need to insert custom code into your application to emit these signals. This approach greatly enhances productivity by automatically handling the instrumentation, saving you the hassle of writing and maintaining extra lines of code.
Despite the benefits of auto-instrumentation, many users are still hesitant to adopt it due to the upfront effort required. High-velocity DevOps teams prioritize automation, but configuring auto-instrumentation for applications typically involves multiple labor-intensive steps—such as adding SDKs, agents, or packages—that can introduce risks, errors, and misconfigurations. As a result, the natural tendency is for developers to avoid instrumentation altogether as the tedious nature of implementation outweighs the potential benefits.
The OpenTelemetry Operator addresses this by streamlining complex tasks by way of Kubernetes tooling. Developers can focus on delivering code instead of spending hours linking their code and images to specialized SDKs and agents.
Getting started
Now, you may be wondering if the OpenTelemetry Operator itself is easy to set up and configure, and that is a fair question! Next, we’ll show you how, with little effort, you can quickly enable this automation in your Kubernetes cluster in less than 20 minutes. Let’s get started!
Background
Before we get into how to set up auto-instrumentation, let’s first clarify what we’re talking about and why this can help you.
What is zero-code instrumentation?
Zero-code instrumentation is a code-free approach to instrument trace signals for apps.
Why use auto-instrumentation for OpenTelemetry?
You get an automated pathway to inject zero-code instrumentation into applications.
What is OpenTelemetry Operator?
OpenTelemetry Operator is a Helm chart you can use to deploy requisite resources into your Kubernetes cluster to enable auto-instrumentation.
How to set up auto-instrumentation
To properly implement the steps outlined in this guide, we’ll be working off of these assumptions and prerequisites:
A Grafana Cloud account (If you don’t have one, you can sign up for a forever-free account today!)
A Kubernetes cluster with kubectl or Helm available on your console
The Alloy Kubernetes Monitoring Helm chart deployed to your Kubernetes cluster
- Validate the metric, log, and trace signals are visible in Grafana Cloud
- Use the Explore apps to determine if these signals are flowing in correctly
Administrator access to all Kubernetes resources/objects
Proficiency with Kubernetes deployments and troubleshooting
K9S for easier Kubernetes navigation
Only use
defaultnamespace in your Kubernetes cluster to simplify the test
1. Deploy the OpenTelemetry Operator Helm chart
The OpenTelemetry Helm chart installs the OpenTelemetry Operator in your cluster so you can extend the Kubernetes API beyond the default installation.
helm repo add open-telemetry https://open-telemetry.github.io/opentelemetry-helm-charts
helm repo update

helm install opentelemetry-operator open-telemetry/opentelemetry-operator \
--set "manager.collectorImage.repository=OpenTelemetry/opentelemetry-collector-k8s" \
--set admissionWebhooks.certManager.enabled=false \
--set admissionWebhooks.autoGenerateCert.enabled=true
2. Deploy the Kubernetes Instrumentation CustomResource
This is a special object in Kubernetes that will describe to the OpenTelemetry Operator how to configure your app to ship data to the appropriate endpoint. In this case we’ll send it to Grafana Alloy, our vendor-neutral distribution of the OpenTelemetry Collector.
*Note: Please allow the OpenTelemetry Operator to fully install before you run this command, otherwise a “webhook” error will occur.*
You must replace the endpoint parameter with the appropriate Alloy OpenTelemetry protocol (OTLP) service endpoint. The one supplied below will work with a standard Kubernetes Monitoring Alloy Helm chart:
kubectl apply -f - <<EOF
apiVersion: opentelemetry.io/v1alpha1
kind: Instrumentation
metadata:
  name: demo-instrumentation
spec:
  exporter:
    endpoint: http://grafana-k8s-monitoring-alloy.default.svc.cluster.local:4317
  propagators:
    - tracecontext
    - baggage
  sampler:
    type: parentbased_traceidratio
    argument: "1"
EOF
If you want to learn more about this custom resource, check out the OpenTelemetry documentation on auto-instrumenting custom resources for Node.js services.
3. Deploy your app
Here we will “annotate” the app to instruct the OpenTelemetry Operator to inject the appropriate instrumentation packages/SDKs.
*Note: See the YAML section:
spec.template.metadata.annotations. To view a list of possible language annotations, click here.*
Run the following command to load the app into Kubernetes:
kubectl apply -f -  >>EOF
apiVersion: apps/v1
kind: Deployment
metadata:
  name: helloworld-nodejs-app
spec:
  replicas: 3
  selector:
    matchLabels:
      app: helloworld-nodejs-app
  template:
    metadata:
      labels:
        app: helloworld-nodejs-app
      annotations:
        instrumentation.opentelemetry.io/inject-nodejs: "true"
    spec:
      containers:
      - name: helloworld-nodejs-app
        image: 	ghcr.io/grafana/demos:helloworld-nodejs-app
        ports:
        - containerPort: 3030
        resources:
          requests:
            memory: "256Mi"
          limits:
            memory: "256Mi"
        env:

---
apiVersion: v1
kind: Service
metadata:
  name: helloworld-nodejs-app
spec:
  selector:
    app: helloworld-nodejs-app
  ports:
    - protocol: TCP
      port: 80
      targetPort: 8080
  type: LoadBalancer
EOF
4. Validate your deployment in K9S or kubectl
You have two options for validating your deployment.
The first option is to use K9S (download here). It’s a graphical frontend to kubectl that allows you to easily navigate Kubernetes’ state.
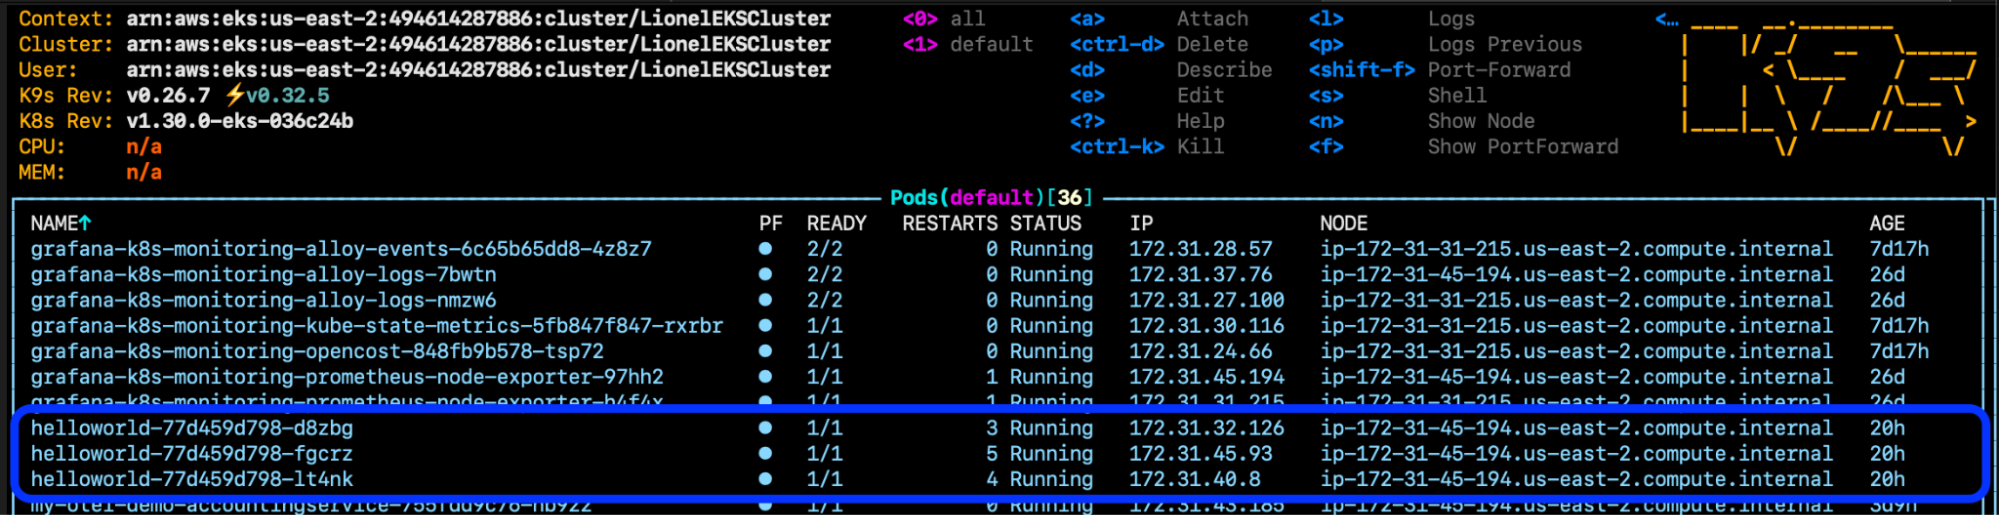
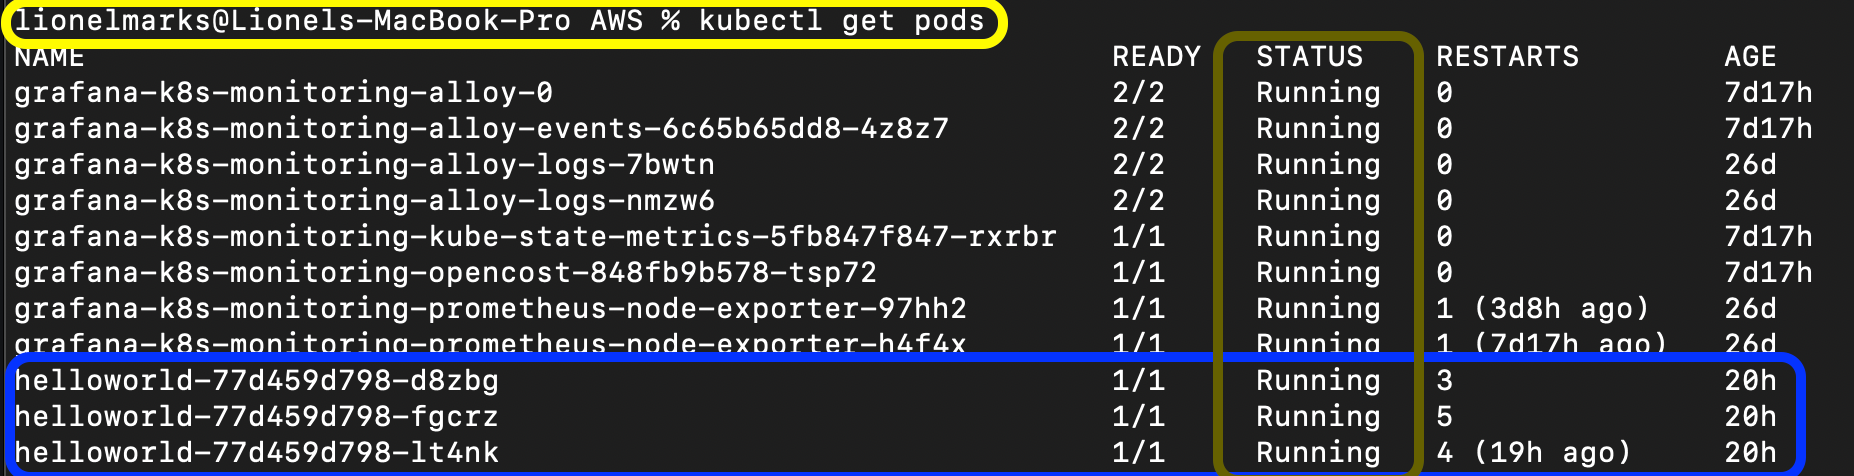
Alternatively, kubectl can also be used to evaluate the state of your pods with commands such as:
kubectl get pods- The
STATUScolumn for the app should be listed as “Running”
5. Be patient
Go grab a snack or take a sunshine break as it can take up to two minutes for your services to appear in Grafana Cloud Application Observability, our out-of-the box solution to monitor applications and minimize mean time to resolution.
Troubleshooting Steps
Once you’ve gone through those steps, you’ll need to check that the pods for your “Hello, World!” app are running and not showing errors.
If there are errors hit “d” in K9S or kubectl describe deployment helloworld-app in kubectl to see the configuration state of these pods. Relay this info to a Kubernetes expert to understand what is breaking. Or use an AI chatbot to research the errors.
Next, review Kubernetes events to see if the auto-instrumentation containers are being provisioned as side-cars to your app.
kubectl get events | grep auto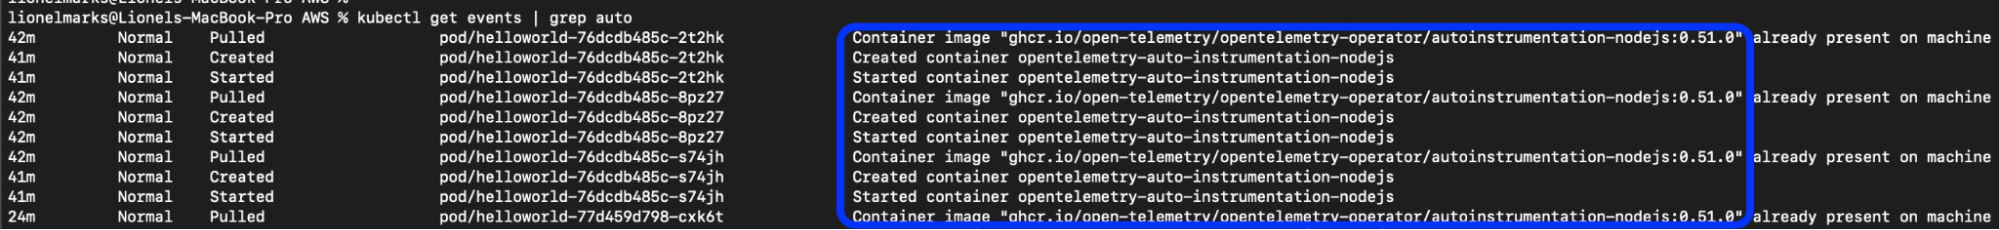
More comprehensive troubleshooting steps are available here.
Optional: add annotation to the namespace
Suppose every app uses the same runtime in a namespace. You can add the auto-instrumentation annotations directly to the namespace. This is very convenient if you’re attempting to enforce tracing for all the apps in a CI/CD pipeline.
Using this method, any app deployed into the namespace will be auto-instrumented with this specified annotation.
Note: This may not be desired if apps in the namespace use different runtimes, in which case annotate the deployment manifests for each app in their deployment YAML and do not use this method.
To do so, run these commands sequentially:
    kubectl create namespace helloworld-nodejs-app
    kubectl create annotation instrumentation.opentelemetry.io/inject-nodejs="default/demo-instrumentation" -n helloworld-nodejs-app
If you’ve gone through these steps and want to learn more about auto-instrumentation, be sure to check out Grafana Beyla, our next-generation, eBPF-based application auto-instrumentation tool to easily get started with Application Observability.
Grafana Cloud is the easiest way to get started with metrics, logs, traces, dashboards, and more. We have a generous forever-free tier and plans for every use case. Sign up for free now!


