

Visualize Atlassian Statuspage, Cloudflare, and Netlify data: what’s new in Grafana Enterprise data source plugins
As part of our big tent philosophy here at Grafana Labs, we believe you should be able to access and derive meaningful insights from your data, regardless of where that data lives.
One of the ways we stay true to that philosophy is through our Enterprise data sources. Available in Grafana Enterprise and Grafana Cloud, including in our generous free-forever tier, Enterprise data source plugins allow you to connect to external systems from within Grafana, so you can visualize data from a wide range of sources using the Grafana dashboards you already know and love.
We currently offer more than 30 Enterprise data sources, and continue to expand our line-up so you can connect to and visualize all your go-to data sources.
In this blog, we highlight three Enterprise data sources we’ve recently rolled out — Atlassian Statuspage, Cloudflare, and Netlify — and how you can get started visualizing your data today.
Atlassian Statuspage
Atlassian is a software development platform that helps agile teams plan, track, and release applications — and closely collaborate along the way. Part of that platform is Atlassian Statuspage, a tool that helps organizations inform their users about service outages, scheduled maintenance, or other incidents.
Now, with the Atlassian Statuspage Enterprise data source, you can quickly and easily visualize data related to outages, maintenance windows, incidents, and more. Specifically, you can perform the following queries on your Statuspage data:
Summary:Get a status rollup for the whole page, including incident indicators such as none, minor, major, or critical, as well as descriptions like “all systems operational” or “partial system outage.”Status:View the overall operational status of the page.Components:See a list of all page components — which are the separate infrastructure or functional parts of your service — along with their status, such as operational, degraded_performance, partial_outage, or major_outage.Unresolved incidents:See a list of any unresolved incidents. The endpoint will return incidents in the investigating, identified, or monitoring state.All incidents:Get a list of the 50 most recent incidents, including all unresolved incidents as described above, plus those that are resolved or in postmortem.Upcoming scheduled maintenances:See a list of any upcoming maintenance periods (i.e., those that are still scheduled).Active scheduled maintenances:View a list of any active maintenance work (i.e., any scheduled maintenances that are in-progress or verifying).All scheduled maintenances:Get a list of the 50 most recent scheduled maintenances, including those described in the above two bullet points, plus those that have completed.
To learn more about our Atlassian Statuspage data source, which is currently in public preview, check out our technical docs.
Cloudflare
With the Cloudflare Enterprise data source, also in public preview, you can query and visualize data from Cloudflare, the web application security and performance platform, within Grafana dashboards.
The data source currently allows you to query two Cloudflare services:
- DNS analytics: With Cloudflare DNS analytics, you can access critical data about your Domain Name System. By querying this service, you can retrieve a list of summarized aggregate metrics, such as average response time, over a given time period or grouped by time interval.
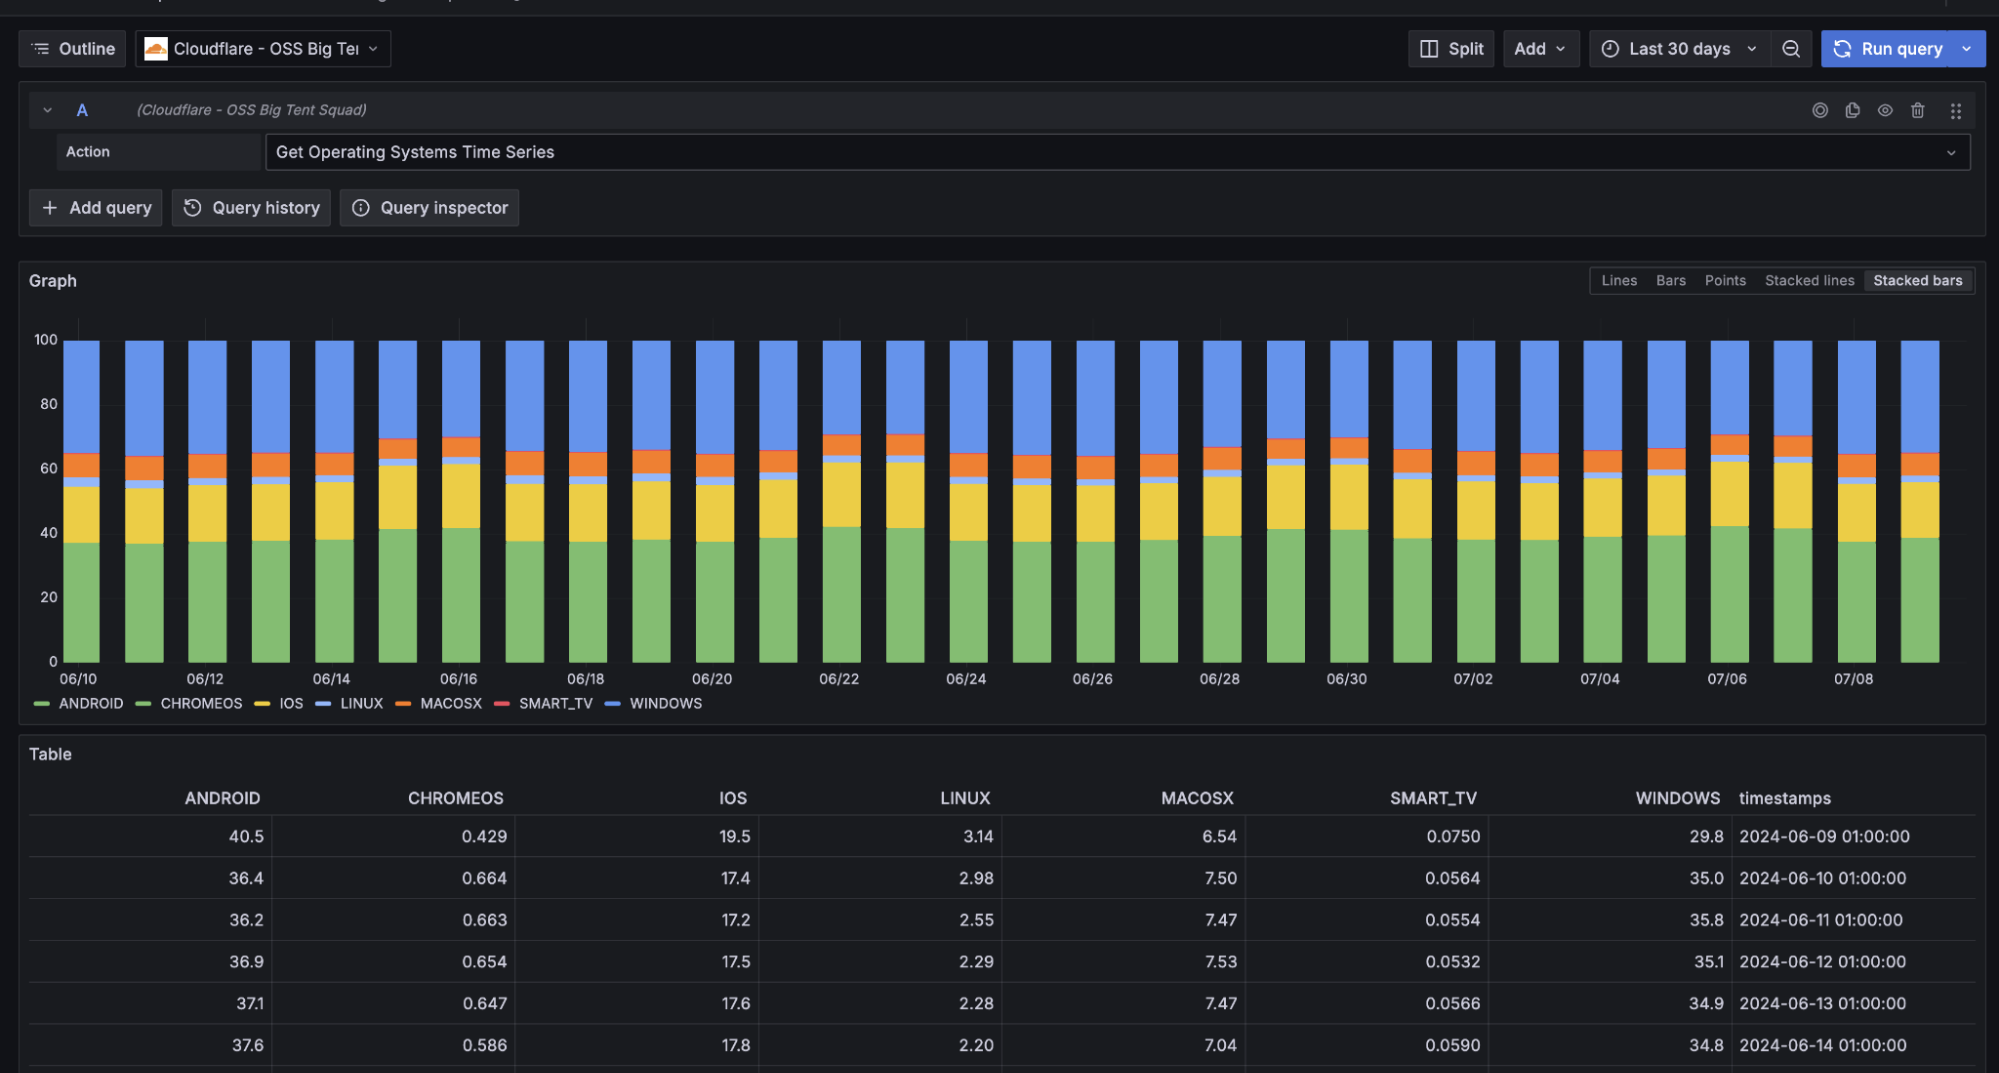
- Radar: Cloudflare Radar, a service powered by data from Cloudflare’s global network, is a hub that showcases global internet traffic, attacks, and technology trends. With the Grafana Cloudflare data source, you can query various Radar datasets via the Radar API — for example,
Get HTTP Protocols Summary/Time SeriesandGet Operating Systems Summary/Time Series.
You can learn more about the Cloudflare Enterprise data source in our technical docs.
Netlify
It’s now possible to visualize data from Netlify — a platform for building, deploying, and scaling modern web applications — in Grafana using the Netlify Enterprise data source.
The query editor allows you to perform the following queries:
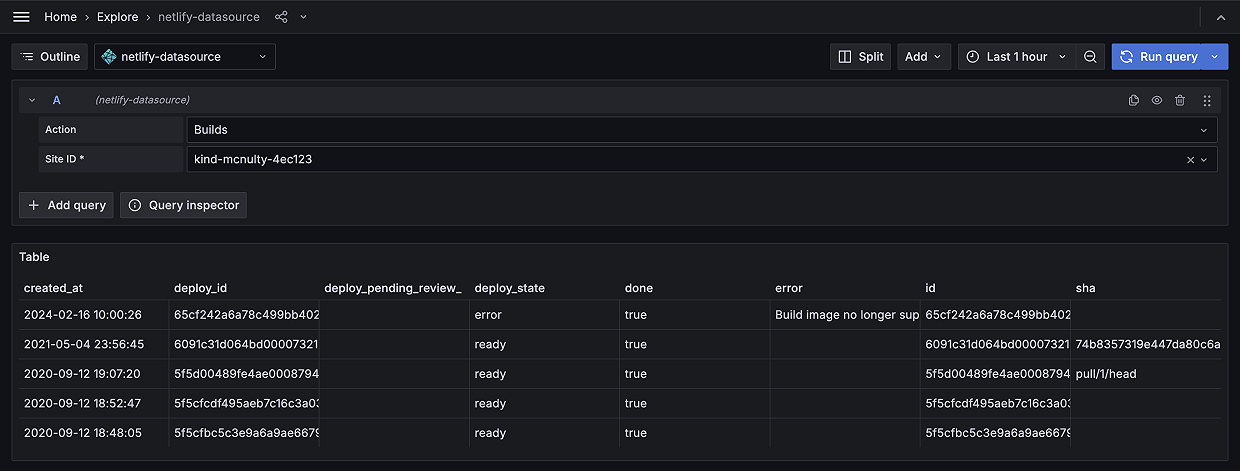
Sites: View information related to all the sites within your Netlify account, including their unique identifier, name, domain, build settings, and other configuration details.Builds: See details related to each of your builds, including build ID, state (e.g., building, ready, or failed), commit information, and timestamps for when the build started and finished.Deploys: View data on each deploy, including deploy ID, deploy context (e.g., production or staging), the state of the deploy (e.g., ready or error), and the URL of the deployed site.SSL certificates: Get details about your sites’ SSL certificates, including the certificate ID, domain names, expiration date, and status, helping to ensure secure connections.List site forms: See info related to the forms you created on your Netlify sites, including the form ID, name, submission count, and settings.Form submissions: See details related to each form submission, such as submission ID, form ID, submission data, and timestamps.Account build status: Get an overview of the build status across your entire Netlify account, including key info related to build quotas, so you can monitor your account’s build usage.
The Grafana Enterprise data source for Netlify is currently in public preview. You can learn more about it in our documentation.
We want to hear from you
We recently created a new public roadmap for data source plugins being built by Grafana, our partners, and our community. All Grafana users can now see our current plans for plugin development, as well as request new plugins, upvote existing requests, or comment with ideas and requirements. Have an idea? Reach out today!
The easiest way to get started with our Enterprise data source plugins is in Grafana Cloud. We have a generous forever-free tier that includes access to Enterprise data sources for 3 active users. If you haven’t already, sign up for free today!


