
How to use Prometheus to efficiently detect anomalies at scale
When you investigate an incident, context is everything.
Let’s say you’re working on-call and get pinged in the middle of the night. You open the alert and it sends you to a dashboard where you recognize a latency pattern. But is the spike normal for that time of day? Is it even relevant? Next thing you know, you’re expanding the time window and checking other related metrics as you try to figure out what’s going on.
It’s not to say you won’t find the answers. But time is of the essence in these scenarios, so having that context at your fingertips can be the difference between a quick resolution and a protracted trip down an incident rabbit hole.
To address this problem here at Grafana Labs, we developed an anomaly detection framework based solely on PromQL. It’s working great for us so far—both internally for our own debugging and externally as part of Grafana Cloud Application Observability—and now we’re excited to share it with you!
In this blog post, which is based on our recent PromCon talk, we’re going to walk through how we developed this dependable, open source framework and how you can start putting it to use today.
How we approached building an anomaly detection framework
There are multiple ways to address anomaly detection, but we needed our framework to adhere to these principles:
- No external systems. It had to be Prometheus-compatible to work with Grafana Mimir. And while it’s possible to use an external tool to fetch data from Prometheus and write back to it, we wanted this to work with just the built-in Prometheus functionality so anyone can use it without needing external dependencies.
- Performant at scale. We manage all our metric data in Mimir, as well as multi-tenant instances for our Grafana Cloud users, so we needed the framework to operate at a very high scale.
- No magic. It had to be something we could explain to each other and the rest of our coworkers. It also needed to be something we could confidently trust to do the job.
These were our constraints, but we think this approach will resonate with a wider audience than just Grafana Labs. In fact, the framework will work with any Prometheus-compatible metrics backend.
Establishing baselines: a first attempt
We began with the same formula (based on the z-score formula) that most everyone starts with for anomaly detection:
Baselines = average ± stddev * multiplier
This formula is so popular because it helps establish a middle line—typically a moving average that follows your trends—and define the upper and lower bands of behavior so that everything outside those bands is considered an anomaly.
To implement this, we used Prometheus recording rules. Let’s look briefly at how we defined each component.
Average
Selecting the time window was the biggest choice we had to make here, since there’s a tradeoff between how much your middle line is lagging behind your metric and the smoothing factor you have to apply.

We found that one hour was the sweet spot, as the system is tuned for short-term anomaly detection (large deviations in small time frames). Here’s how we applied that recording rule:
- record: avg_1h
  expr: avg_over_time(metric[1h])
Standard deviation
Prometheus has a std_over_time function, and we chose a larger time window here so we could incorporate as much information as possible to come up with bands that actually adapt to fluctuations in your metric:
- record: stddev_26h
  expr: stddev_over_time(metric[26h])
We typically use 24 hours for these types of things, but we chose 26 instead to give users a bit more headroom. For example, if you have something that happens every 24 hours, you might get strange patterns where your bands start contracting or expanding. Or maybe it’s Daylight Savings Time, and the organic patterns shift as a result. The extra two hours gives us the buffer so we get more accurate predictions.
Multiplier and final formula
The multiplier is part of the tuning parameters: a higher number results in wider bands and less sensitivity, while a lower number would lead to more sensitivity. The typical multiplier is two or three, depending on the use case, and we found two was the best fit here.
- record: stddev_multiplier
  expr: 2
Taken together, here is how we expressed that initial formula as a recording rule:
- record: upper_band_st
  expr: avg_1h + stddev_26h * on() group_left stddev_multiplier
Note: When you do multiplication in Prometheus, it will try to match the labels on the left and right sides. We use
group_leftto tell Prometheus to ignore labels since we don’t have any on the right side of the equation.
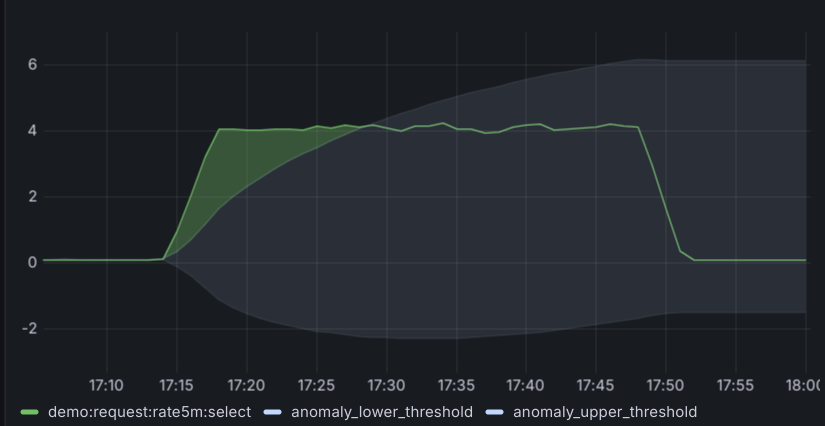
The panel above is the result of our first attempt to build this framework. And it looked pretty good: there was a spike and as you can see by the green shaded area, we’ve detected an anomaly and our bands (the gray area) have expanded to adapt to the increased variability in the data.
We were pleased with that initial attempt, but we ran into several issues when we used this framework in production.
Overcoming challenges
Next, let’s walk through how we addressed these problems presented by our initial attempt.
Extreme outliers
Because the standard deviation formula squares the differences, it can grow much faster than the average. As a result, extreme spikes can cause your bands to expand rapidly and you stop detecting anomalies, essentially rendering your system useless.

We needed to control the rate at which those bands expanded, so we added a smoothing function to address the trade off between band sensitivity and false positives. We did so with these recording rules:
- record: stddev_1h
expr: stddev_over_time(metric[1h])- record: stddev_st
expr: avg_over_time (stddev_1h[26h])Low sensitivity
The smoothing function did what we wanted, but it also resulted in a bit of an overcorrection. The bands were too narrow and not sensitive enough, which could lead to lots of false positives since the bands didn’t capture the normal fluctuations.

This, again, comes back to standard deviation. When you have a stable period and a standard deviation close to zero, the bands don’t expand fast enough. You end up with watered down data sets that combine periods of high and low variability, so we filtered out those low variability periods:
- record: stddev_1h:filtered
  expr: |
   stddev_over_time(metric[1h])
   > ?????
Coming up with the threshold in that last line of the recording rule was a bit of a challenge. We want this framework to work for any metric, but different metrics have different magnitudes. For example, if you have a 10 request per second metric and you add five requests, that’s a big leap. But if you add that same number to a metric for 1,000 requests per second, it’s probably insignificant. To adapt to the threshold, we used a statistical concept known as coefficient of variation:
- record: threshold_by_covar
expr: 0.5- record: stddev_1h:filtered
expr: |
stddev_over_time(metric[1h])
> avg_1h * on() group_left threshold_by_covarThe result was a good compromise between sensitivity and smoothness:

Discontinuities
The filtering of low variability periods created another challenge, since extended windows of stable performance would essentially filter out everything.

To address this, we introduced a new band that complements the one we just defined. It’s based on the average, and its purpose is to define the minimum width we’re willing to accept:
- record: margin_multiplier
expr: 2- record: margin_upper_band
expr: avg_1h + avg_1h * on() group_left margin_multiplierThis creates a much more defined band that help set the minimum upper and lower margins. And from there, we combine both bands.
- record: upper_band
  expr: |
   max(
     margin_upper_band or
     upper_band_st
   )
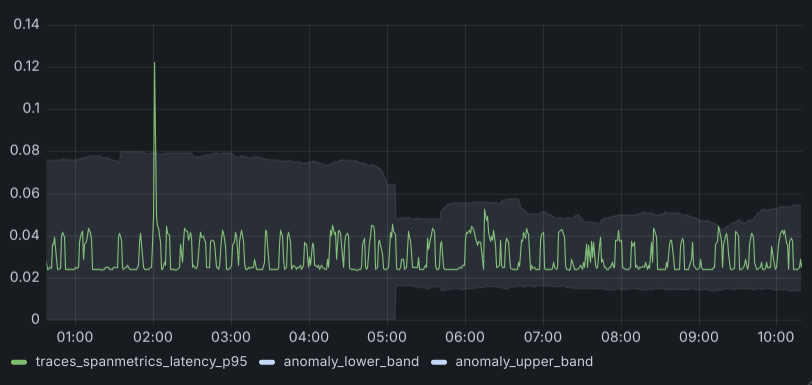
The result of combining those bands looks like this:
Long-term recurrent patterns
This last scenario we had to accommodate for was seasonality such as cron jobs or any other spike that happens the same time every week. This was a relatively easy fix with this recording rule, which used the same formula we used earlier, but with a smaller time window:
- record: upper_band_lt
  expr: |
    avg_1h offset 23h30m
    + stddev_1h offset 23h30m * on() group_left stddev_multiplier
This rule looks back at past behavior to predict future behavior and expand the bands before we hit any spike. It’s a simple solution, but we found it works really well in practice.

Taken collectively, we are now defining three bands:
- record: upper_band
  expr: |
   max(
     margin_upper_band or
     upper_band_st
     upper_band_lt
   )
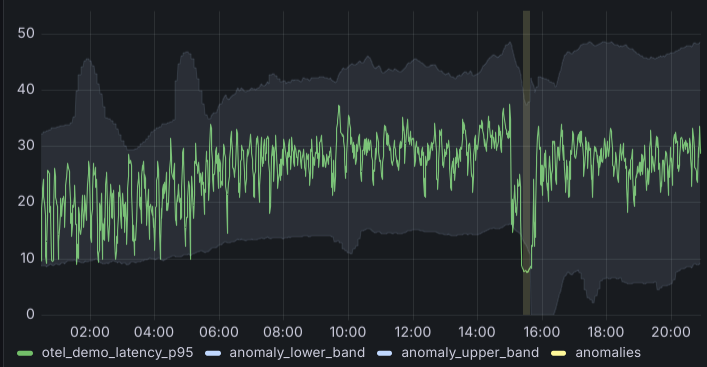
And we end up with a graph that looks like this:
How you can use the framework for your systems
The rules we just described make up the building blocks of a reusable framework that works for any metric. All you need to do is add the recording and alerting rules to your Prometheus instance, then tag the metric:
- record: anomaly:request:rate5m
  expr: sum(rate(duration_milliseconds_count[5m])) by (job)
  labels:
    anomaly_name: "otel_demo_requests”
    anomaly_type: ”requests”
You’ll need to replace the anomaly_name entry with your metric’s unique identifier. You can also pick from one of four default types: request, latency, errors, and resource.
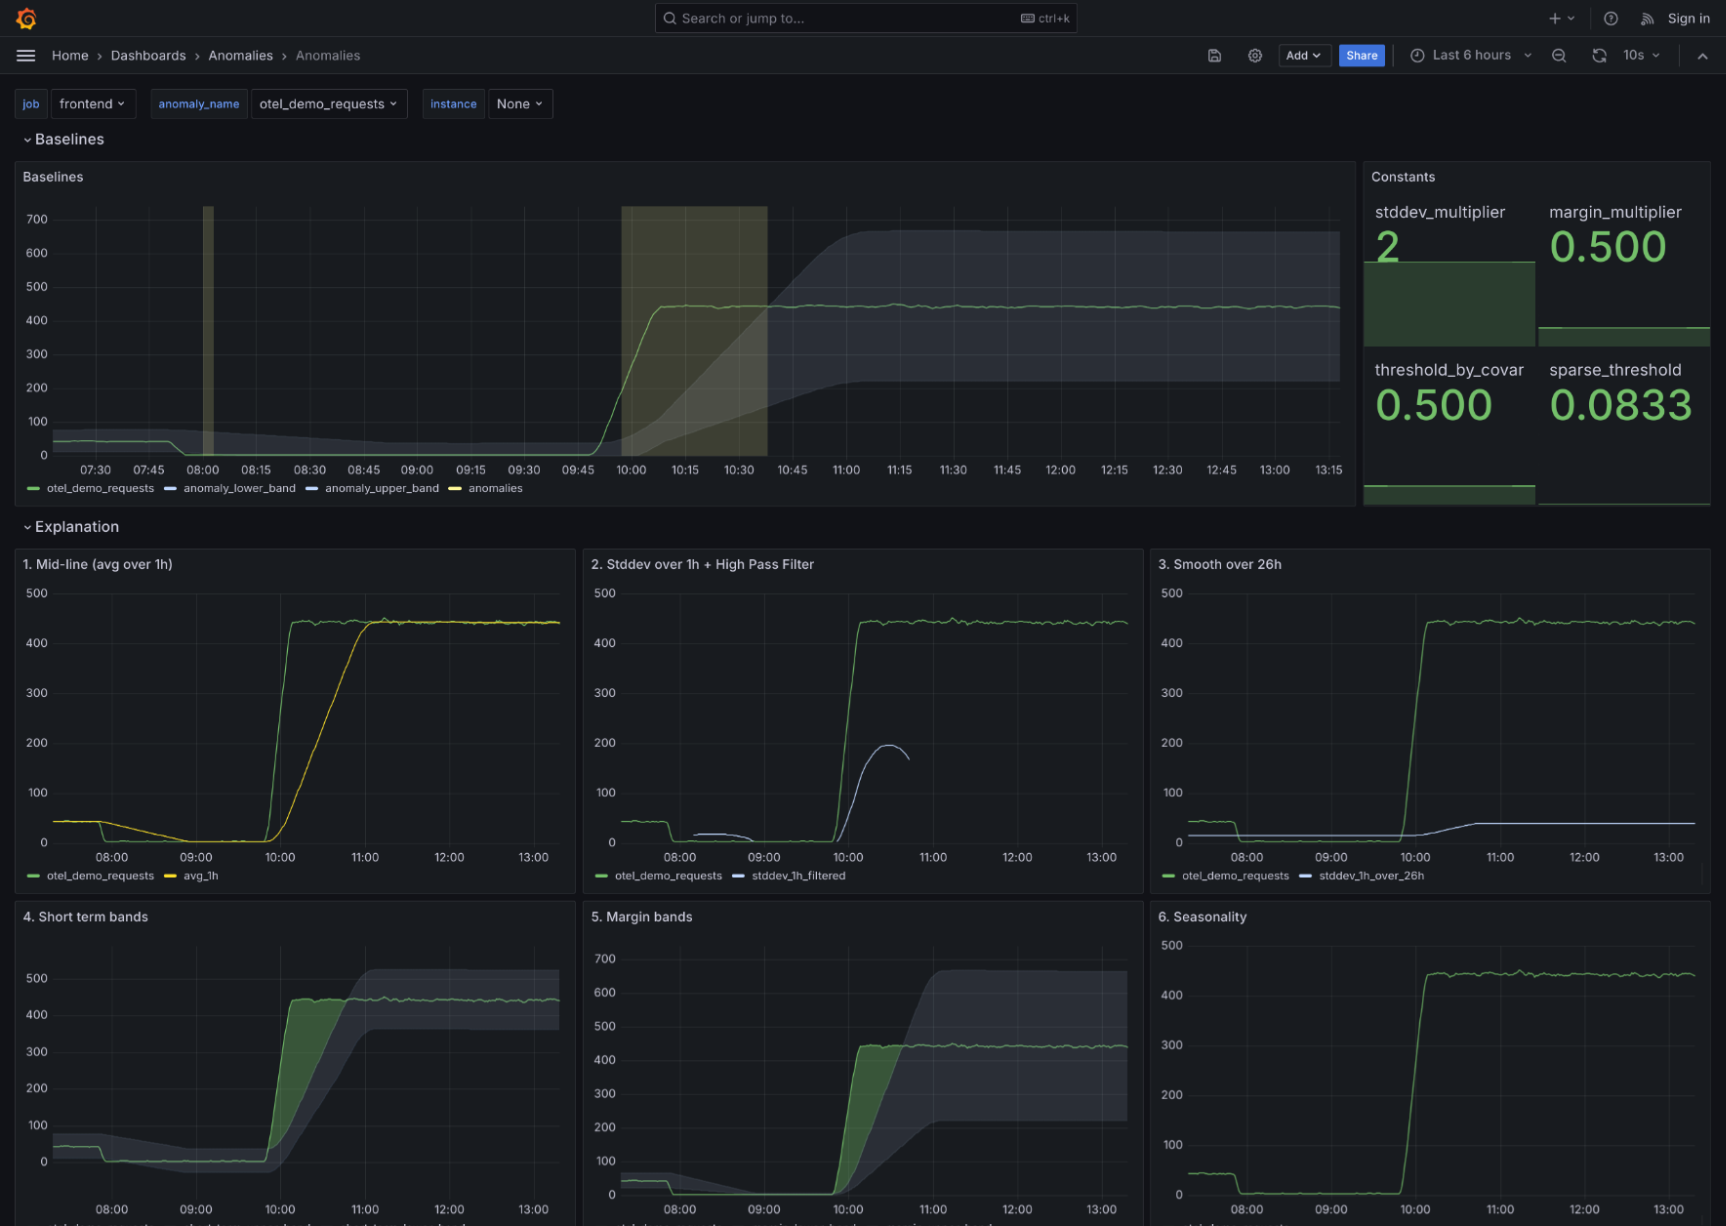
To try it out yourself, go to the GitHub repository, where you’ll find everything you need, including recording and alerting rules, dashboards, and more usage examples. You can also test it out in the demo environment, which has everything set up already.
We’re excited to see how people put it to use, and we definitely want to hear feedback on ways we can improve or add more features you need. Reach out in the #promql-anomaly-detection channel in the Grafana community Slack, or create issues and PRs in the repo.
And if you want to learn more about the topics discussed here, check out our full PromCon talk on YouTube. You can also download the slide deck here (2.8 MB).
Where to go from here
Anomaly detection can provide great context, but anomalies aren’t strong enough signals on their own to indicate something is wrong. So the next step in making the data actionable is to tie the framework back to your pre-established, SLO-based alerts as part of your root-cause analysis workflow.
For example, you can link those alerts back to a visualization tool like Grafana Cloud Asserts that shows all the anomalies in your system. To illustrate this, let’s briefly look at how we’re doing this in Grafana Cloud.
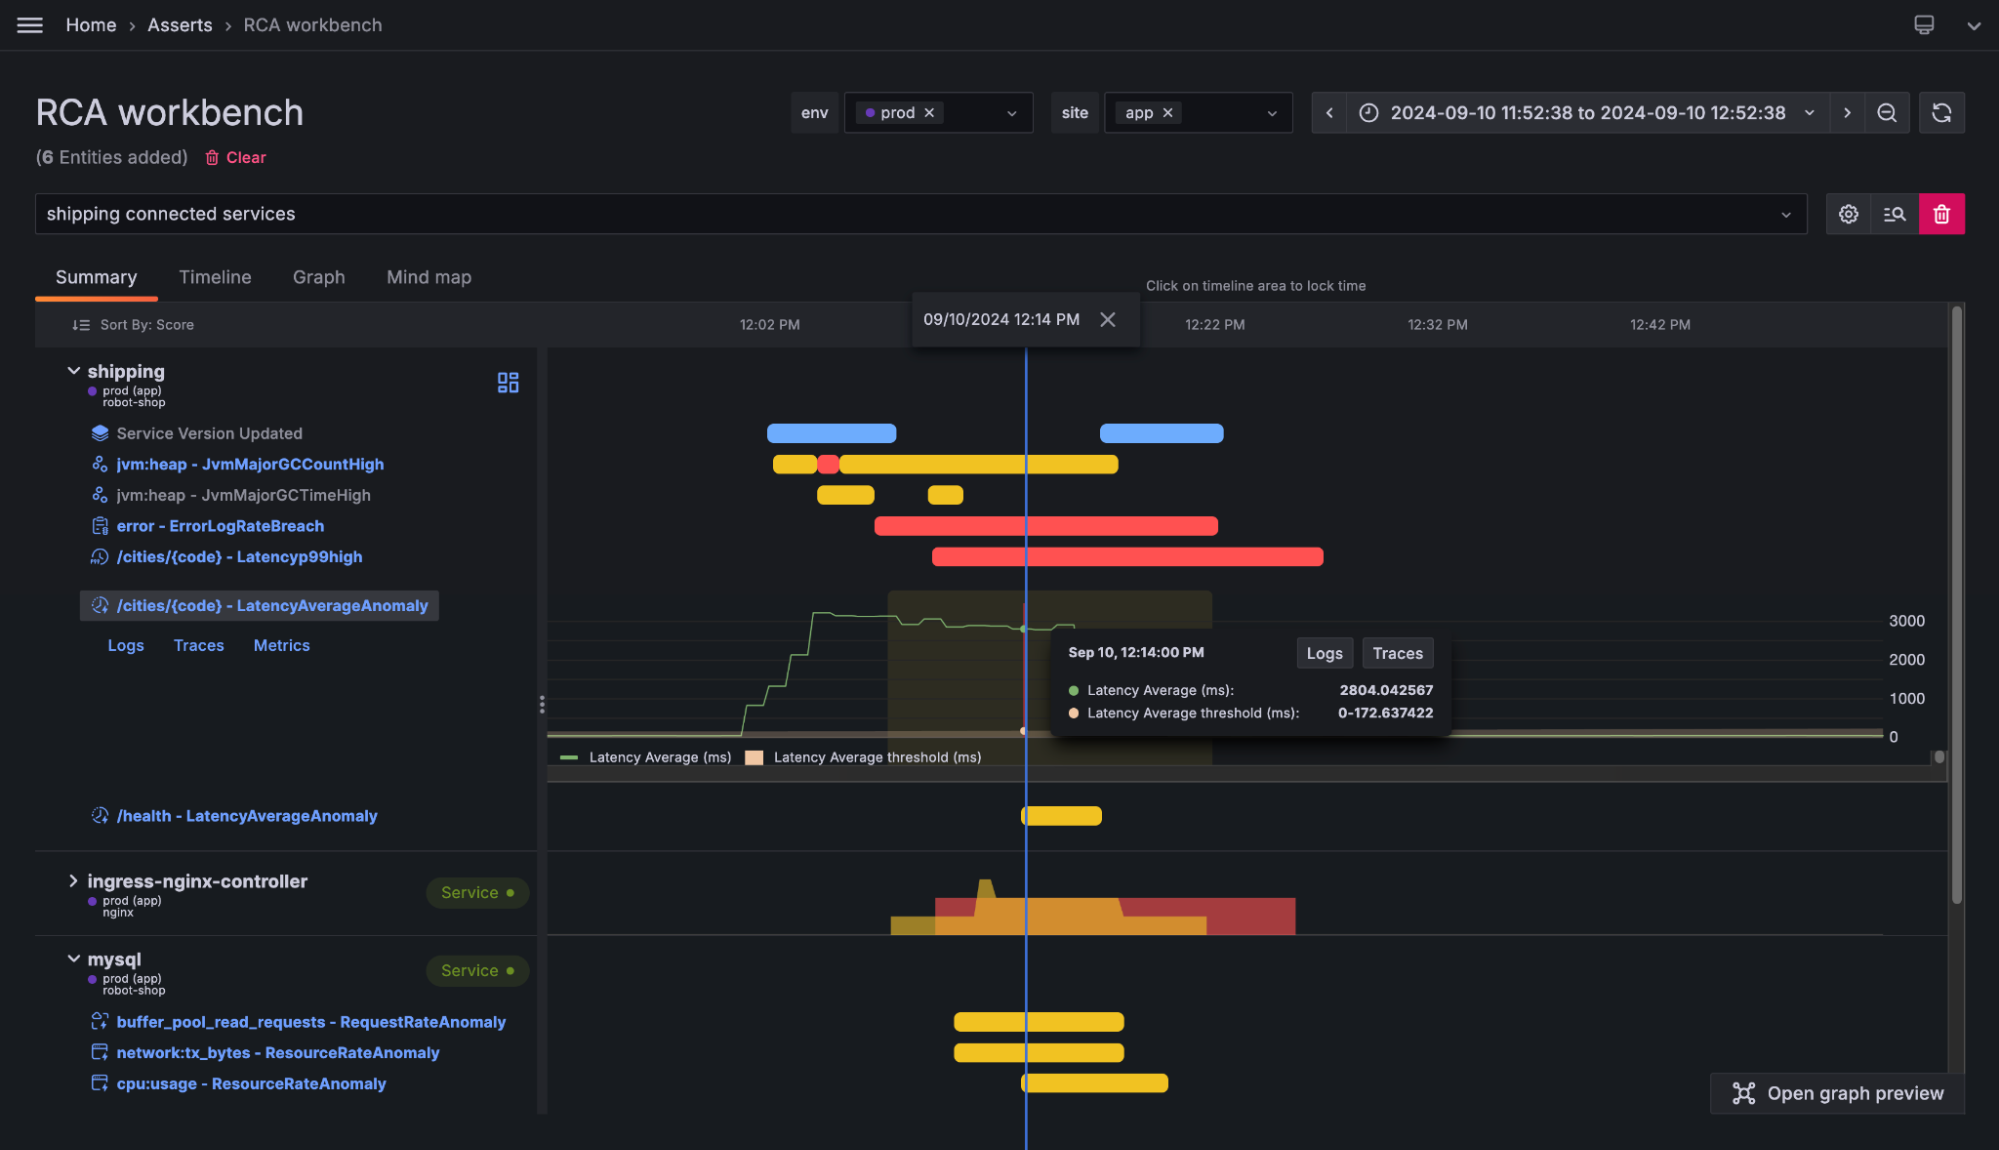
As you can see from the image above, when the alert fires, we have the ability to trace our system to understand the interdependencies and what is flowing upstream and downstream from the alert, which instantly adds context to help accelerate our troubleshooting.
Grafana Cloud is the easiest way to get started with metrics, logs, traces, dashboards, and more. We have a generous forever-free tier and plans for every use case. Sign up for free now!


