How to build automatic remediation workflows in Grafana Cloud
When incidents occur, engineers must jump into action to get systems back to running at peak performance. However, there are a myriad of challenges that can prevent them from resolving the issues swiftly.
Imagine a scenario where a team of DevOps engineers manages a cloud-based e-commerce platform that experiences occasional spikes in traffic during peak shopping seasons. During one of those major sales events, the team notices a sharp spike in CPU usage across several critical application servers. Despite their best efforts to manually scale up resources, the servers struggle to handle the surge in traffic, causing significant slowdowns for users and increasing the risk of revenue loss.
In scenarios like this, it helps to take a more proactive approach to improve resilience and reliability. For example, if the team had instead set up an auto-remediation trigger for high CPU usage, the system would have automatically scaled up the number of application server instances and redistributed incoming traffic, all without human intervention.
But don’t confuse a lack of human intervention with a lack of humans on your team. It simply reduces the steps, and therefore toil, helping your engineers ensure your organization’s systems remain healthy and reliable. Let’s take a closer look at how and when your team can implement auto-remediation to respond to incidents faster with Grafana Cloud and Grafana IRM.
What are some common use cases for auto-remediation?
Auto-remediation can be help in a wide range of use cases, but here are some of the primary ones we see our users succeed with:
- Adding resources prior to overutilization. Auto-remediation can preemptively increase resource allocation based on usage patterns and predicted demand spikes, ensuring smooth operation even during periods of high activity.
- Auto-restarting failed services. In the event of service failures, auto-remediation can automatically detect and restart the affected services, minimizing downtime and maintaining system availability.
- Auto-rerouting traffic when encountering network errors. Auto-remediation can swiftly identify network errors and reroute traffic to alternative pathways or servers, ensuring uninterrupted connectivity and minimizing service disruptions.
- Auto-roll back deployments when encountering application errors. If application errors occur after a deployment, auto-remediation can automatically roll back to a stable version, preventing widespread outages and maintaining service reliability.
When should I start building auto-remediation workflows with Grafana Cloud?
During post-incident reviews, ask your team the following questions:
- If we were able to respond quicker (without human intervention), could we have prevented this incident?
- What steps would have to be automated to accomplish this?
- What negative impact might this have? Could this cause other issues?
When you identify low-risk ways to resolve issues quickly and easily through automation, encourage your team to experiment to see if it can help resolve issues faster next time.
How to get started with auto-remediation in Grafana Cloud

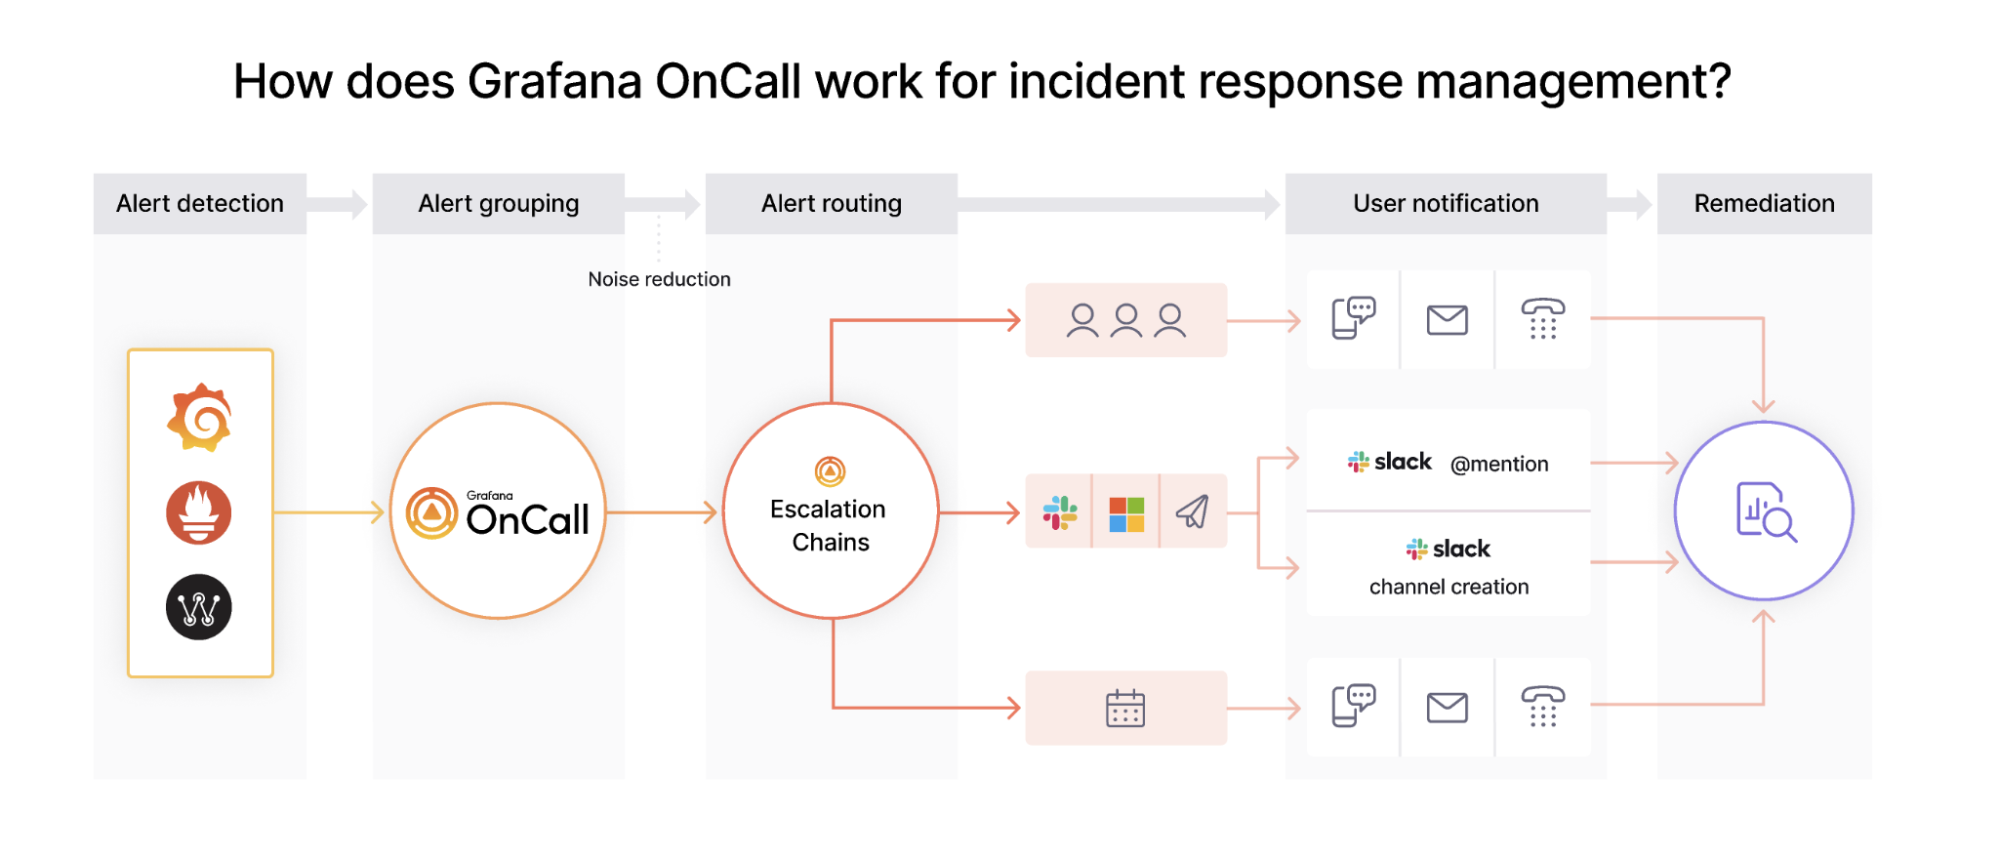
To implement automated remediation workflows in Grafana Cloud, the key feature you’ll want to use is Grafana OnCall’s escalation chains. Grafana OnCall is part of Grafana IRM, both of which are included in Grafana Cloud at no additional cost. Follow the steps below to get started. Or, if you’re new to Grafana OnCall or want a foundational review, start here first instead.
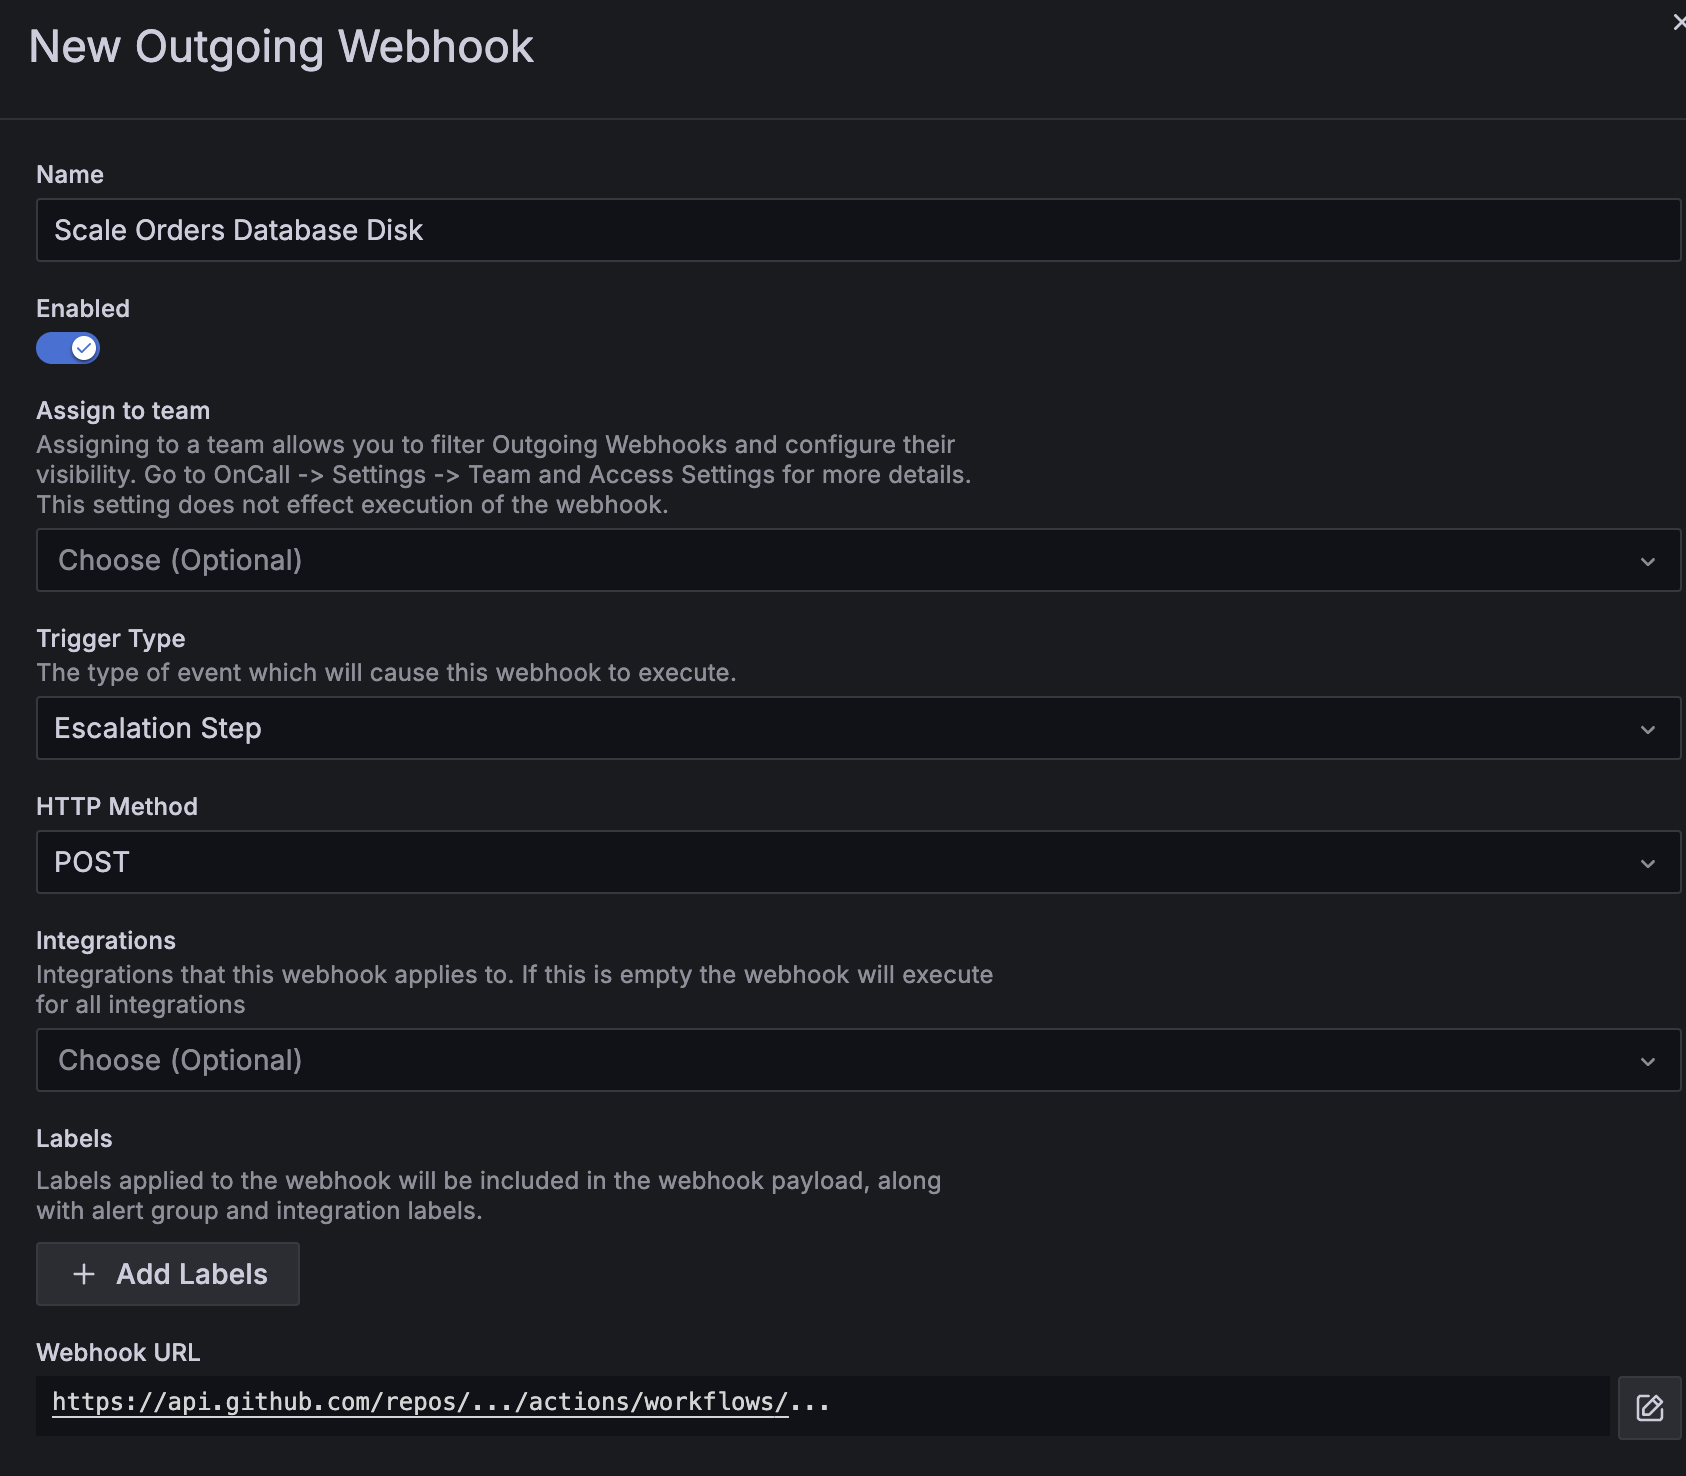
- Begin by configuring an outgoing webhook to the system you want to trigger your automated remediation (i.e., GitHub Actions, IaC tooling)
In our example, we’ll configure an advanced outgoing webhook, triggering a GitHub Action.

- Next, you’ll want to define an escalation chain.
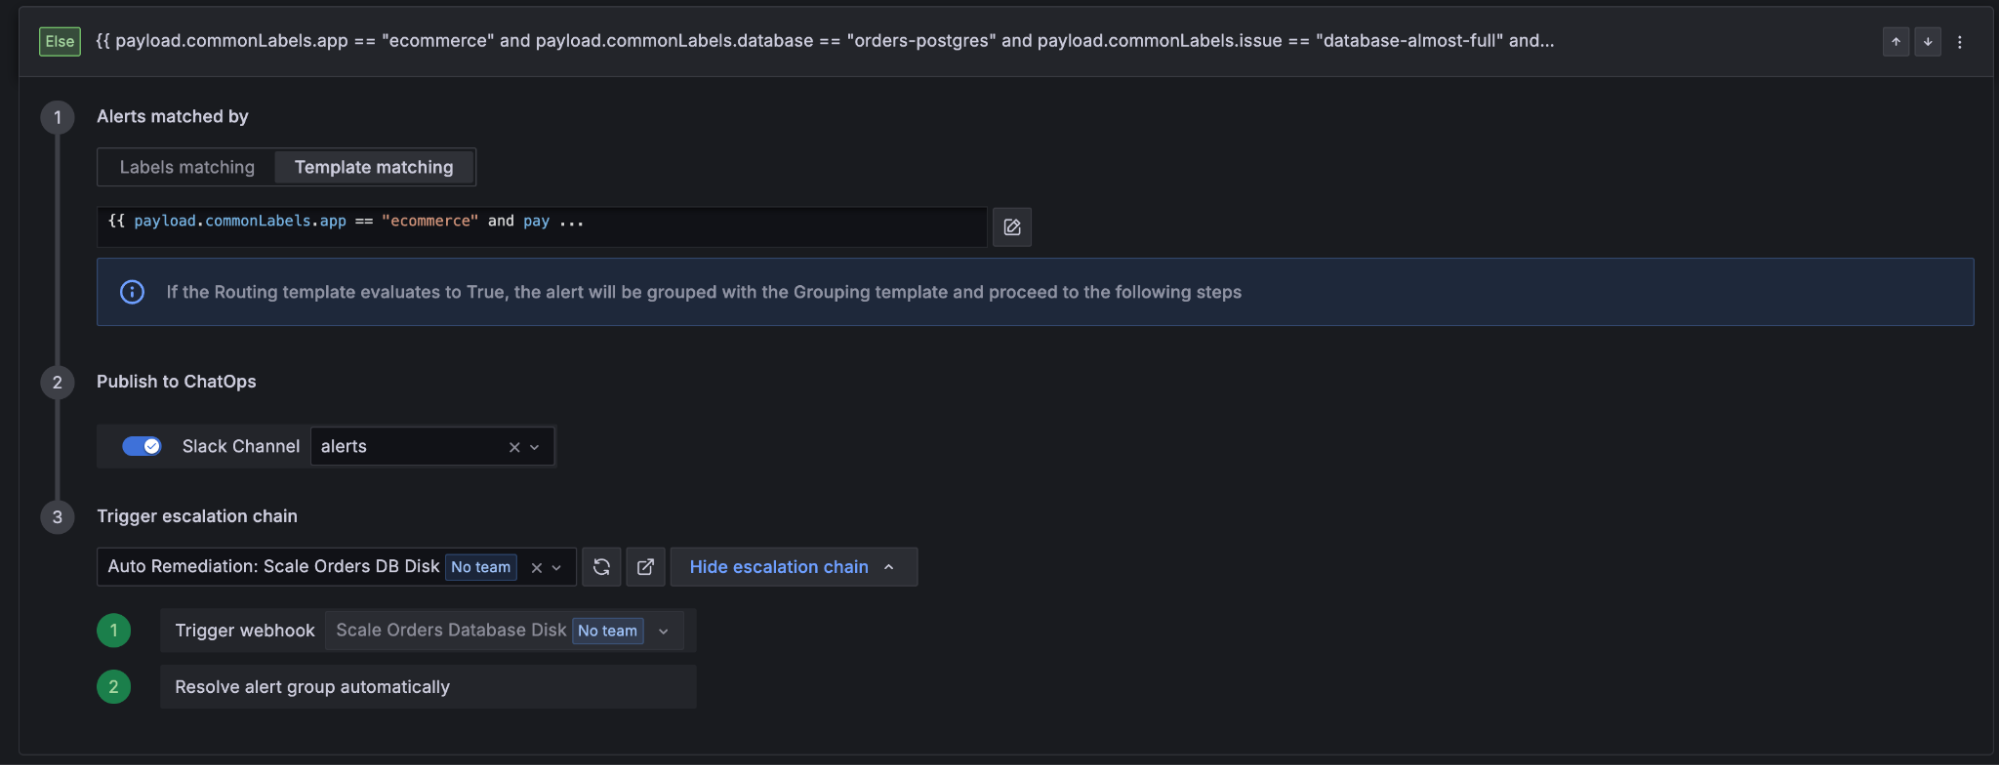
In the escalation chain, select Trigger webhook and then select the webhook you configured earlier.

- Then, you’ll want to define a route matching the condition you’d like to trigger your automated remediation, and configure it to trigger the escalation chain you previously set up.
Start with the integration that’s the source of your alerts and add a new route. In our example, we’ll use the routing template below to trigger our automated remediation:
{{ payload.commonLabels.app == "ecommerce" and payload.commonLabels.database == "orders-postgres" and payload.commonLabels.issue == "database-almost-full" and payload.commonLabels.automate == "yes" }}- Finally, we’ll configure our workflow to notify us via Slack, and trigger our automated remediation escalation chain.

Start implementing auto-remediation today
Auto-remediation workflows are a powerful technique to reduce engineer stress and improve reliability by automating repetitive tasks, reducing the time to resolution, and minimizing human error. Because Grafana IRM and Grafana Cloud are heavily composable, your engineers are able to get creative and stand up automations with the appropriate tools and context in which your team operates. Are you ready to build auto-remediation today?
Grafana Cloud is the easiest way to get started with metrics, logs, traces, dashboards, and more. We have a generous forever-free tier and plans for every use case. Sign up for free now!


