
Convert your dashboards into comprehensive web applications with the Business Suite for Grafana
Daria Volkova is a Grafana Champion and Volkov Labs co-founder.
The Business Suite for Grafana is a collection of uniquely positioned plugins developed by Volkov Labs. Each offers flexible and adaptable solutions for a wide range of business needs that go beyond observability, including file uploads, building a chart of any kind and configuration, leveraging all aspects of web design, video streaming, and more.
This blog post provides details, examples, and short tutorials. Here you’ll learn what each plugin does, how others are using them, and the best way to get started.
Currently, the Business Suite consists of 10 plugins, each developed for a niche task:
- Business Input data source
- Business Media panel
- Business Variable panel
- Business Text panel
- Business News data source
- Business Satellite data source
- Business Forms panel
- Business Charts panel
- Business Calendar panel
- Business Table panel
The plugins are supported and maintained by Volkov Labs, so let us show you how you can put them to use today.
Business Input data source
The Business Suits includes six visualization panels. You can use the Business Input data source to start playing with any of them.
Go to the Grafana catalog and install it with one click. Alternatively, you can use this link. From there, select it on your visualization panel and create any data frame for your experiments.
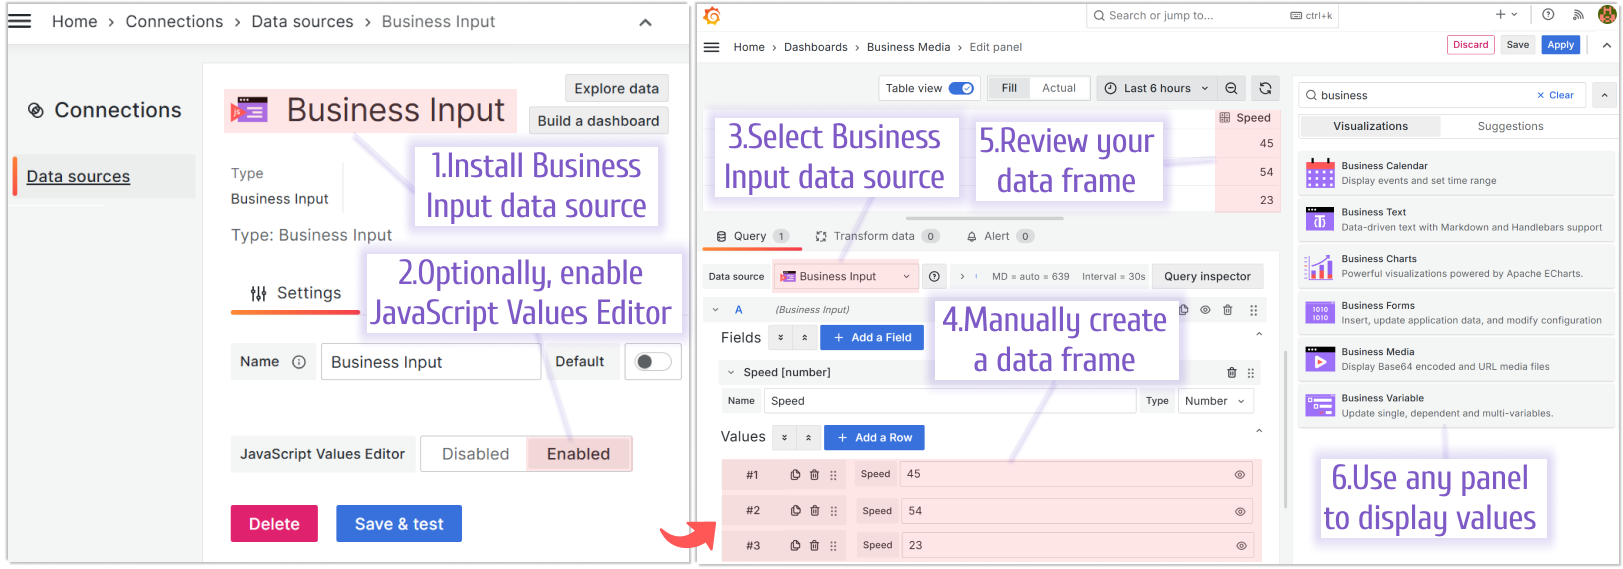
The data frame example above would probably be the most utilized functionality. But the Business Input data source has much more to offer. It is enriched with the JavaScript module to simplify the data emulation.
In short, the latest version of this plugin allows you to:
- Create static visualizations that don’t depend on a specific data source.
- Specify values manually or use the JavaScript Values Editor code.
- Store data and images directly in the dashboard.
- Use the dashboard variables and global variables.
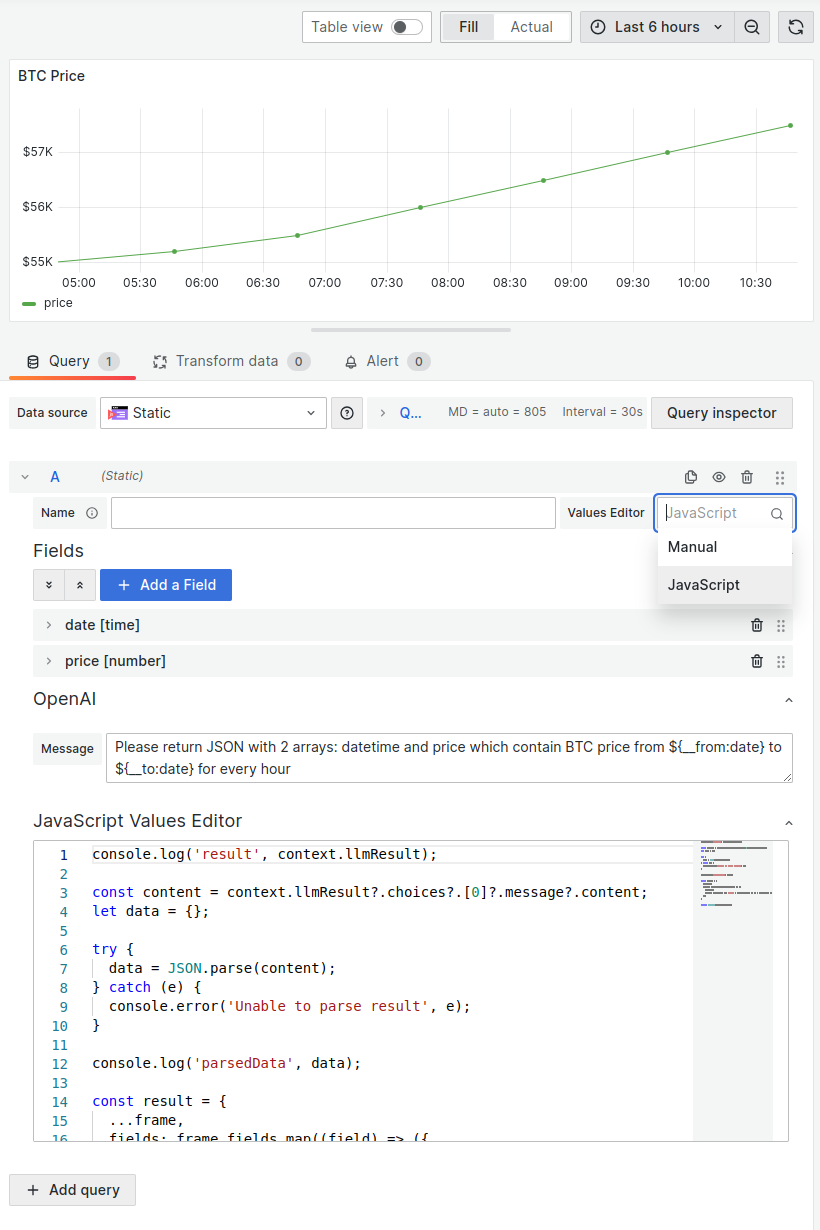
In addition, the Business Input data source supports LLM models (OpenAI, custom) using the Grafana LLM App. When the LLM app is configured, a text area appears in the code editor mode.
This text area allows you to use the response that will be received from the LLM app together with OpenAI. The result is stored in context.llmResult.
Business Media panel
The Business Media panel is a Grafana plugin that renders images, PDFs, audio, and video files. The supported formats include: PNG, JPG, GIF, MP4, WEBM, MP3, OGG, and PDF.
During GrafanaCon 2024, we learned that this plugin was used by the Japan Aerospace Exploration Agency (JAXA) in their breathtaking moon landing project.
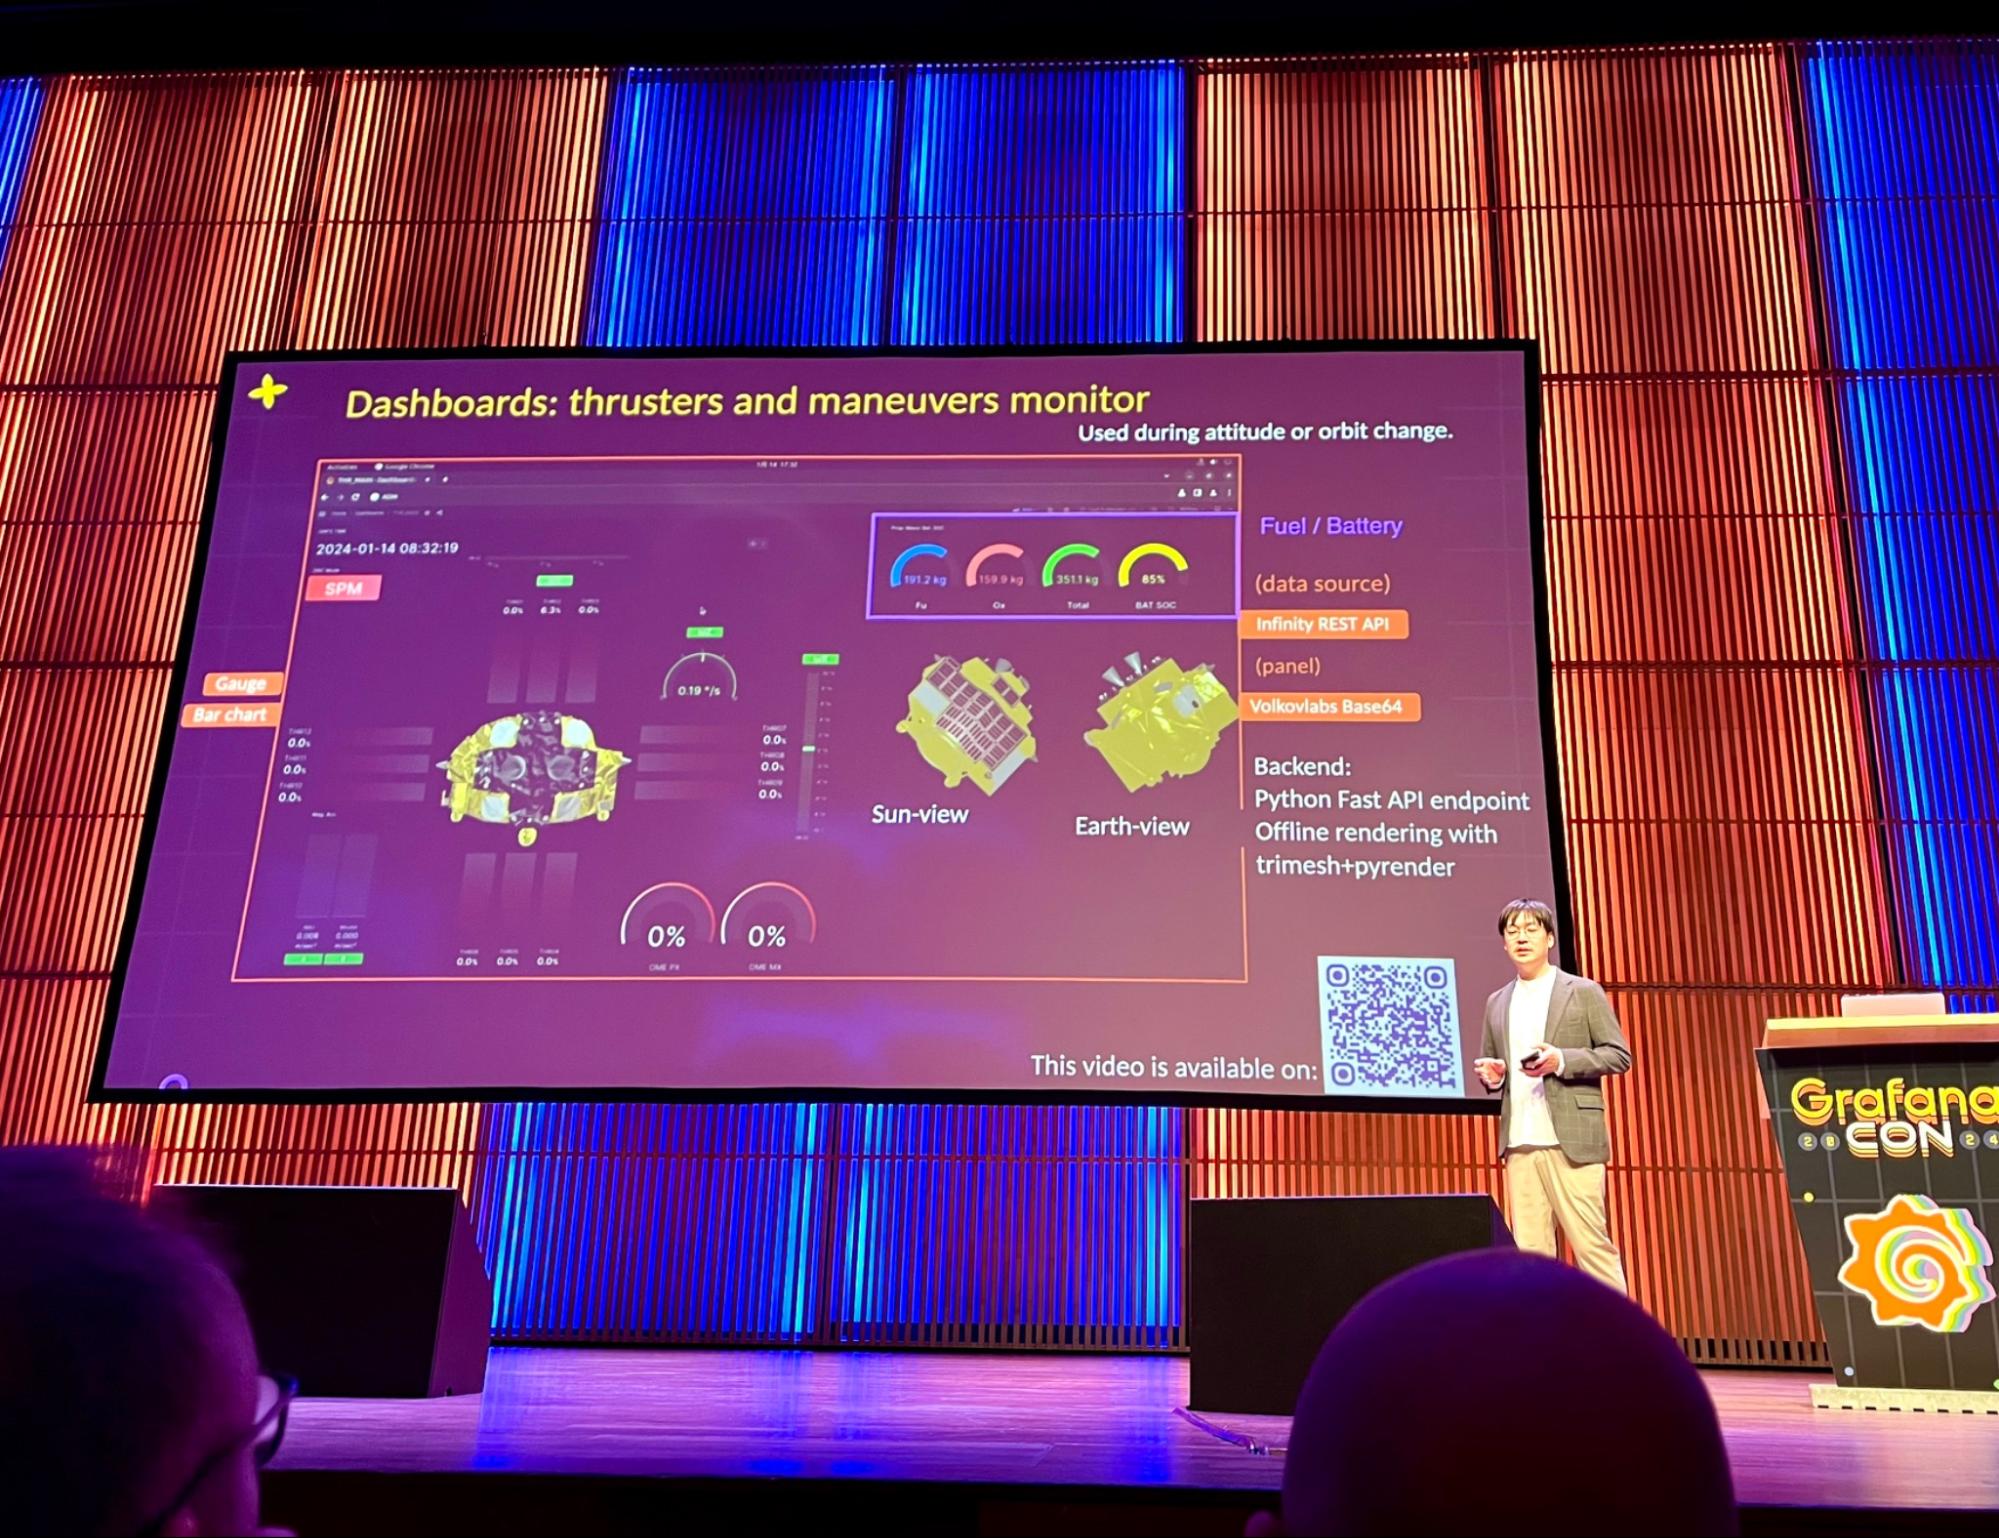
It was staggering to realize that the Business Media panel was chosen to monitor the probe movements in real time.
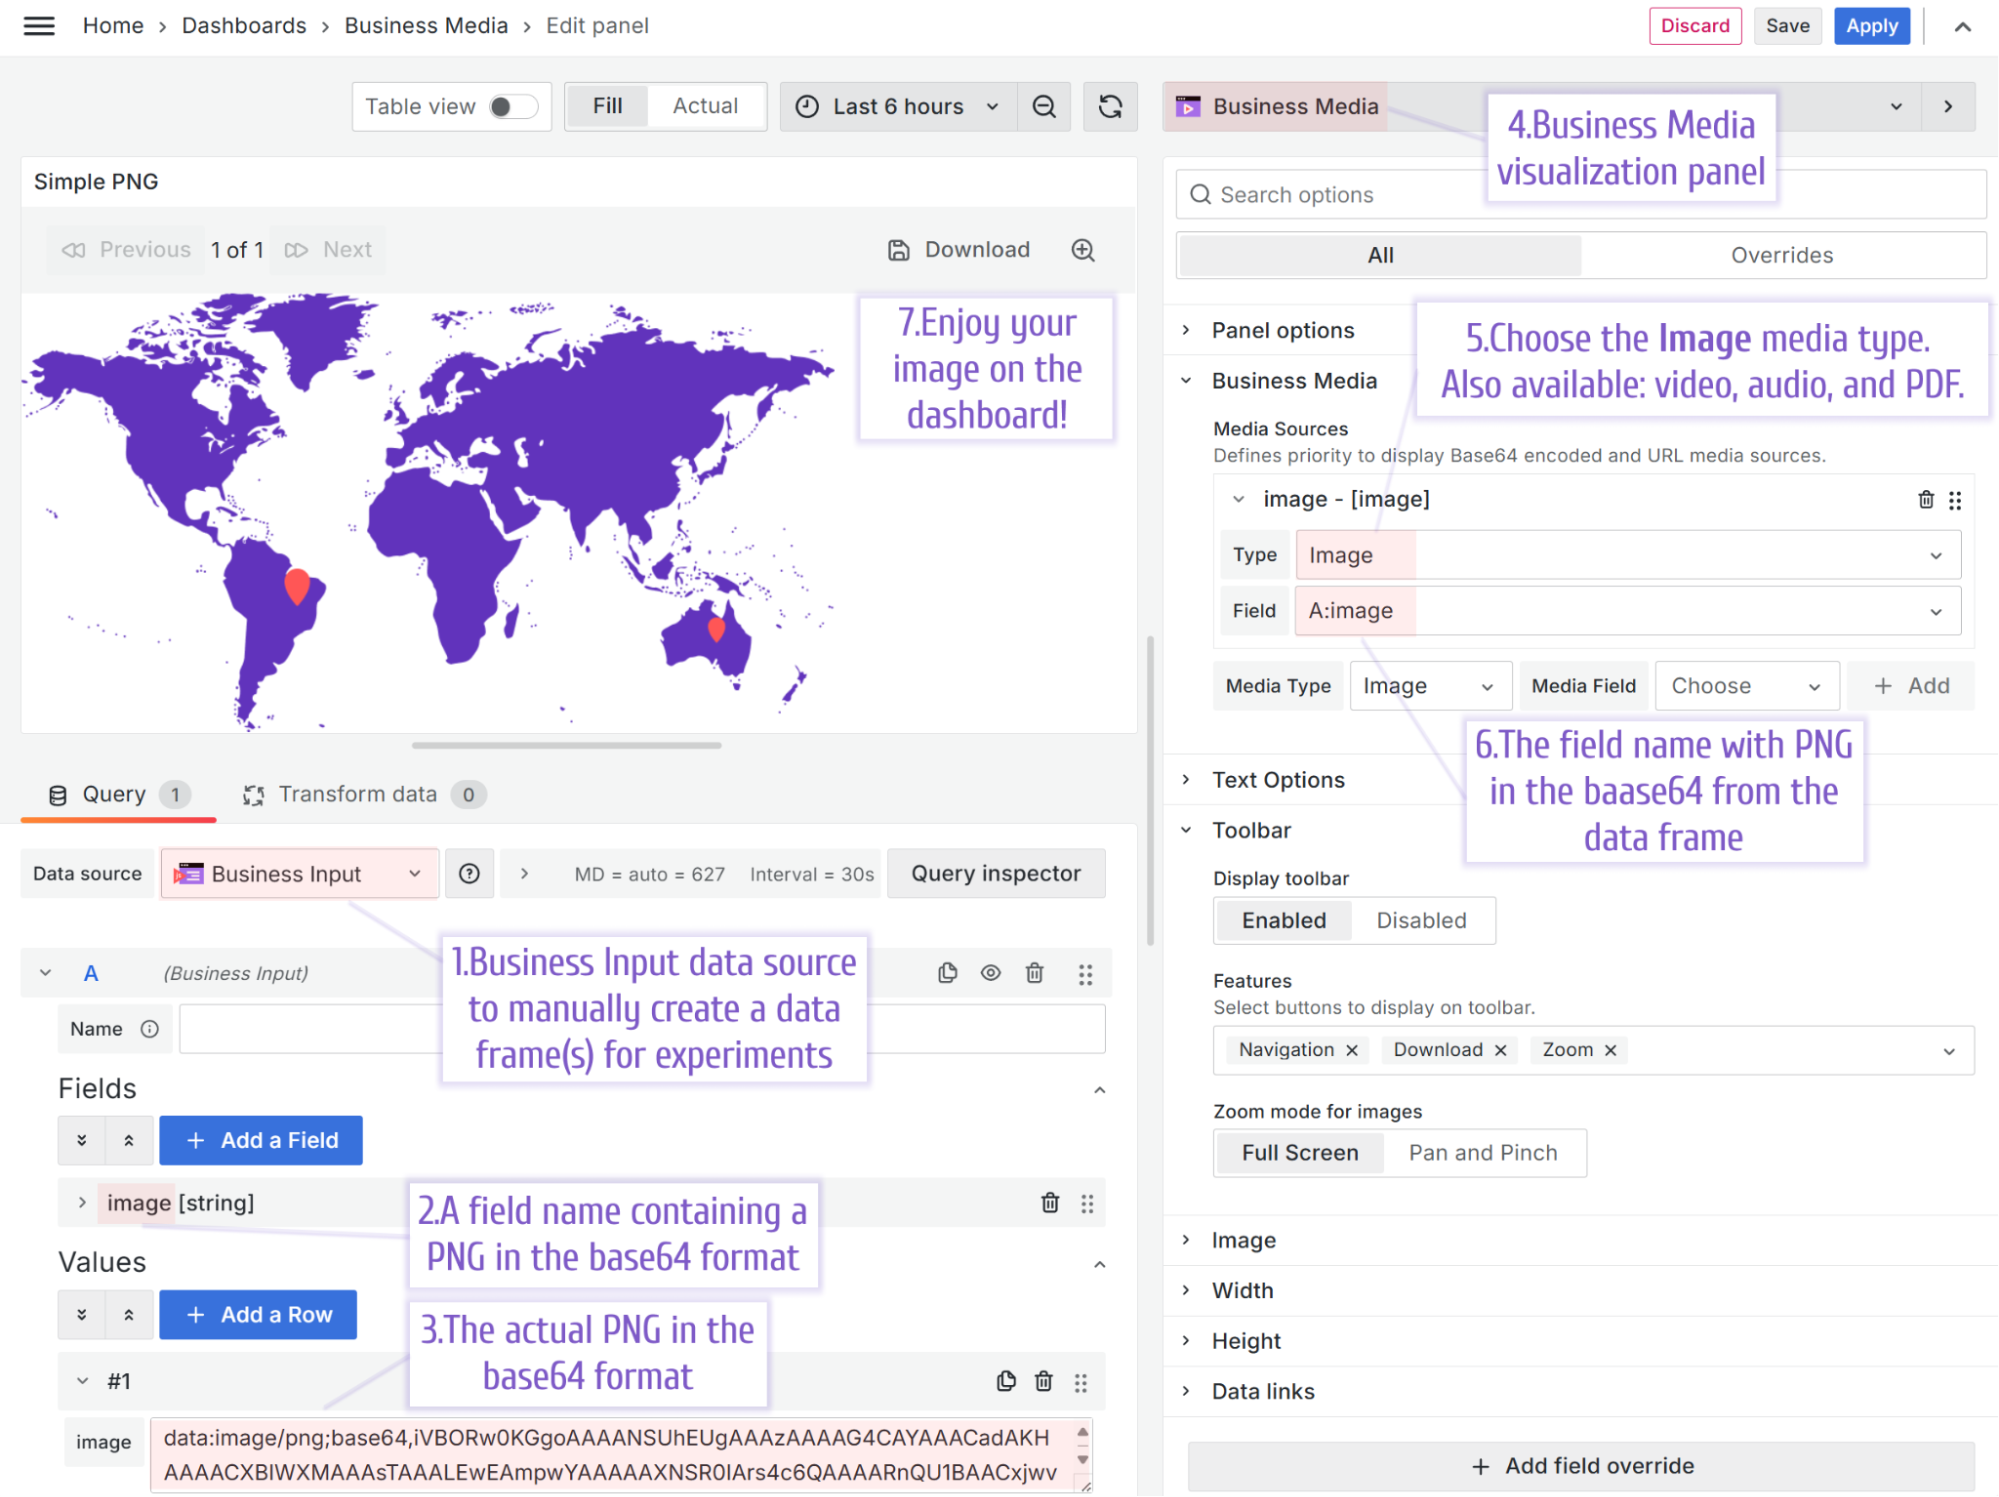
To start playing with the Business Media plugin:
- Install the Business Input data source and choose it for your visualization panel.
- Add a field to store an image in the “String” format.
- Convert any image into base64. (There are plenty of free online services to do so.) Paste the value into the appropriate field of the Business Input data source.
- Select the Business Media visualization panel.
- Specify the Media type — “Image.”
- Specify the field containing your image in the base64 format.
- Enjoy your image on the Grafana dashboard.
Business Variable panel
The Business Variable panel builds on top of the native dashboard variables. It allows you to have dashboard filters in a separate panel, which you can place anywhere on the dashboard.
In addition, the Business Variable panel offers many layouts with robust options, including minimize, slider, buttons, and advanced tree view layouts. In the tree view layout you can add multiple tabs, search, and filtering. The Grafana thresholds feature is also supported.

Dashboard redirection is one of the most popular use cases this panel solves with ease.
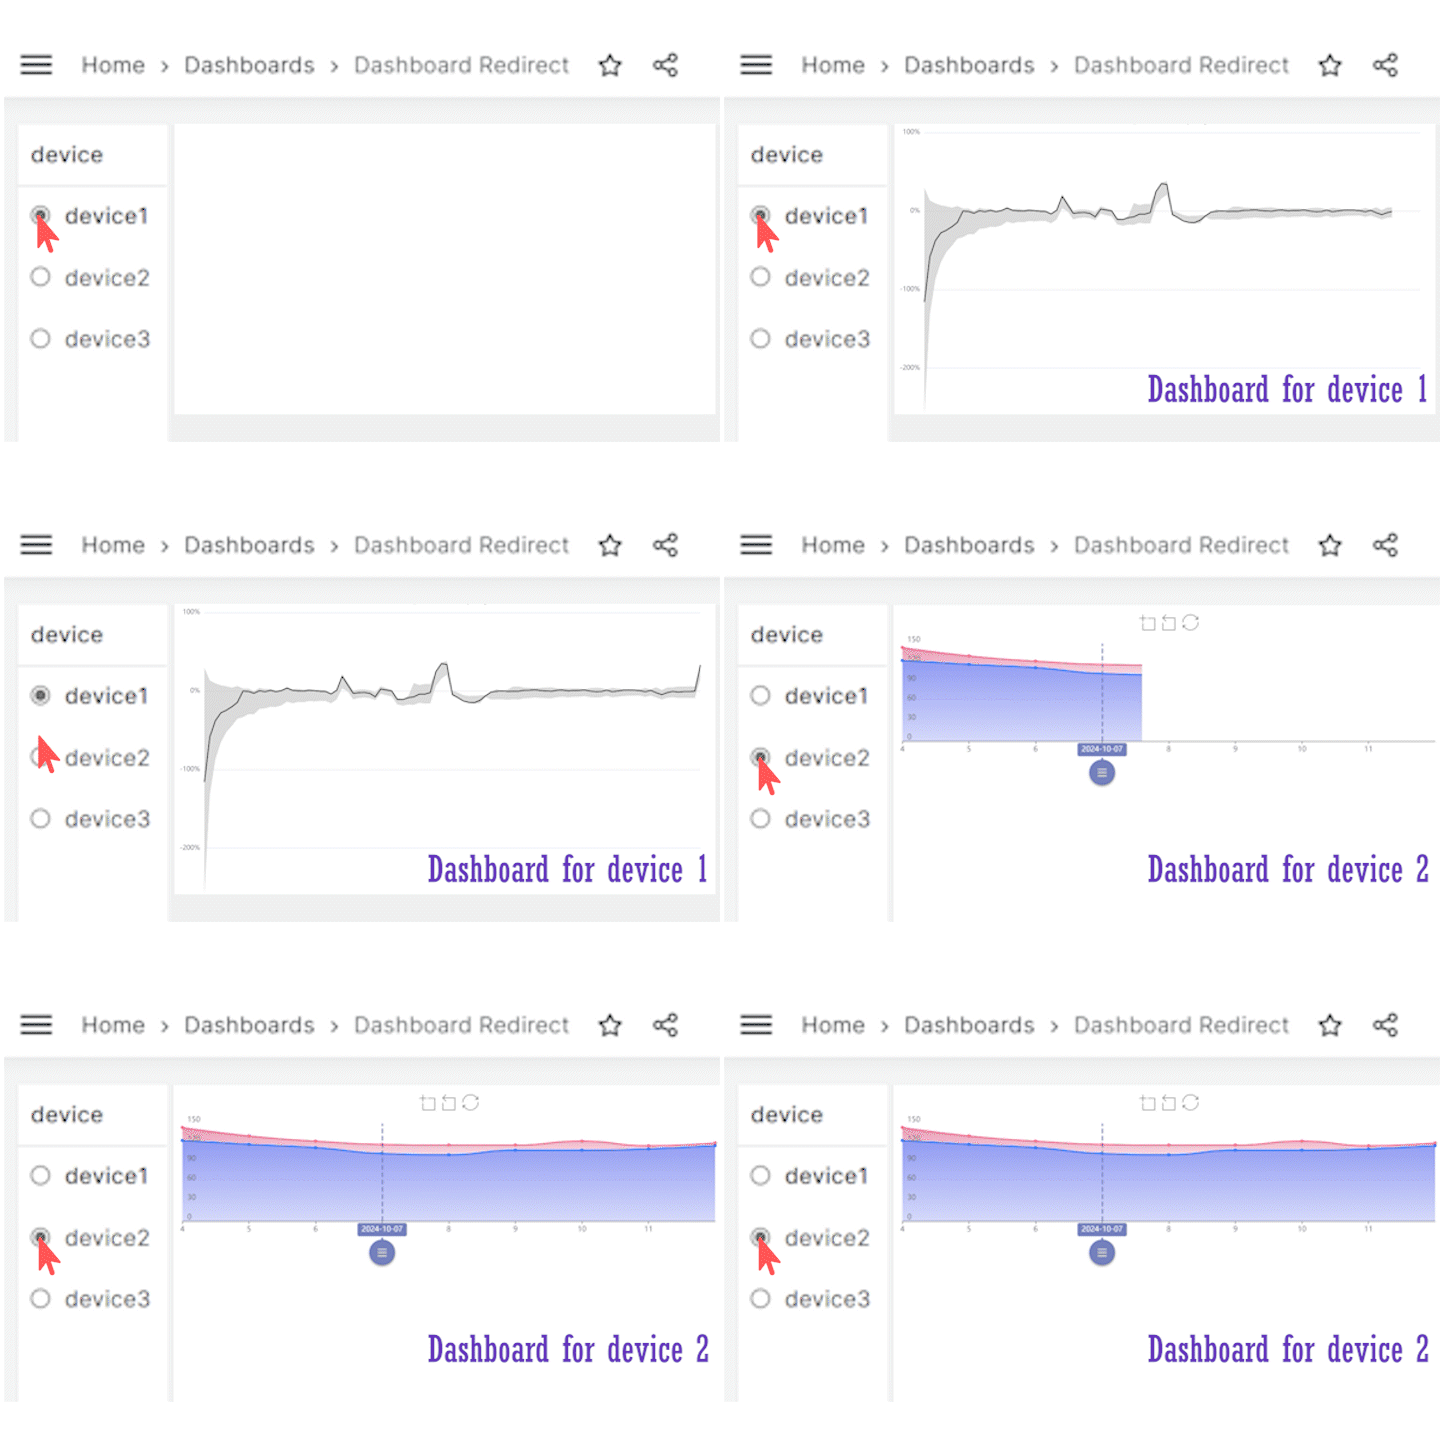
This feature allows the corresponding dashboard to be opened to a variable value. It is useful, for instance, if the Business Variable panel displays a list of some devices where every device requires a specific dashboard.
The corresponding dashboard opens when a user selects a device in the Business Variable panel.
You can find a step-by-step tutorial here, but the best way to get started with this panel is to review the Display Mode section of the plugin documentation.
Business Text panel
The Business Text panel allows you to bring web design to your Grafana dashboard. You can use handlebars, Markdown, HTML, and CSS to create styles of any complexity.
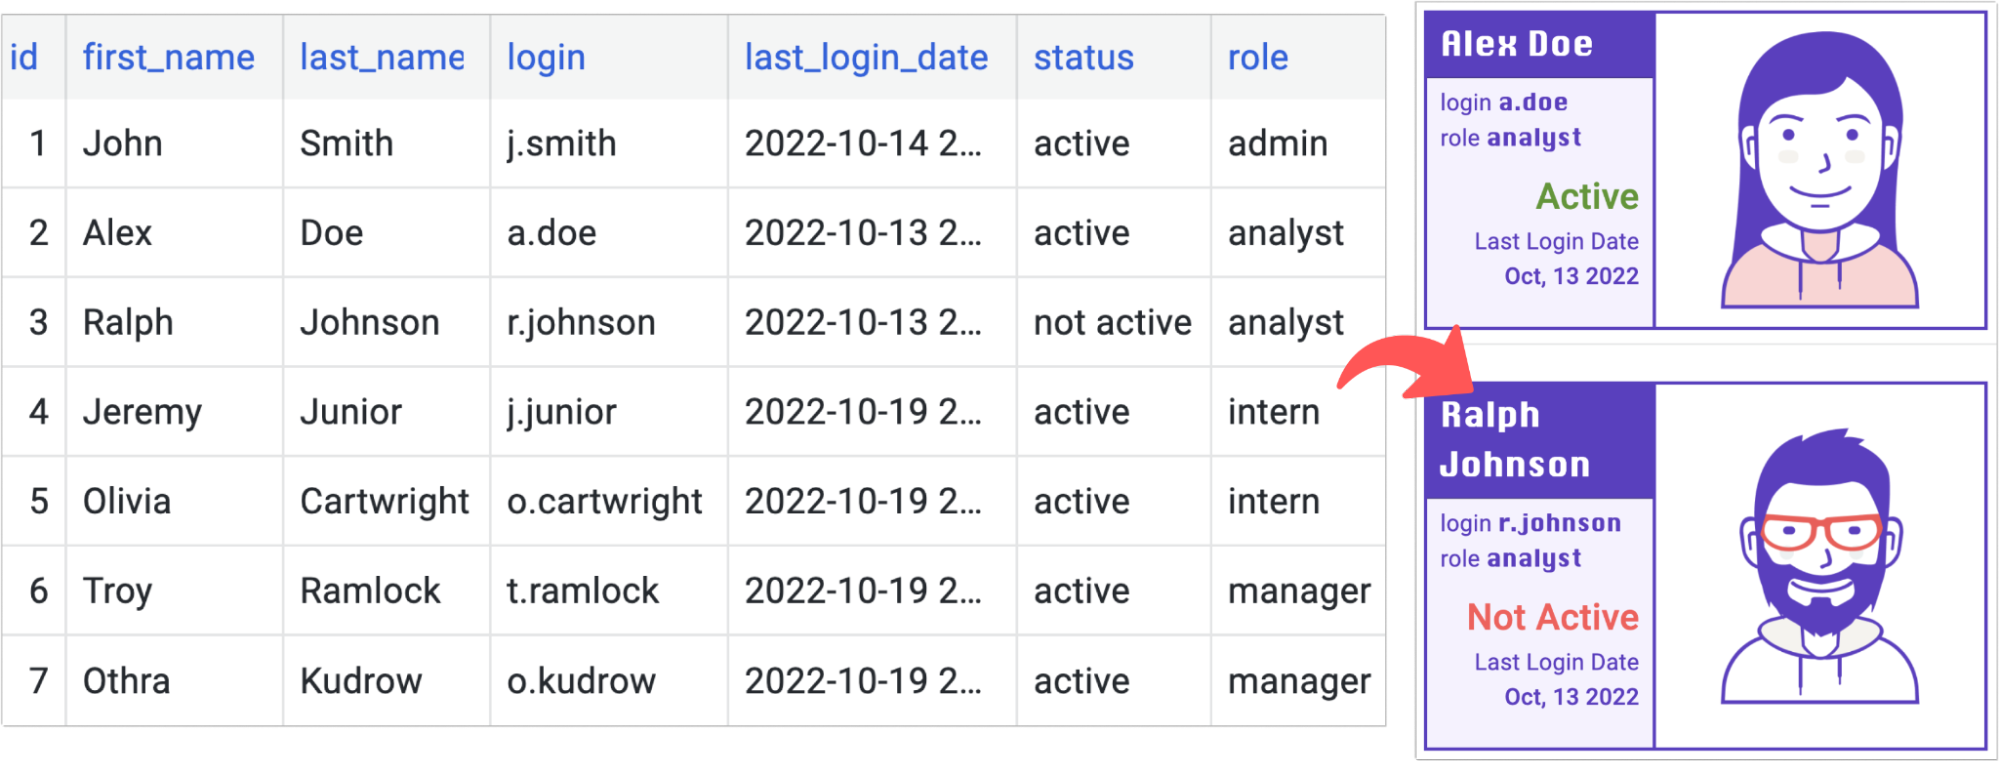
However, this is just the tip of the iceberg. After we added the ability to use custom JavaScript code with the plugin, it turned into a mini development framework within Grafana dashboards.
That might be one of the big reasons it’s one of our most popular plugins, with more than 7 million downloads. (And don’t just take our word for it. A community member recently described the plugin as “absurdly useful.”)
With the external libraries feature, beloved panels like Flowchart can have a second life. Simply import an appropriate external library and write your code addressing the Flowchart libraries directly.
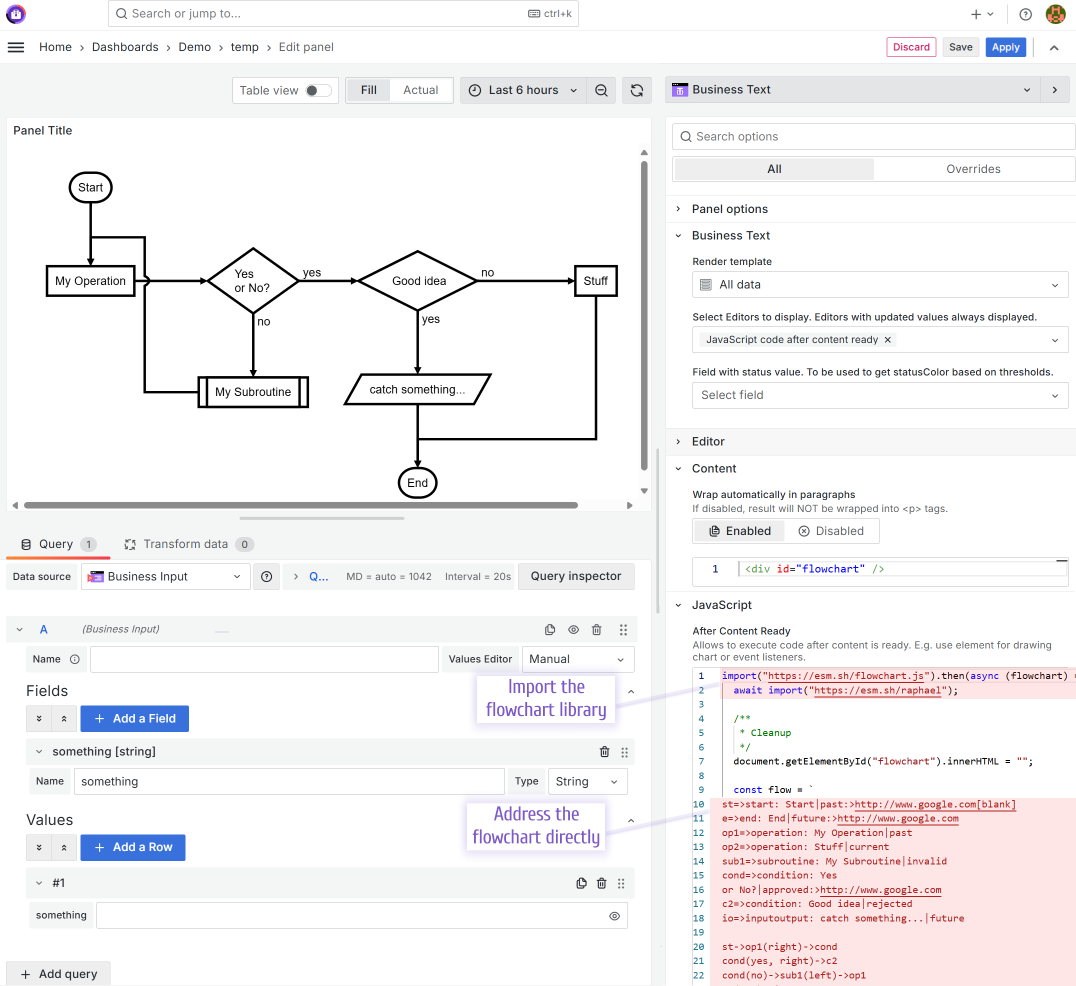
Our documentation describes that use case in detail. Please find it here.
And to get started with these powerful tools, explore our demo server. This server features a dashboard that displays news from the Business News data source, using the Business Text panel to present them on the Grafana dashboard. Feel free to open any panel in Edit mode and see how it can be done for yourself.
Business News data source
The Business News data source is a plugin for Grafana that retrieves RSS/Atom feeds and allows you to visualize them using Business Text and other visualization panels.
Using the Business News data source, your Grafana dashboard can display all the latest news and updates from various web resources. For instance, the dashboard in the image below gives access to five online projects to keep you immediately informed about any fresh updates.
The Business News panel supports dashboard and global variables. That is demonstrated by the Business Variable panel (no. 1 in the image below), which allows switching between Volkov Labs, Grafana, and News channel.
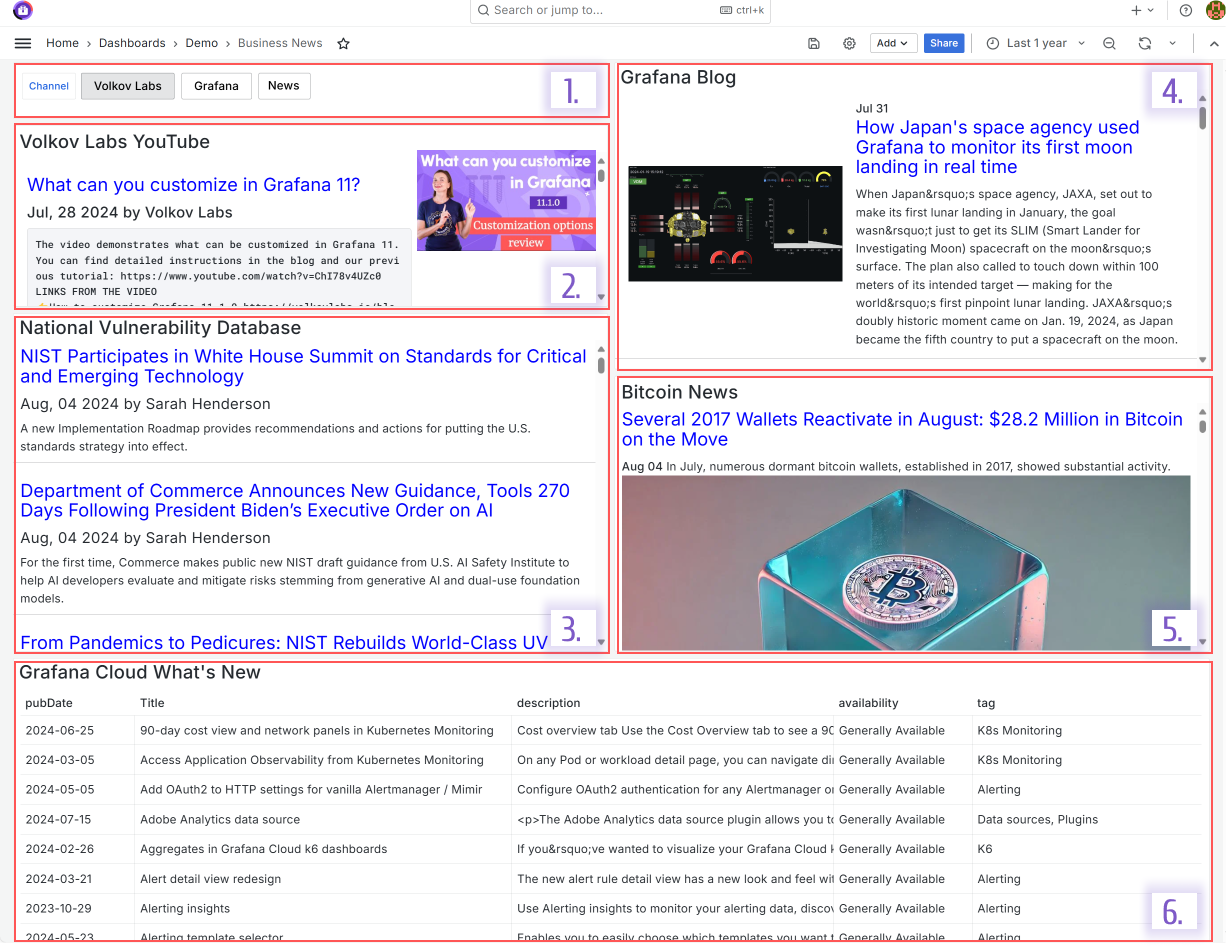
For the Business News data source configuration you need to specify Name and Feed URL as shown below.
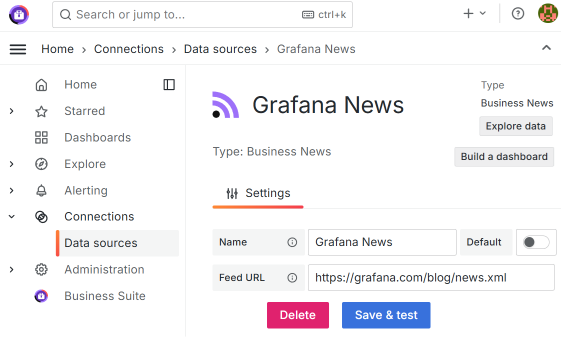
You can start playing with the Business News panel on our demo server now.
Business Satellite data source
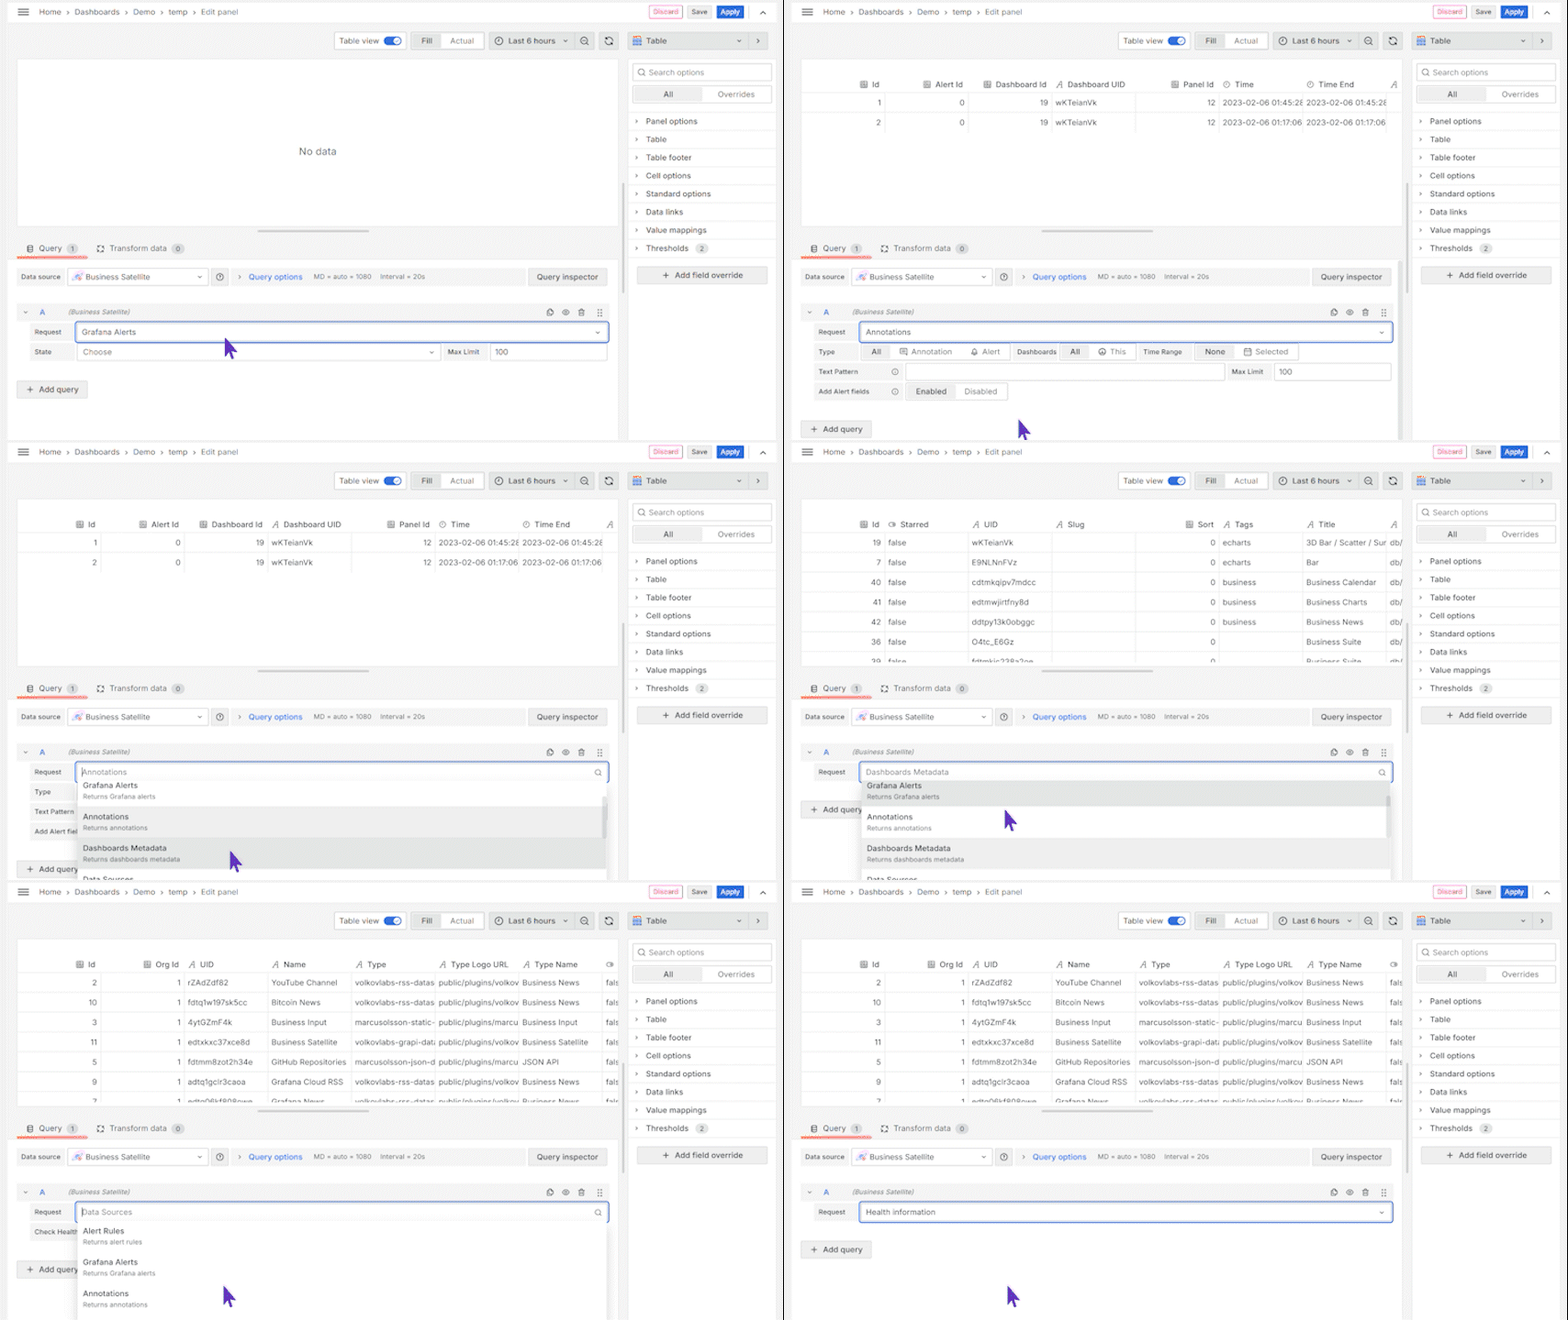
The Business Satellite data source facilitates access to the Grafana configuration database, the central repository for all Grafana settings, metadata, alerts, and annotations.
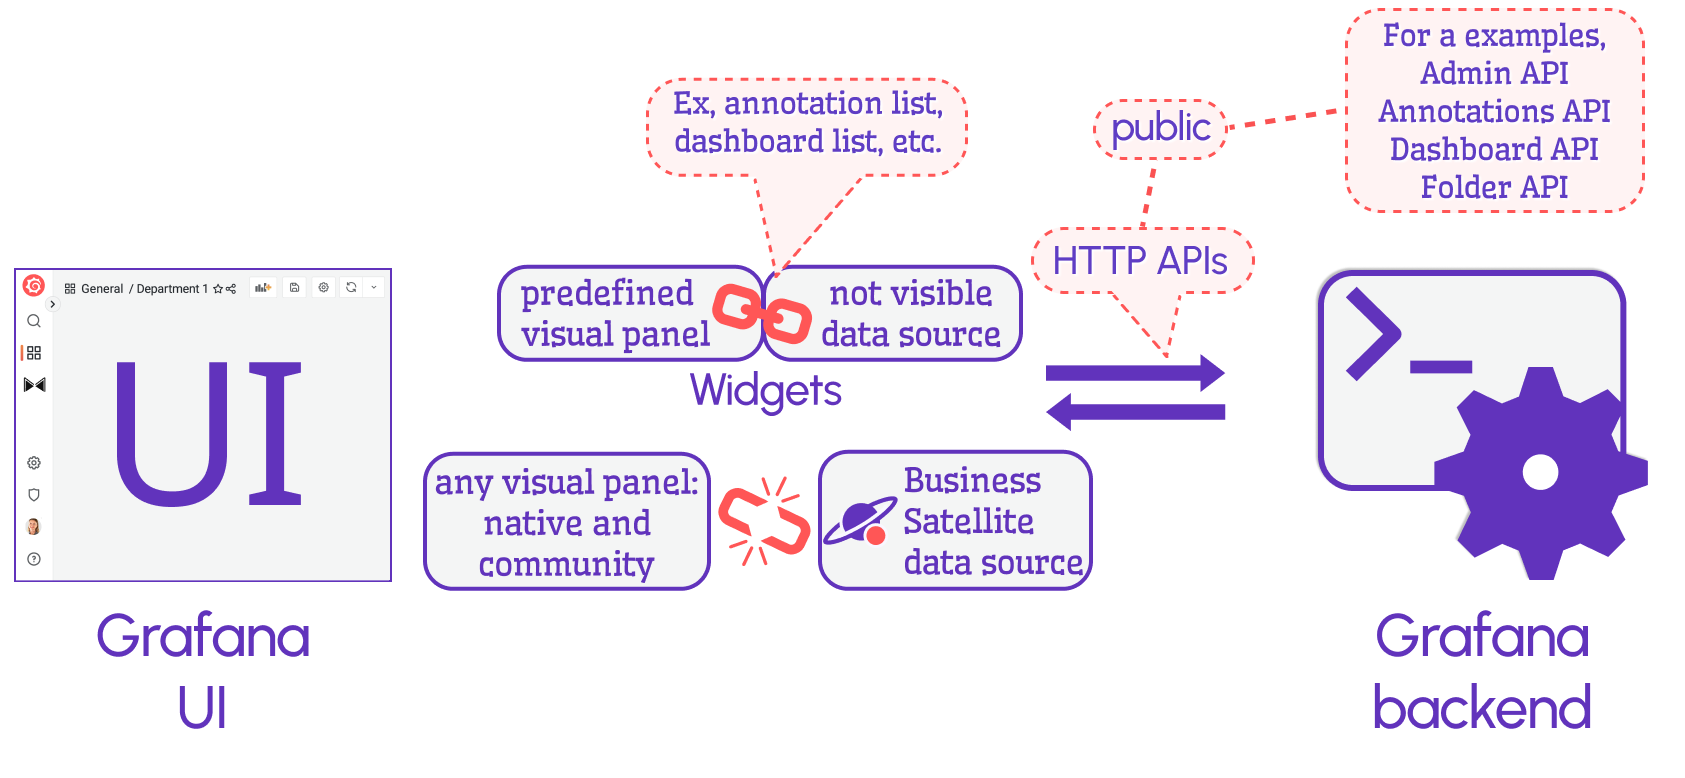
By default, Grafana offers widgets, the predefined visualization panels that work via an invisible data source. The widgets are not customizable. With the Business Satellite data source, you can access the Grafana APIs and display the results on any visualization panel, which means you can get as creative as needed for your use case.
As of now, the Business Satellite data source supports the following API calls:
- Annotations
- Dashboards metadata
- Data sources
- Alerts
- Health information
- Organization users
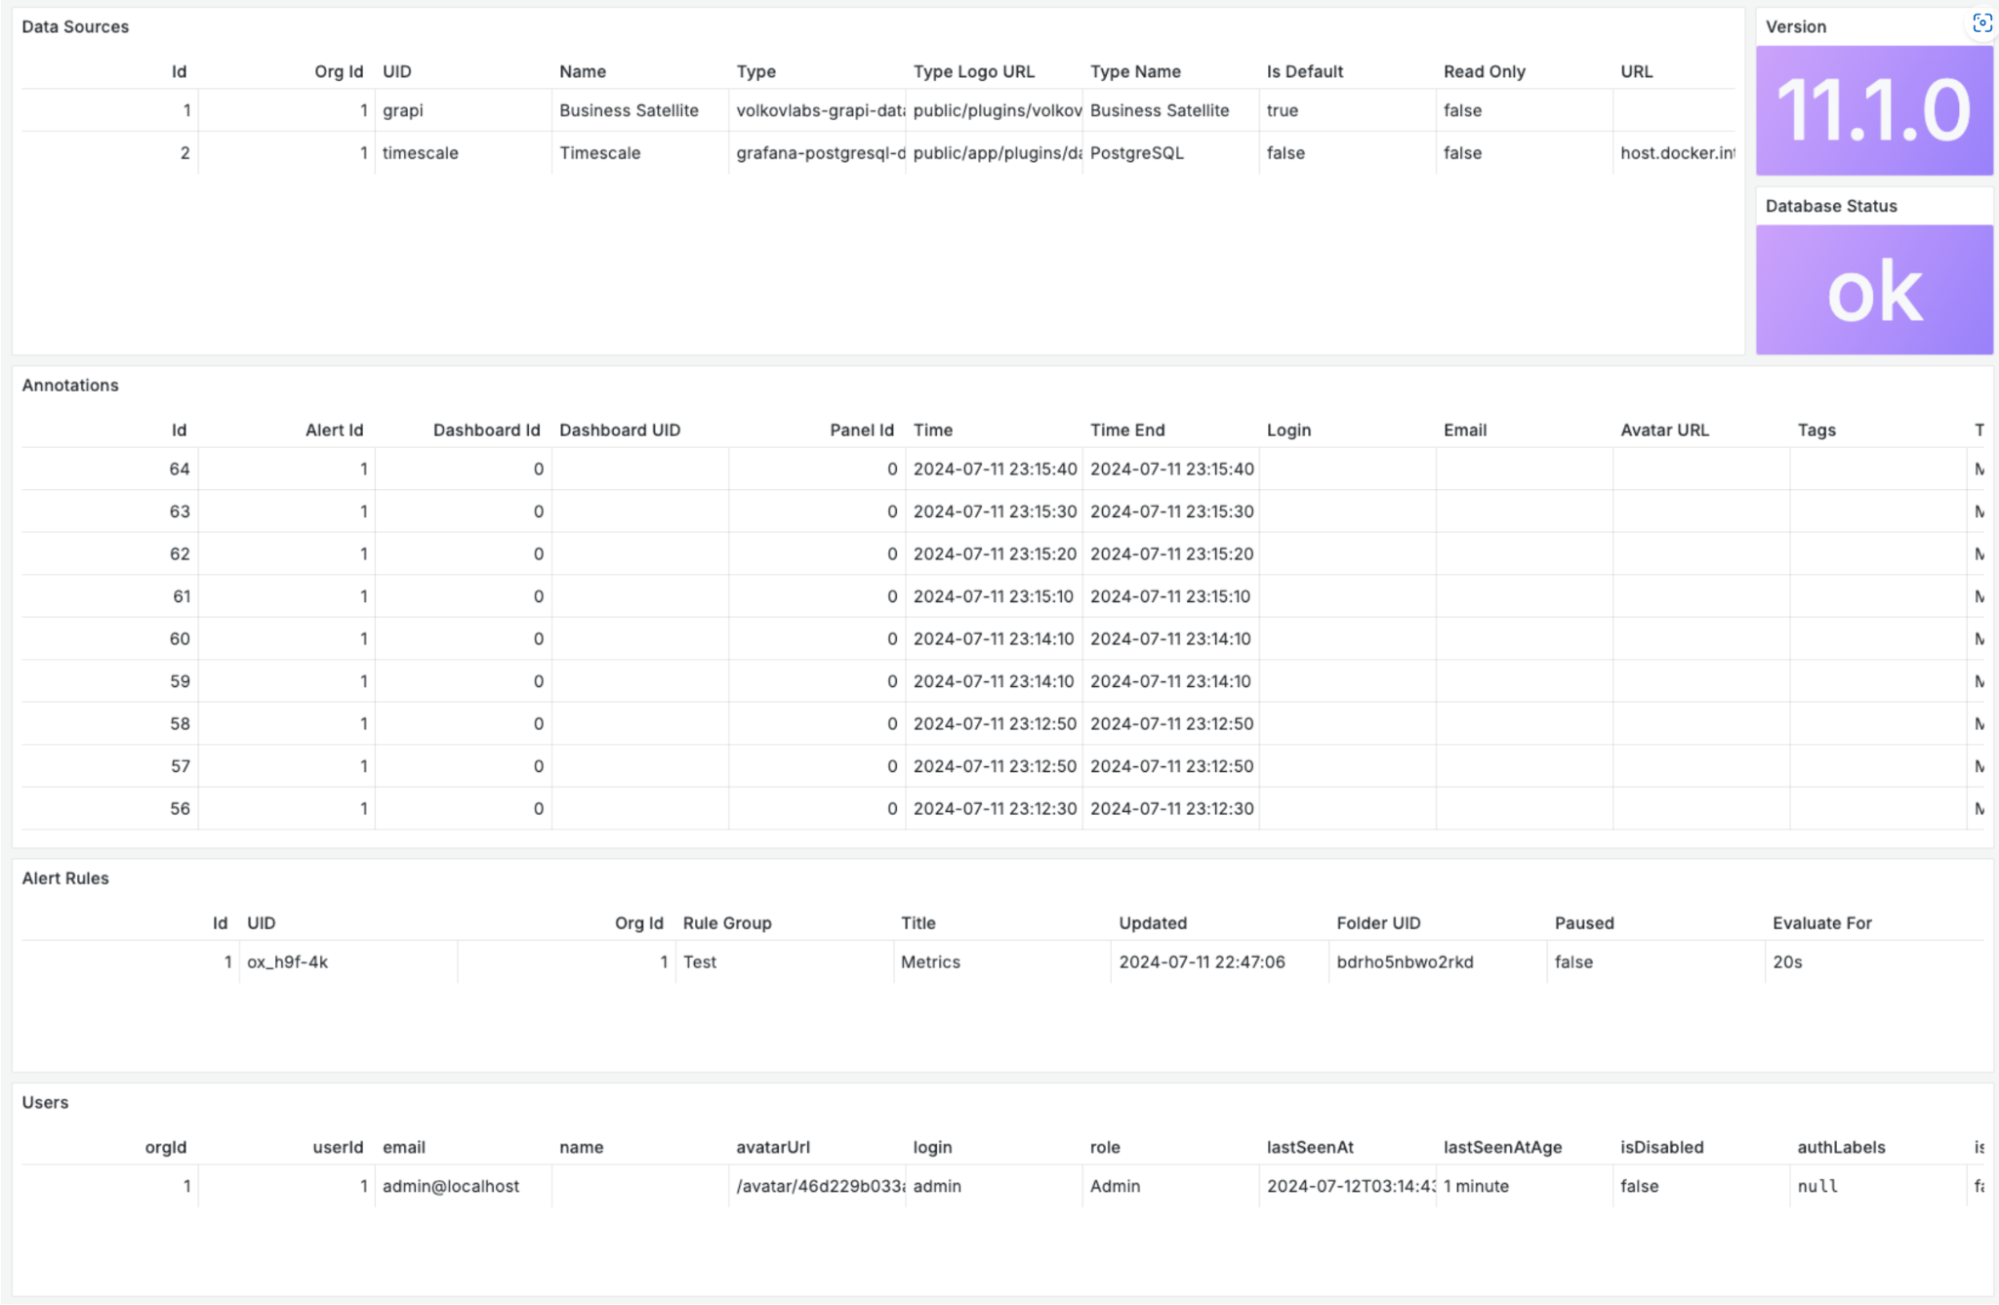
We use this plugin to display alerts and annotation history in a table visualization where we can filter by many criteria such as device name, location, or user.
The plugin also allows you to create a particular setting to work with multiple Grafana instances from one Grafana dashboard. In that setting, you can create one Grafana dashboard to analyze all other Grafana instances in one place. For example, you can ensure you’re using the correct Grafana versions, review the latest modifications (who, what, when), and many other things.
The best way to start with the Business Satellite data source is to do the following:
- Install the Business Satellite data source from the Grafana catalog.
- Add a new data source and configure it to be in the “Local” request mode.
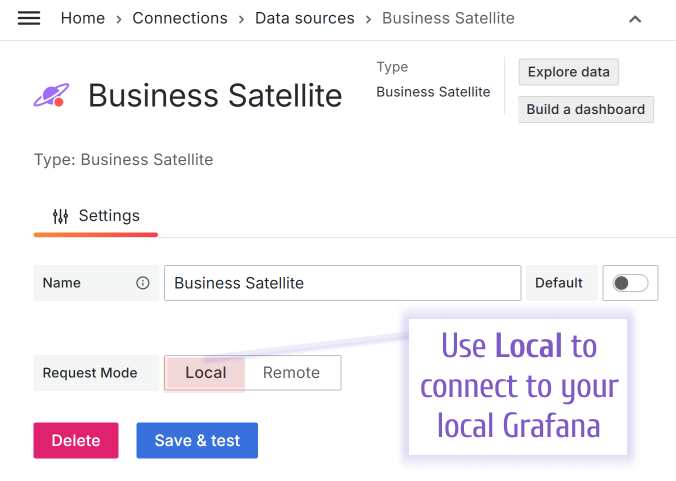
Use Local to quickly start with the Business Satellite data source.
- Add a visualization panel and connect to the newly created Business data source.
- Review all available request types and what they fetch.
Business Charts panel
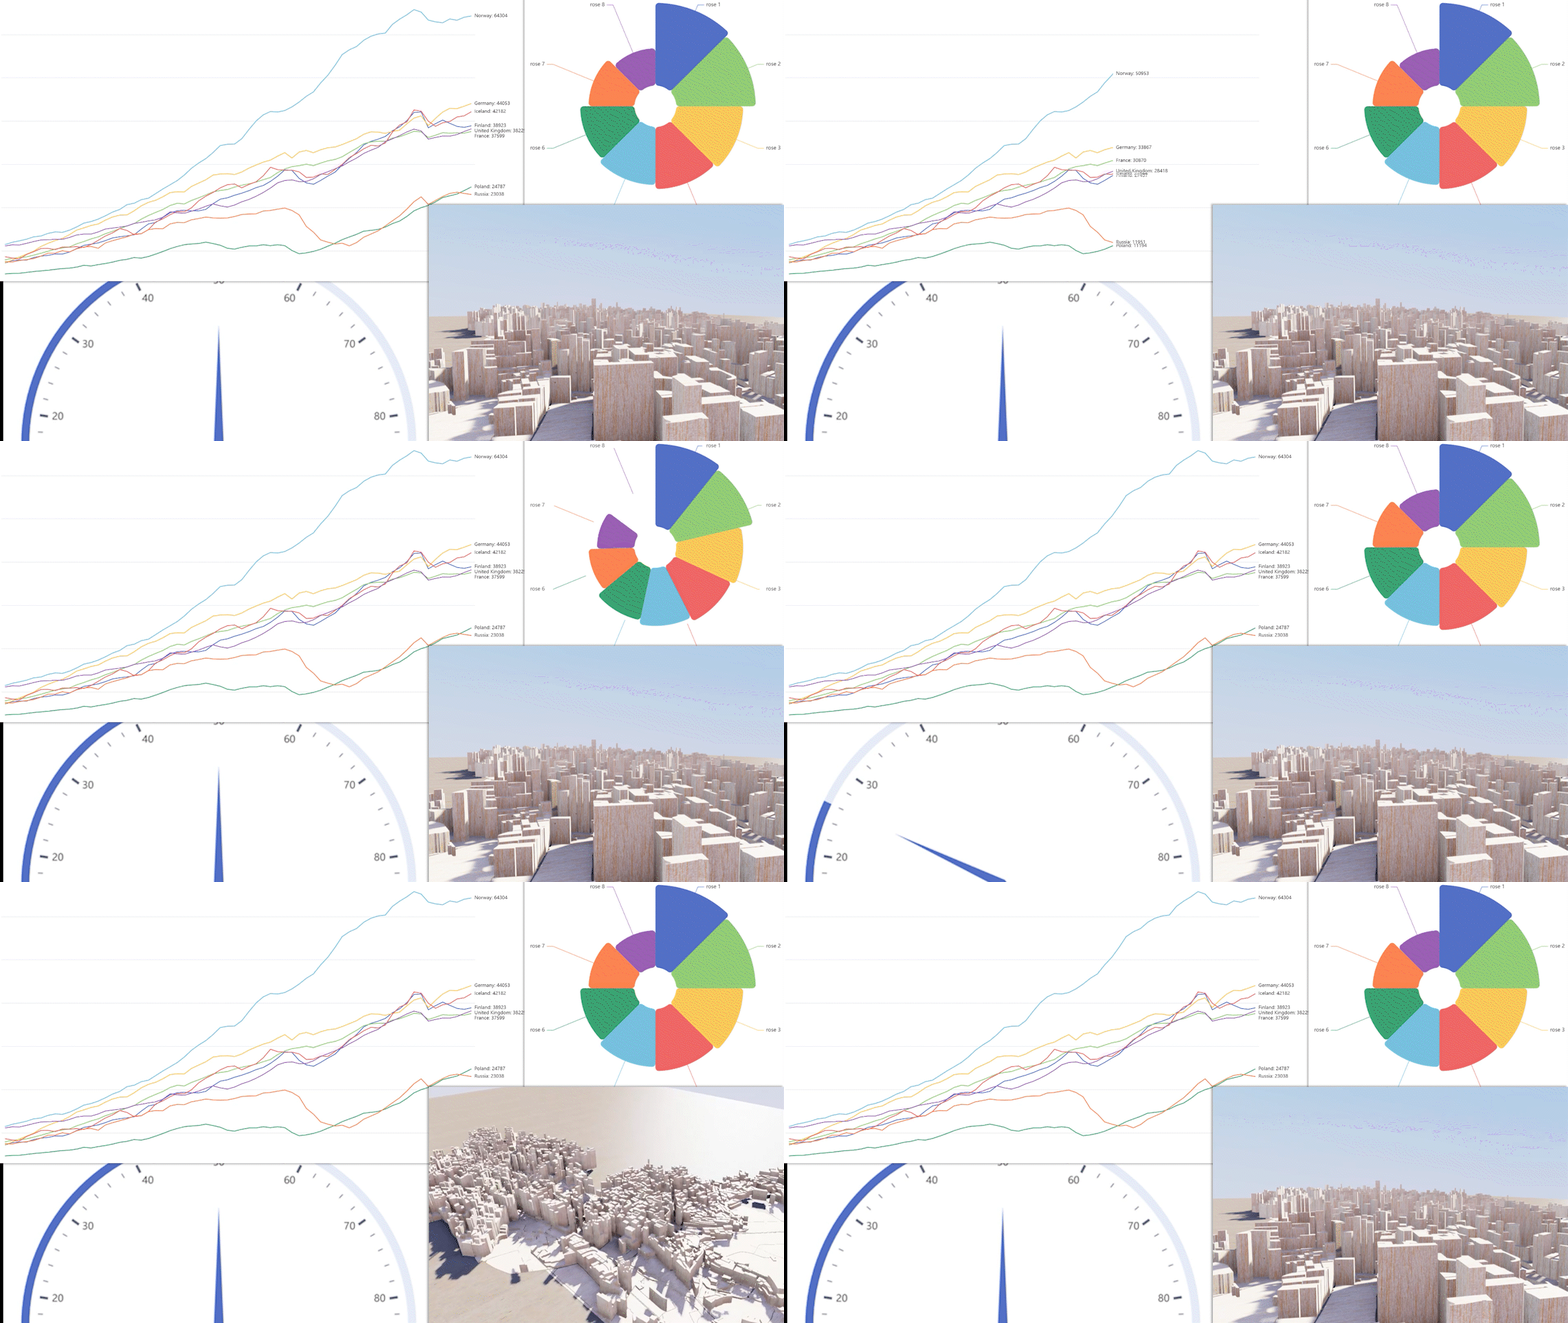
With the Business Charts panel, which is powered by the Apache ECharts library, you can build highly customizable charts of any kind, from simple lines, bars, radar, and theme rivers to maps and 3D simulations.
Every element is configurable. For instance, you can style fonts, colors, distances, positions, animation, and any other thing that comes to mind. We are yet to find what can’t be customized in this panel. The graphs can be dynamic or transforming from one to another.
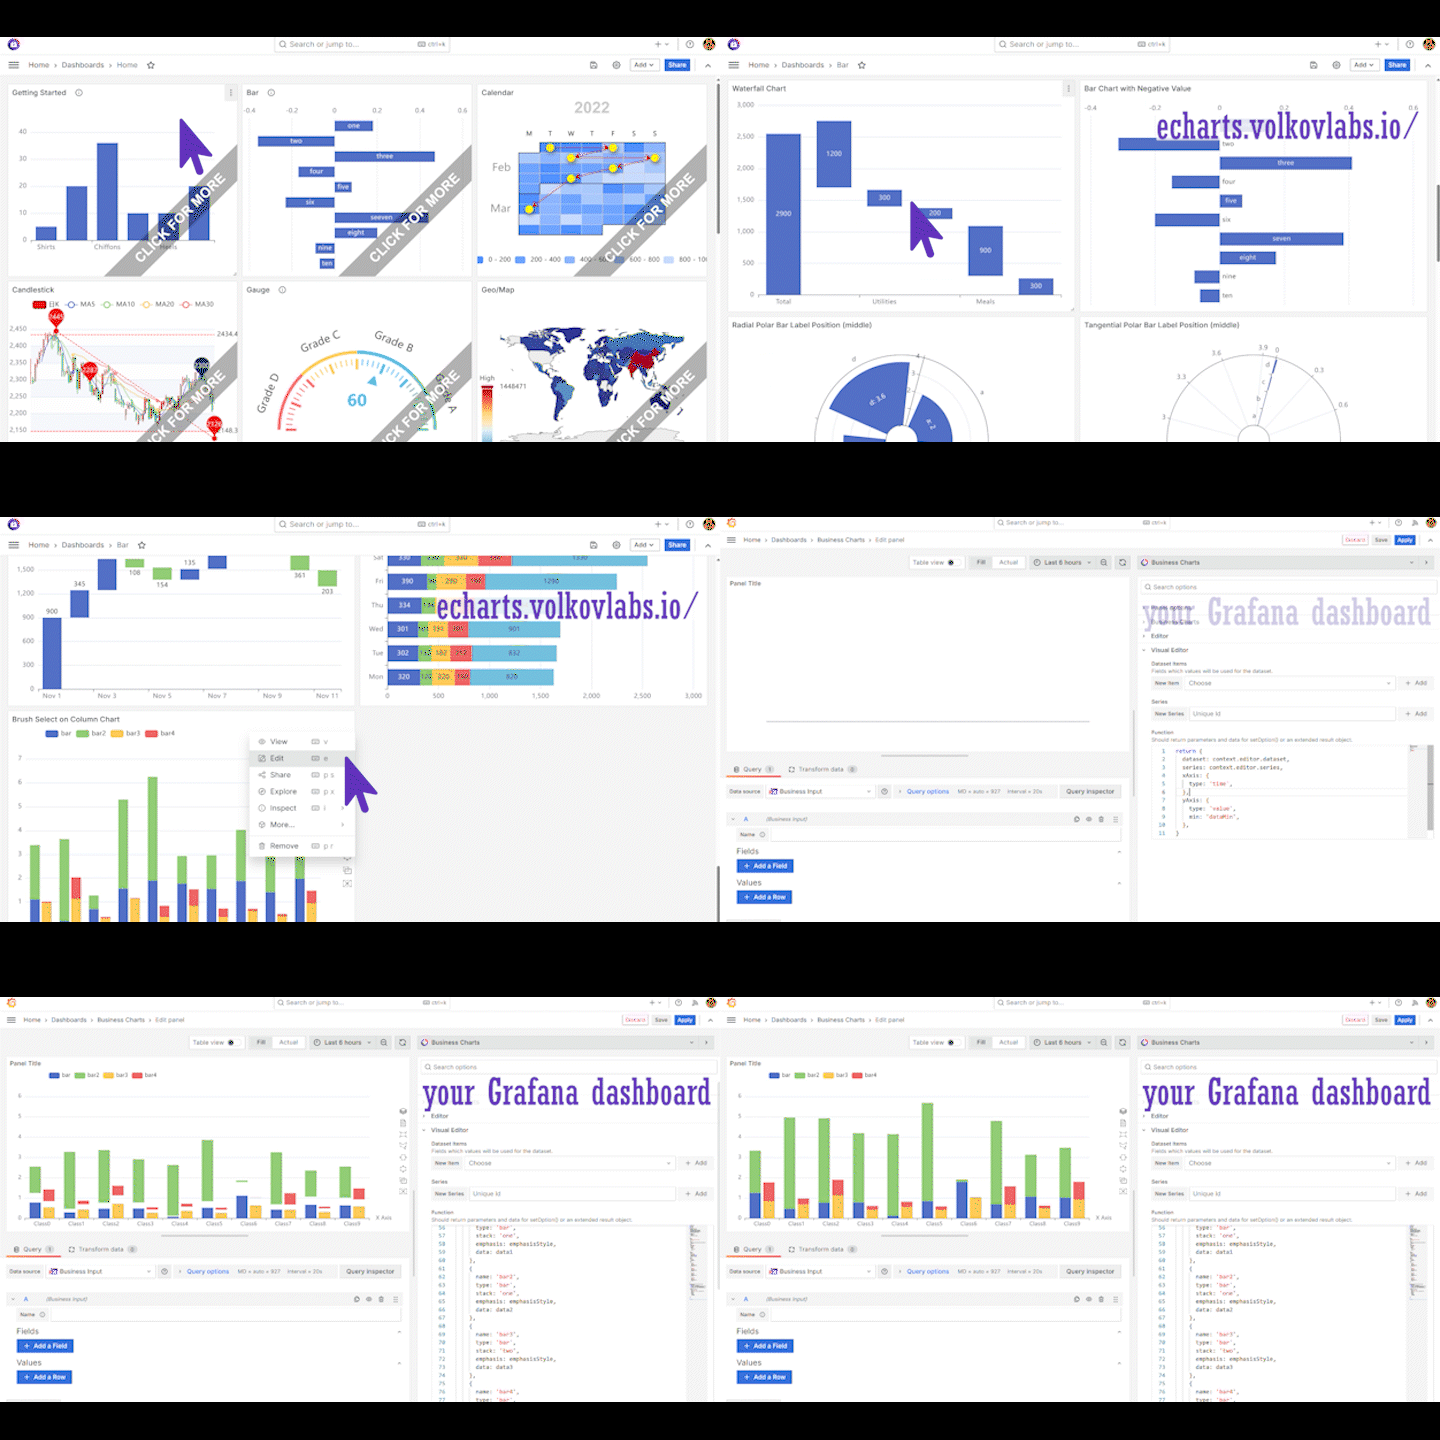
The best way to start with the Business Charts is to do the following:
- Visit our demo project.
- Pick any category of charts and use the “click for more” link.
- Scroll to review available examples in the selected category and go into ‘Edit’ mode of any chart of your preference.
- Open the Code section and copy the Function context (Ctrl+A, Ctrl+C).
- Go back to your Grafana dashboard, add a new visualization panel — Business Charts.
- Replace the Function option with what you have copied (Ctrl+A, Ctrl+V).
- Save, Apply and you will see the same graph on your Grafana dashboard!
- Start experimenting with the code to achieve the style and functionality you need. Our documentation should help to progress further.
Business Forms panel
The Business Forms panel is a conceptually new plugin for Grafana. It is the first plugin that allows you to insert and update application data, as well as modify configuration directly from your Grafana dashboard.
With this plugin, you can convert any Grafana dashboard into a fully functional web application. For instance, if your dashboard monitors device performance and is able to signal when a certain metric is out of the range (e.g., the temperature is too high), the dashboard users can stay in Grafana to send a signal and turn on a fan (to reduce the temperature).
Another example is using your dashboard to collect data points, like user feedback on the latest changes or any changes in the database (new/updated metrics value).
This plugin is for advanced users who already have particular requirements in mind. And having requirements is a good way to start with this plugin. Over the last two years, we listened carefully to the community needs and were able to come up with the data flow that solves use cases that are known to us.
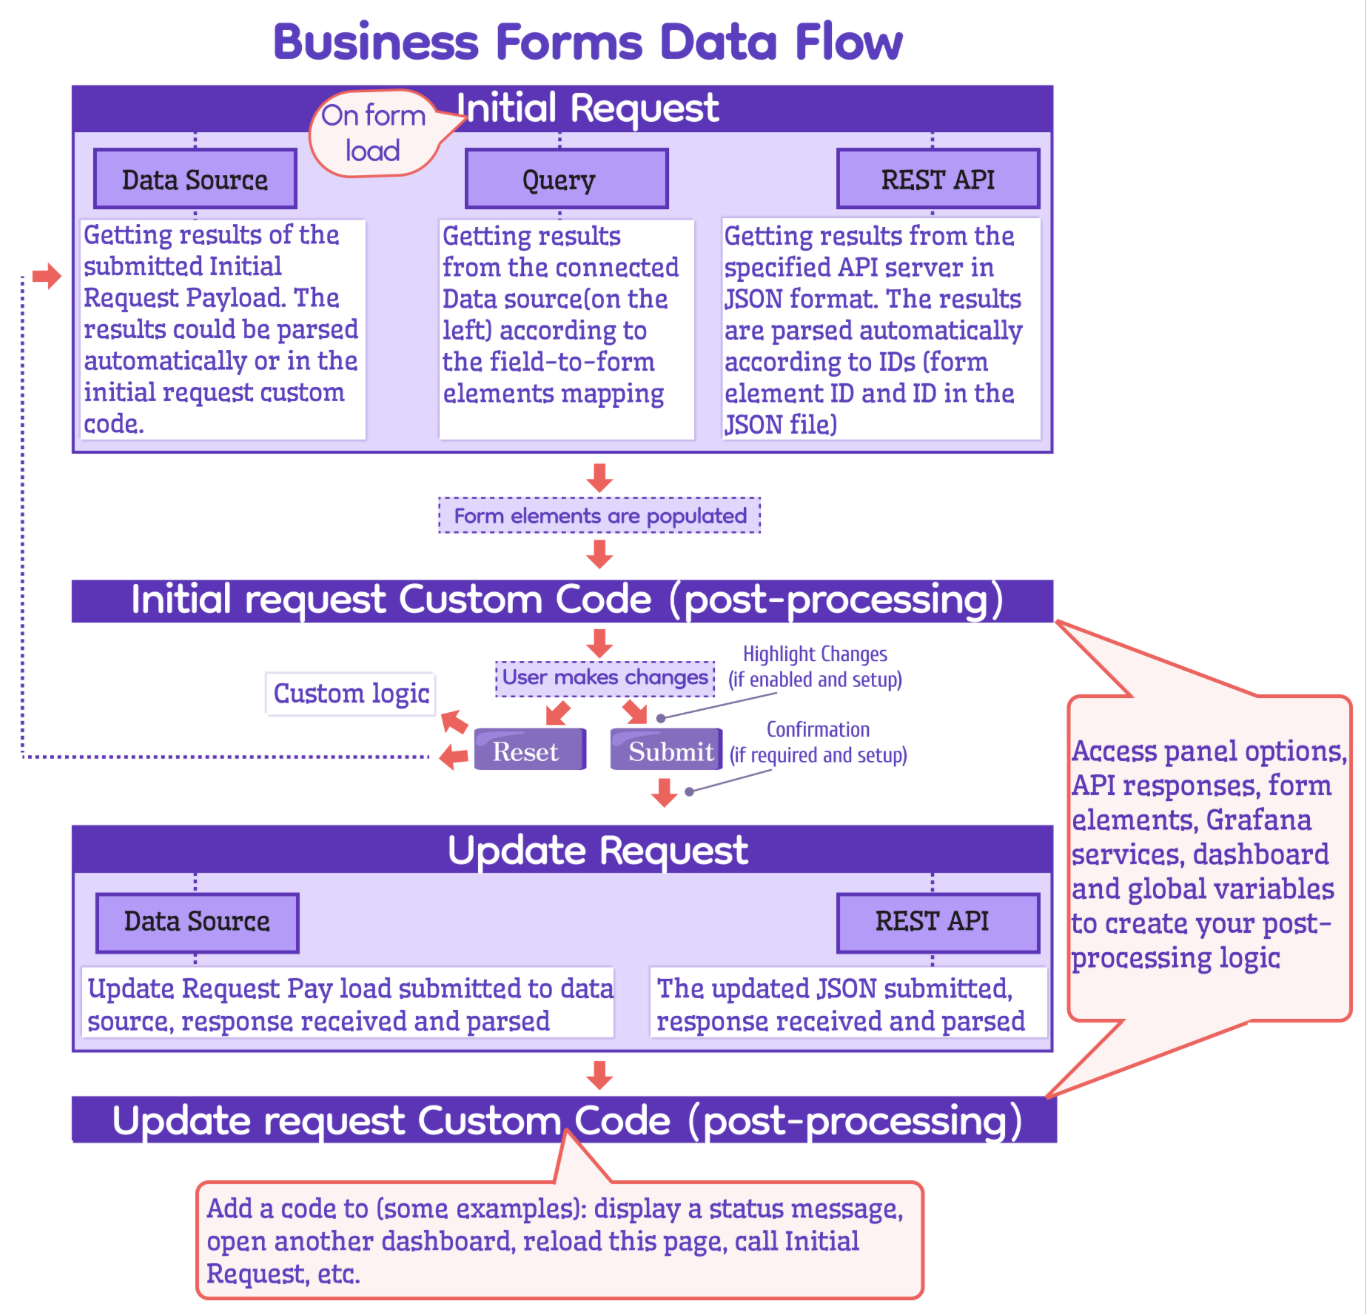
Also, it is important to mention, in the plugin documentation we share a ready-to-use code for five basic API servers, which you are copy/paste into your project:
- InfluxDB API
- JSON
- MySQL
- Node-RED
- PostgreSQL
This should give you a good start in your programming endeavors.
Business Calendar panel
Imagine having all the informational tidbits that you analyze every day neatly organized in one place. Why not add schedules, important events, and release dates to that mix with the Business Calendar panel and seamlessly integrate it with other Grafana features like filters?
The Business Calendar pane brings the Big Calendar library to Grafana with its modern design and incredible performance. Among many other features, enjoy the following capabilities:
- Intuitive multi-language toolbar
- The ability to combine data from any data sources
- Event coloring based on the Grafana thresholds
- Displaying annotations across all dashboards for the specified period
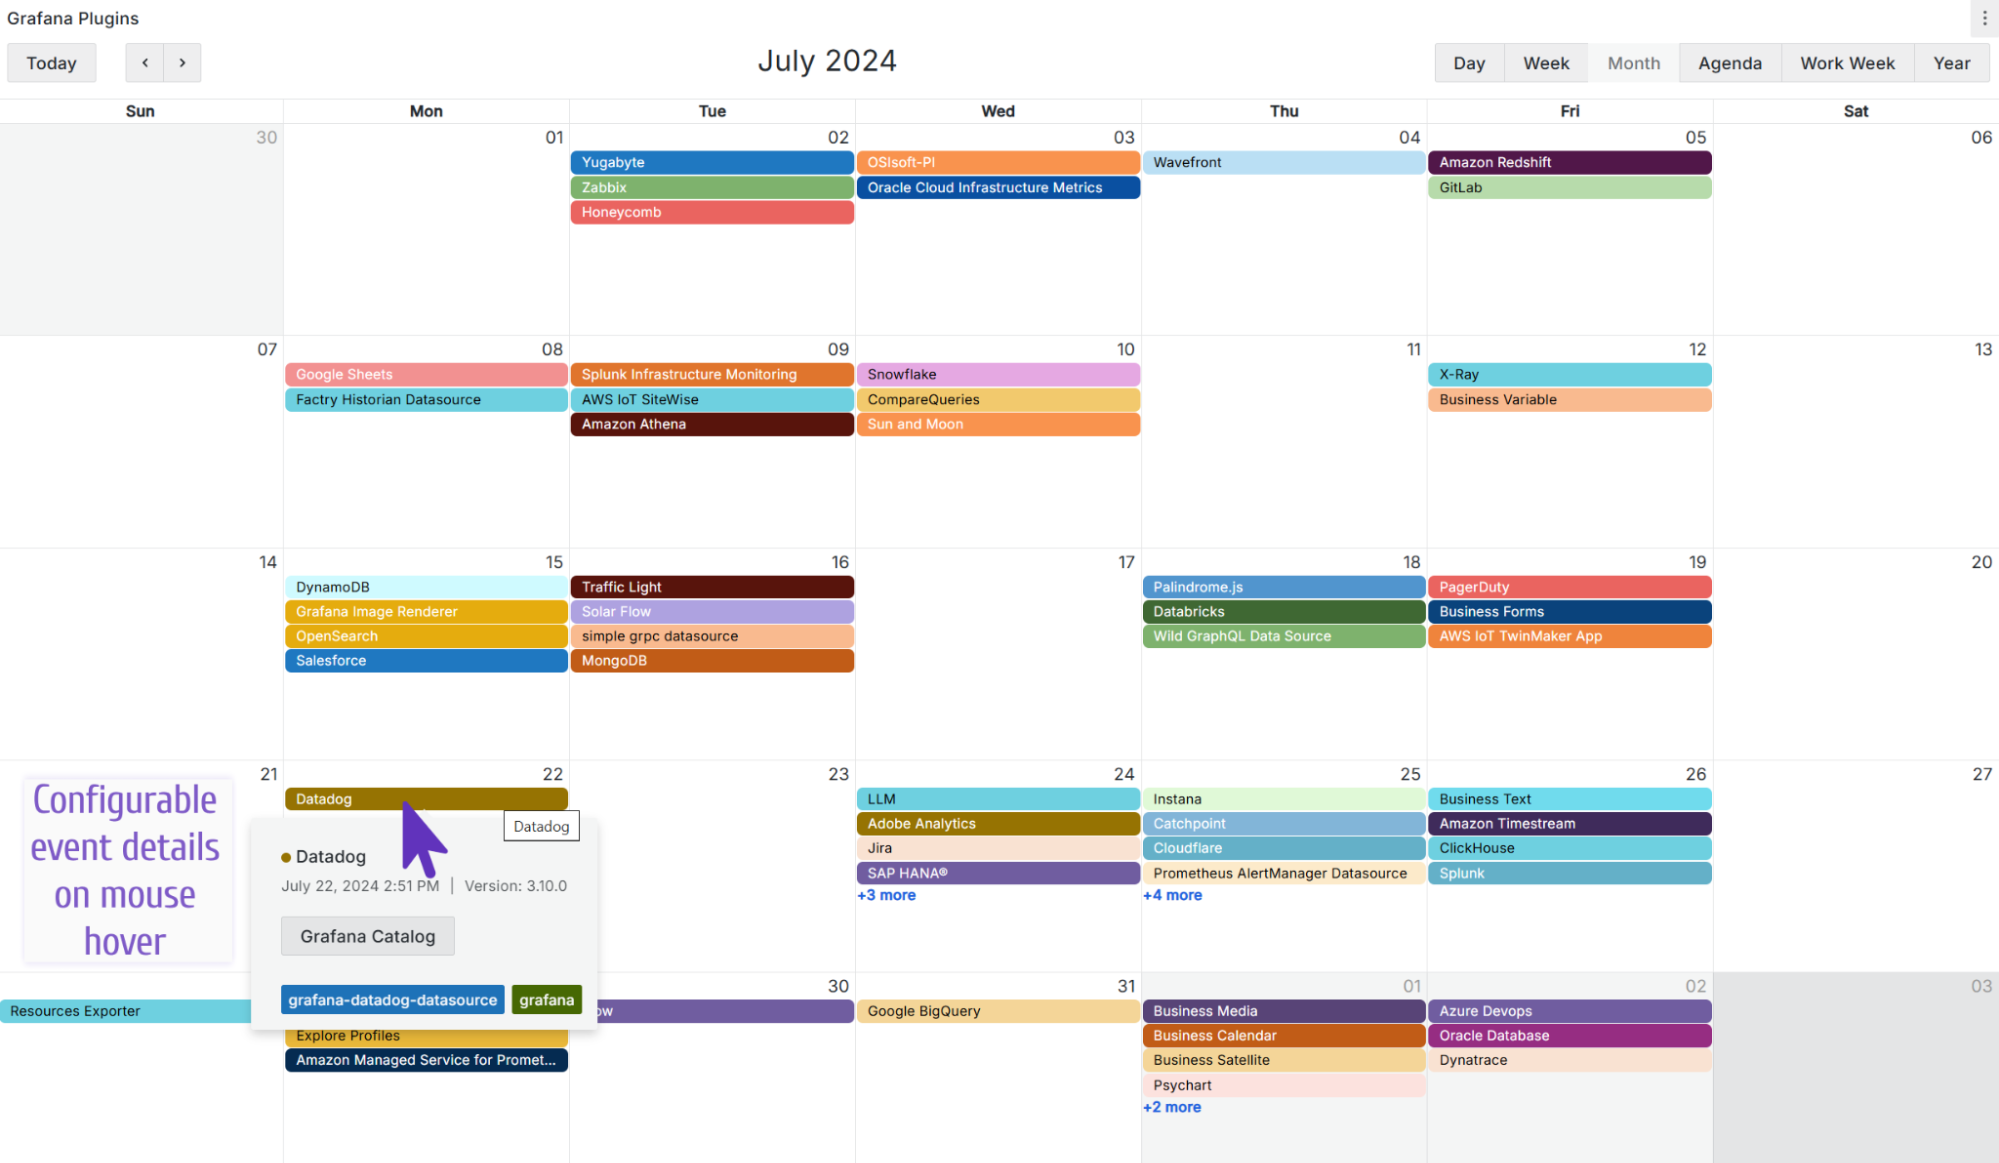
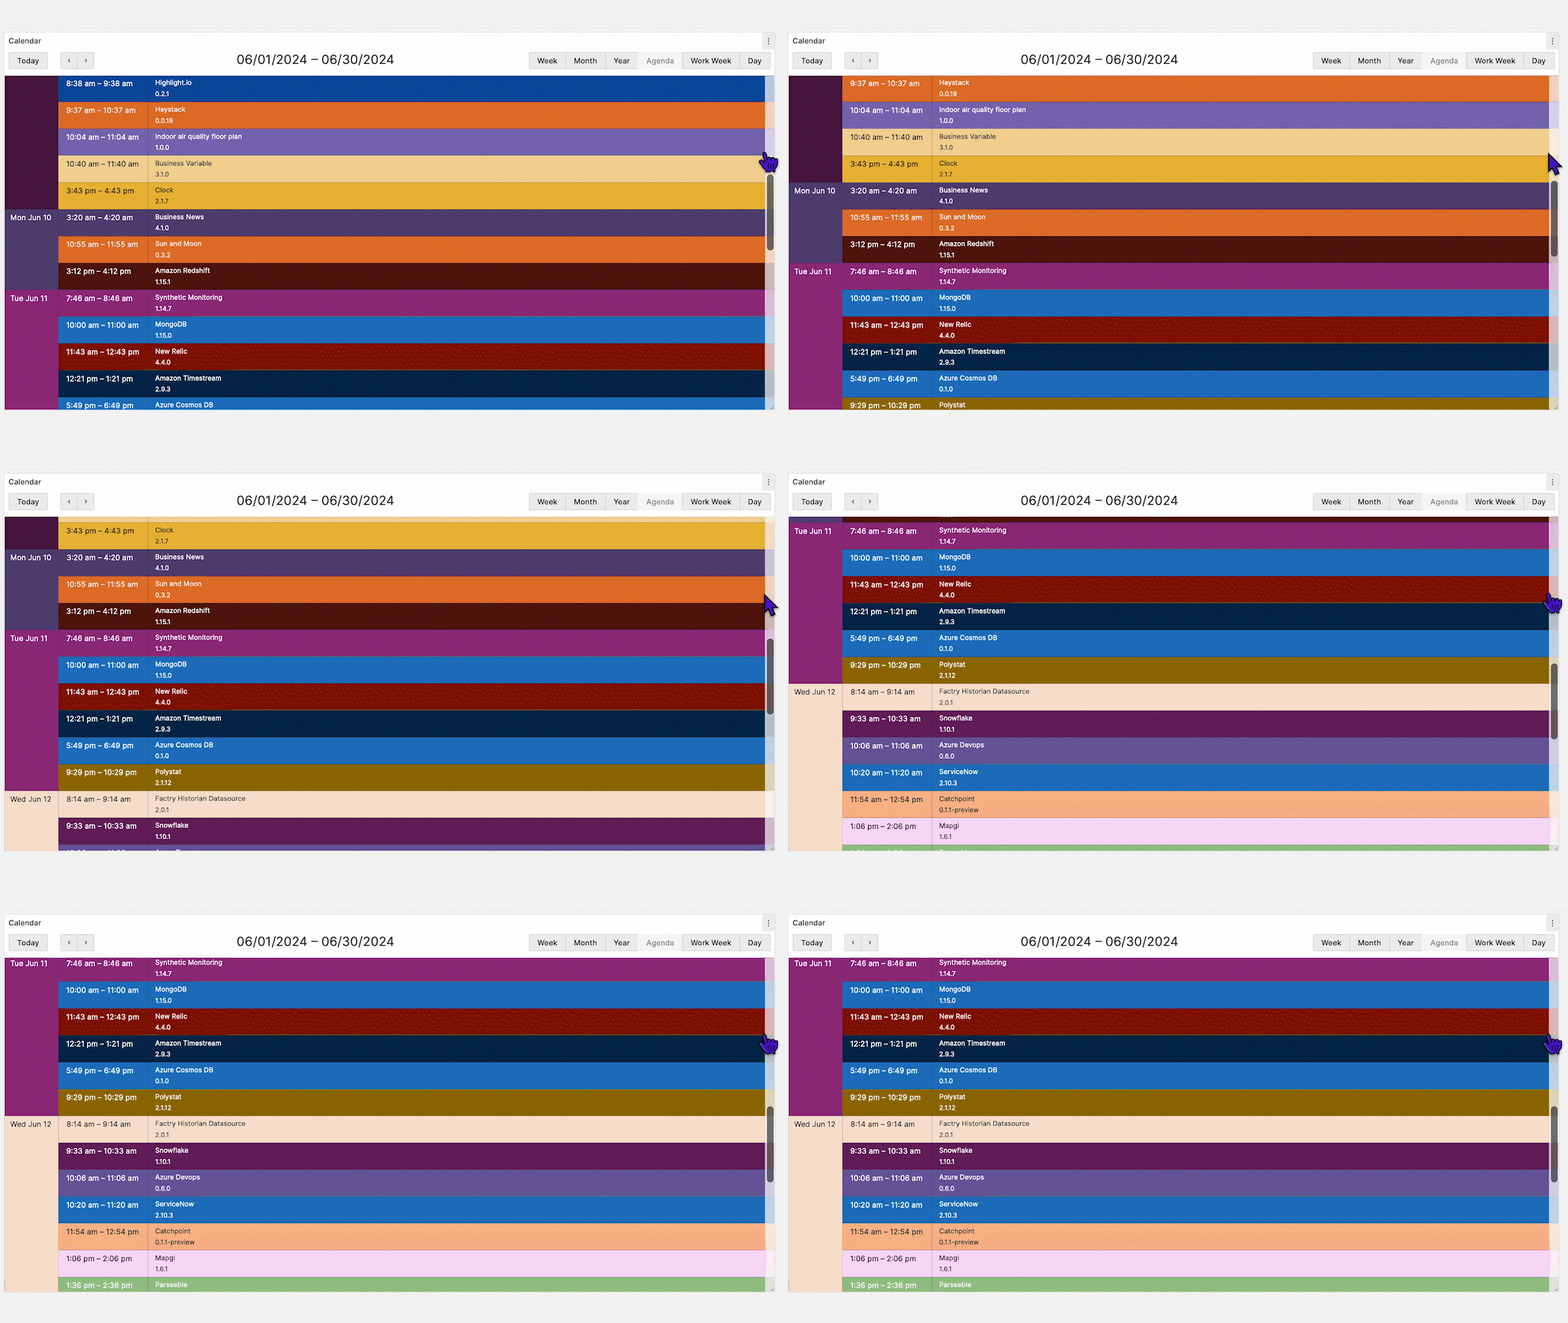
You can start playing with the Business Calendar panel on our demo server following this link.
Business Table panel
We created the Business Table panel to simplify user interaction with table-organized data. Currently, the main features include:
- Summarizing a large amount of data
- Tree view with expandable and collapsible elements
- Supporting tabs for multiple data frame views
- Grafana’s thresholds are incorporated
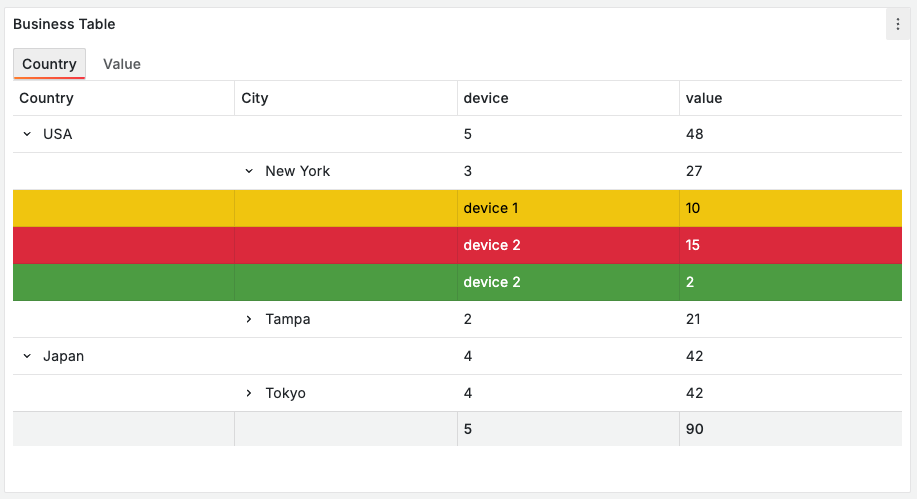
The best way to start with a plugin is to review the details about its first release in our blog post.
What does the future hold?
We are always on the lookout for the latest Grafana news and upcoming features to ensure our plugins are compatible with the latest Grafana updates. Our company blog is the best way to follow our newest plugin releases with new features and demos.
We plan to continue expanding and improving our existing plugins, and the Grafana community is an excellent resource for helping determine what should happen next for each plugin.
We carefully study all the questions we receive on our YouTube channel and GitHub repository, and we use many of them as inspiration. Based on our three years of active interaction with the community, we can attest that those ideas will never cease to pour in.
Grafana is one of a kind, incredible tool that can be a focal point of your web application development. We have productive experience with it and will continue to explore and create together! Bravo Grafana!
Want to share your Grafana story and dashboards with the community? Drop us a note at stories@grafana.com.


