Lower observability bills, reduced MTTR, and more: why companies migrate to Grafana Cloud
There are a lot of factors that go into choosing an observability solution. And even after all that careful consideration, sometimes the platform you initially invest in doesn’t meet your needs, especially as your organization grows and evolves.
For that very reason, we’ve seen users begin their observability journeys with another tool, and then decide to migrate to Grafana Cloud, our fully managed cloud-hosted observability platform. There are several common reasons that seem to prompt the move to Grafana Cloud — from lower observability bills and reduced MTTR to an overall better customer experience.
In this post, three companies share why they chose to migrate from another observability platform to Grafana Cloud, and the benefits they’ve seen since making that move.
1. Increased dev productivity and reduced MTTR
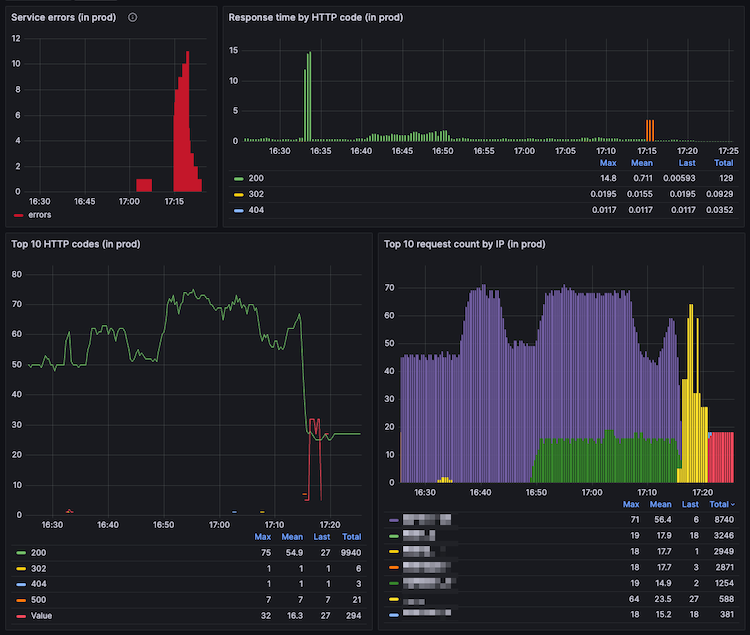
As the largest liquidity network in crypto, Paradigm represents approximately 40% of global cryptocurrency option flows. The company’s platform provides a single point of access to multi-asset, multi-instrument liquidity on demand — and to maintain and manage that platform, Paradigm’s development team relies on Grafana Cloud and Grafana Cloud Logs.
That wasn’t always the case, however. Before moving to Grafana Cloud Logs, the team used another platform for logging, but felt like “they needed to get insights from logs that we just weren’t getting,” said Jameel Al-Aziz, former software architect at Paradigm, in 2023.
Ultimately, transitioning to Grafana Cloud helped the team significantly improve their logging and monitoring capabilities, leading to enhanced developer engagement, increased trust in their data, and better issue diagnosis and resolution.
“One huge benefit has been developer happiness,” Al-Aziz said. “When I look at the success of a logging tool, I look at engagement and whether the team is actively using the tool. The level of engagement we saw with Grafana Cloud Logs was astounding. We planted the seed with a few folks and then, very organically, more people just started using it.”
The time it took to diagnose and resolve issues also improved significantly after the migration, according to Al-Aziz.
“With our previous platform, everybody dreaded logging in to find information,” he said. “Now, we have [multiple] people looking at logs, slicing and dicing in different ways, and feeling empowered to find information and root causes. It’s a totally different ballgame.

Learn more about Paradigm’s move to Grafana Cloud Logs.
2. A better cultural fit (with ‘revolutionary’ results)
ComplyAdvantage, a provider of compliance and risk management tools, understands how critical it is to have full visibility into your systems.
To that end, the company deals with roughly six billion spans per day, not including those that are flowing through Istio, an open source service mesh that helps run distributed, microservices-based apps, explained Adam Wilson, Principal SRE at ComplyAdvantage. In his talk at ObservabilityCON 2023, Wilson outlined how the company also has about 41 Kubernetes clusters and nearly 2,000 nodes, with about 20% of its metric series in OpenTelemetry while the rest are in Prometheus.
ComplyAdvantage chose OpenTelemetry because it was open source and vendor-neutral, and also because of its drop-in instrumentation. “You can start off with just a few lines of code and get maximum benefit from it,” Wilson said.
ComplyAdvantage also used on-premises Grafana OSS, but eventually migrated to a different, proprietary observability platform for logging. After that migration, however, the team felt like their culture didn’t mesh with the vendor they chose.
“It was very much like we were talking different languages,” Wilson said of the vendor. So they began to look, once again, for a new vendor for their observability backend.
After discussions with Grafana Labs, he said returning to their Grafana roots with Grafana Cloud “made absolute sense.” The fact that Grafana has an open source background was appealing, so the technical teams from both sides spoke, and “everything gelled much, much, much better,” said Wilson.
The timeline for ComplyAdvantage’s migration to Grafana Cloud was relatively fast, Wilson said, because they were using OpenTelemetry. Given Grafana Cloud’s native integration with OpenTelemetry, the team didn’t need to re-implement SDKs.
In ComplyAdvantage’s new observability infrastructure, their application monitoring data goes into their gateways, which now use span metrics. Every trace that flows through that first layer of OpenTelemetry gateways has its metadata and metrics extracted and then shipped straight to Grafana Cloud.
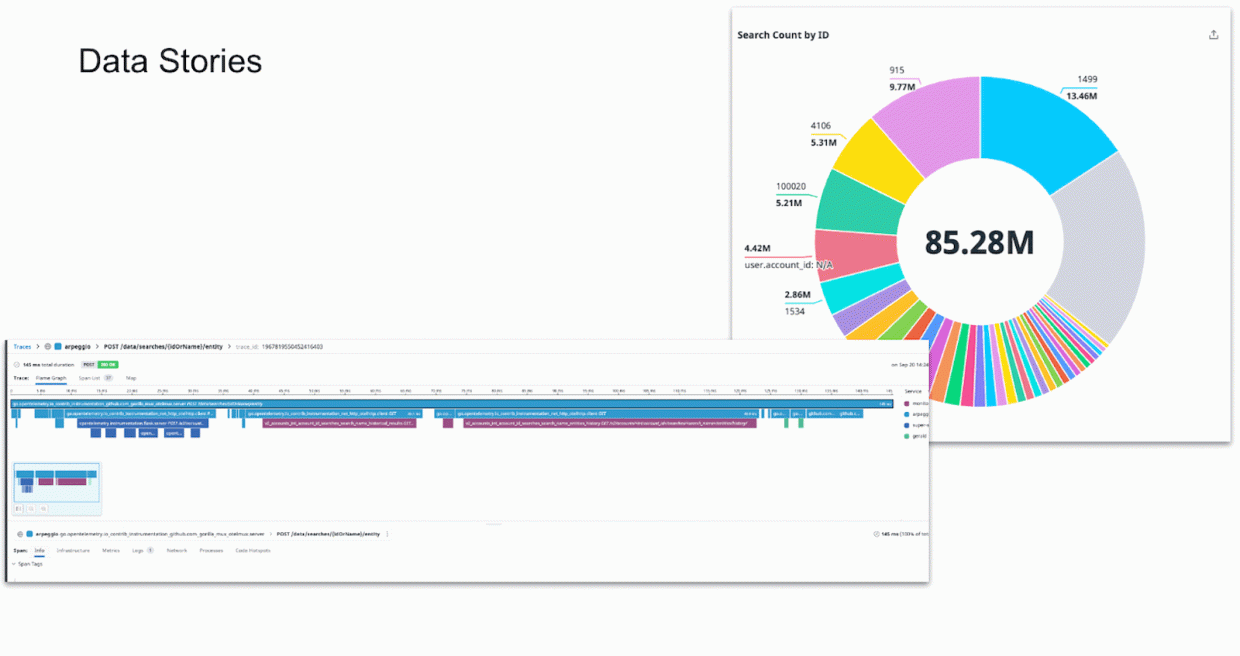
Once the migration to Grafana Cloud was complete, it shifted how people at the company worked. “I think the big thing for us was the change in the way that people started to tell stories with data,” Wilson explained. The company’s CEO, for example, now uses infrastructure data to help shape conversations with customers and partners about how they’re using ComplyAdvantage.
“Being able to have that impact on product, on sales, on that side of the business — just from getting some request headers into our applications — was revolutionary, really,” Wilson said.

To learn more about ComplyAdvantage’s migration to Grafana Cloud, you can watch Wilson’s talk at ObservabilityCON 2023 and check out this blog post.
3. A single-pane-of-glass view (and more cost savings)
Actian, the data analytics and management division of HCLSoftware, runs a distributed IT infrastructure, consisting of more than 70 Kubernetes clusters spread across AWS, Azure, and Google Cloud Platform. To gain visibility into that infrastructure, the team used to rely on a mix of three different observability tools — and three different agents — for synthetic monitoring, metrics, and logs.
The challenge with that setup, however, was that the team had to support and maintain three disparate tools. And, if they had to troubleshoot an issue, they had to bounce between those three tools to find the answers they needed.
Seeking a solution to help unify their monitoring environment, they turned to Grafana Cloud.
“We now have one tool for anything and everything [related to] observability,” said Suleyman Kutlu, Lead Cloud Operations Engineer at Actian, during a talk at ObservabilityCON 2023. “We don’t need to switch between consoles in order to analyze a crisis or an incident.”
In addition to Grafana Cloud, the team uses Grafana k6 for performance testing, Grafana Faro for real user monitoring, and also deployed Grafana OSS for their non-production environments, allowing them to extend their observability strategy across dev, testing, staging, and production.
“We have the ability with Grafana to implement the same level of observability in every environment. In the past, this was not possible because of costs,” Kutlu said, continuing: “It’s the same code, the same agent, the same level of observability and dashboards, so we can see a problem earlier in the development environment and fix it before it goes to production.”
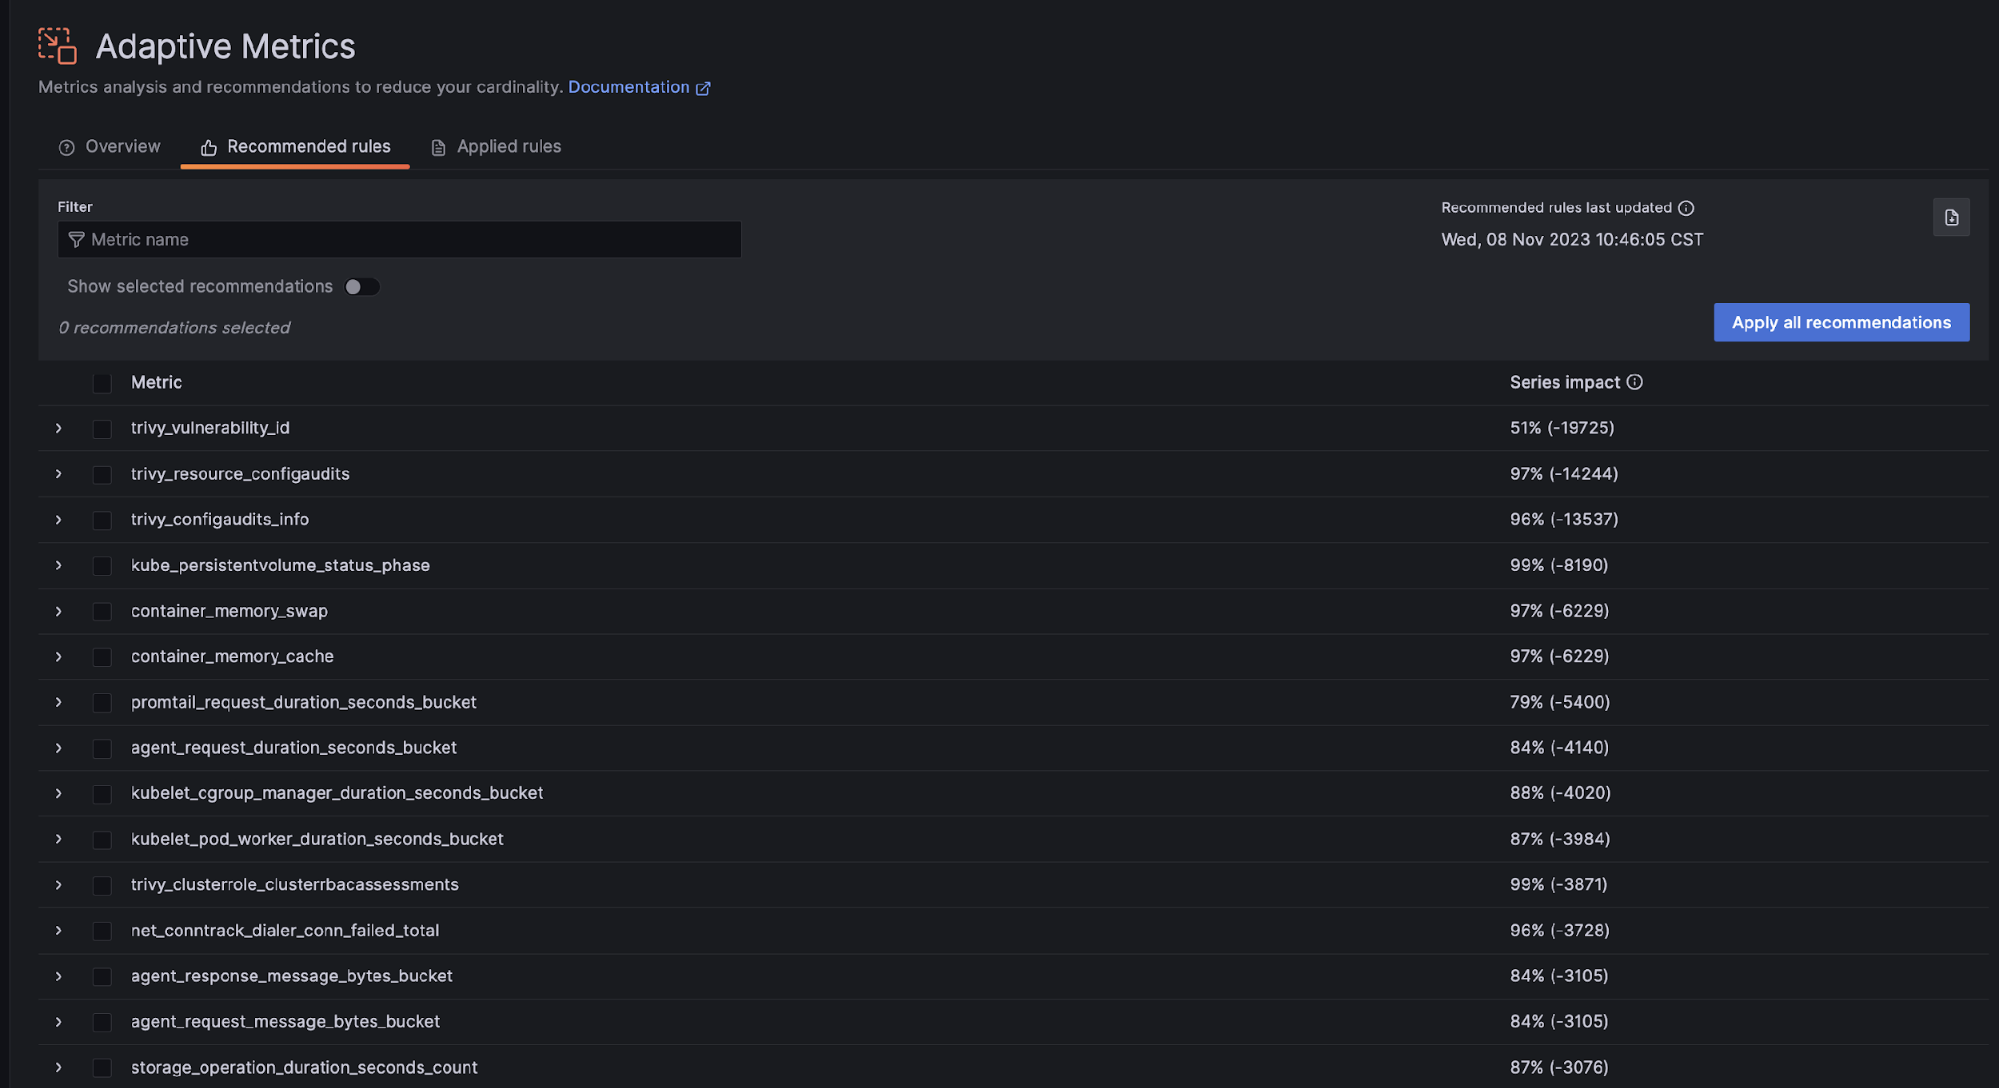
The team also saw a “dramatic cost reduction” when they migrated from their three previous observability platforms to Grafana Cloud — and expect even further cost savings as they continue to ramp up with Adaptive Metrics, a feature in Grafana Cloud that leverages AI/ML techniques to analyze observability data at scale and enables teams to aggregate unused and partially used metrics into lower cardinality versions of themselves to cut costs.

To learn more about Actian’s experience with Grafana Cloud, check out their ObservabilityCON 2023 session.
Grafana Cloud is the easiest way to get started with metrics, logs, traces, dashboards, and more. We have a generous forever-free tier and plans for every use case. Sign up for free now!


