How to visualize vehicle CAN bus data with the Amazon Athena data source for Grafana
Martin Falch, co-owner and head of sales and marketing at CSS Electronics, is an expert on CAN bus data. Martin works closely with end users, typically OEM engineers, across diverse industries, including automotive, maritime, and industrial. He is passionate about data visualization and has been spearheading the integration of the CANedge with Grafana telematics dashboards through various data sources.
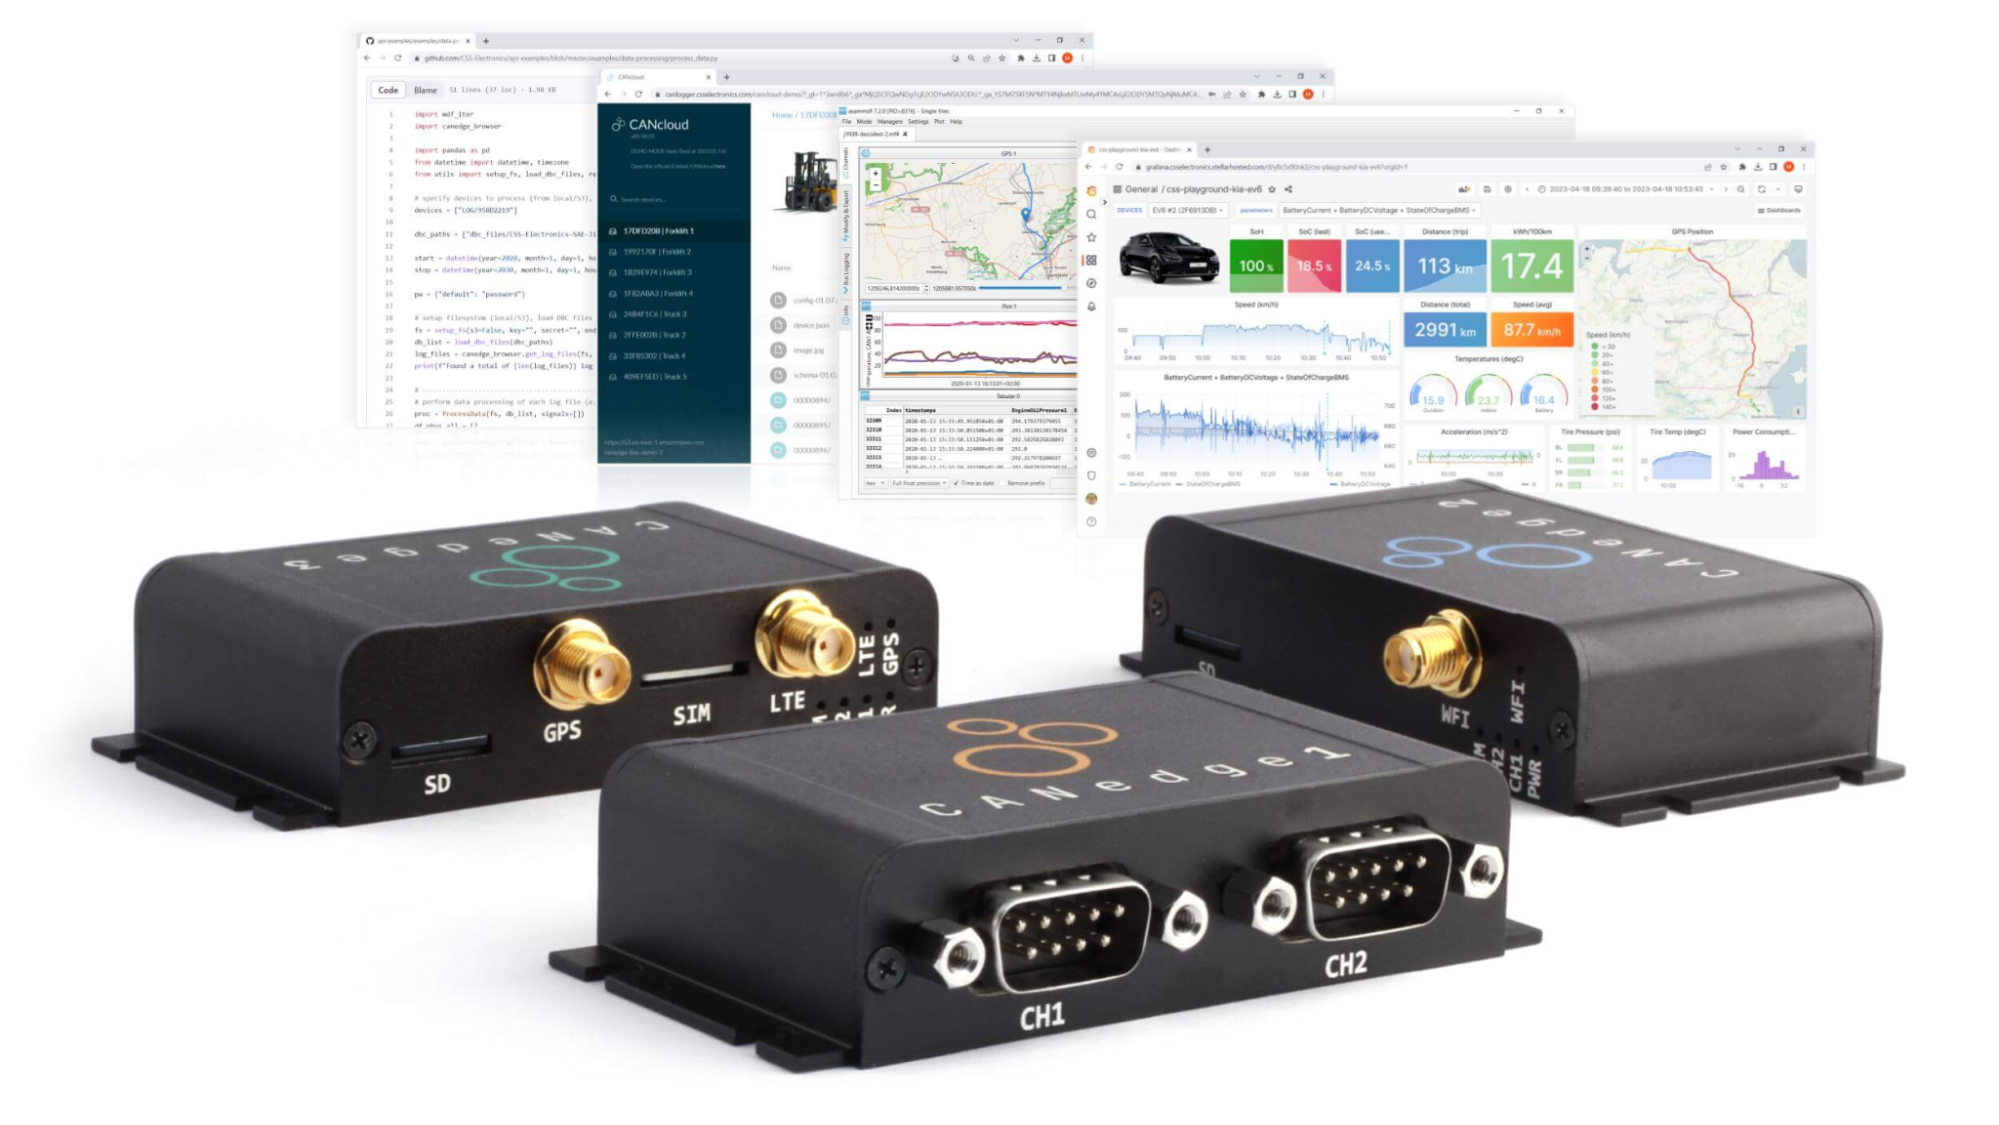
At CSS Electronics, we build professional-grade and simple-to-use Controller Area Network (CAN) bus data loggers. In short, CAN bus is a protocol used for communicating sensor data within vehicles and machinery, including trucks, cars, ships, and robots.
Our end users include engineers at automotive and industrial manufacturers (OEMs) who need to monitor assets in the field for R&D, diagnostics, or predictive maintenance. A large share of our users also visualize their data via Grafana dashboards. In this blog post, we discuss the workflow involved in achieving this — and how we help our users solve their unique challenges by utilizing the Amazon Athena data source for Grafana.

Note: More than 500 users of CSS Electronics’ devices have deployed the Amazon Athena data source for Grafana to visualize CAN bus data. Our users leverage the data source as part of a broader workflow for data visualization — specifically, automatic data processing via AWS Lambda functions to create Parquet data lakes, as well as Glue jobs running in AWS to map those data lakes. We offer step-by-step guides and technical support to help our users deploy this workflow.
Five integration challenges we wanted to solve
Before choosing the Athena data source for Grafana to help our users visualize their CAN bus data, we were looking to solve five specific challenges.
1. How to decode and prepare raw binary log files
Our CANedge data loggers record raw CAN bus data in a binary file format called MDF (*.MF4). This data consists of timestamped “CAN IDs” and “databytes.” In order for our users to make sense of the data, it needs to be “decoded” to human-readable form via software or API tools and a database file (DBC) that contains information on how to interpret data from a specific application, such as those used in a truck or car.
2. How to enable low-cost dashboard visualization across TBs of data
A single CANedge IoT device connected to, for example, a truck can easily generate 50+ GB of data per month. As a result, users easily need to enable visualization across terabytes of data, which can quickly become expensive if the data is stored suboptimally. At the same time, data queries should be reasonably fast to enable users to effectively work with their data.
3. How to retain the original message timestamps
A typical CAN bus may comprise 10-100 unique CAN messages, each broadcast at separate frequencies. Some messages may be broadcast a few times per second, while others may be broadcast, for example, at 1000+ Hz. We wanted an integration that would allow us to retain these original timestamps, enabling users to both look at data across multiple months and within a single second.
4. How to enable end users to self-deploy everything
Our business model is special: we do not host servers/services at all. Rather, we help enable our end users to set up everything themselves. This is necessary, as most end users are extremely strict on data sensitivity, but it requires that everything is extremely simple to deploy.
5. How to stay agnostic
Our CANedge devices enable agnostic data collection: users can, for example, use a CANedge1 device to log data to an SD card for offline usage, or a CANedge2/CANedge3 device for data collection via WiFi/LTE to their own Amazon S3 bucket. The latter can be self-hosted via, for example, MinIO, or cloud-hosted. We needed a solution that our users could easily deploy across these backends.

Our solution: Amazon Athena and Grafana
To solve the above, many of our users now use Amazon Athena, a serverless and interactive analytics service within the AWS cloud, as a data source in Grafana.
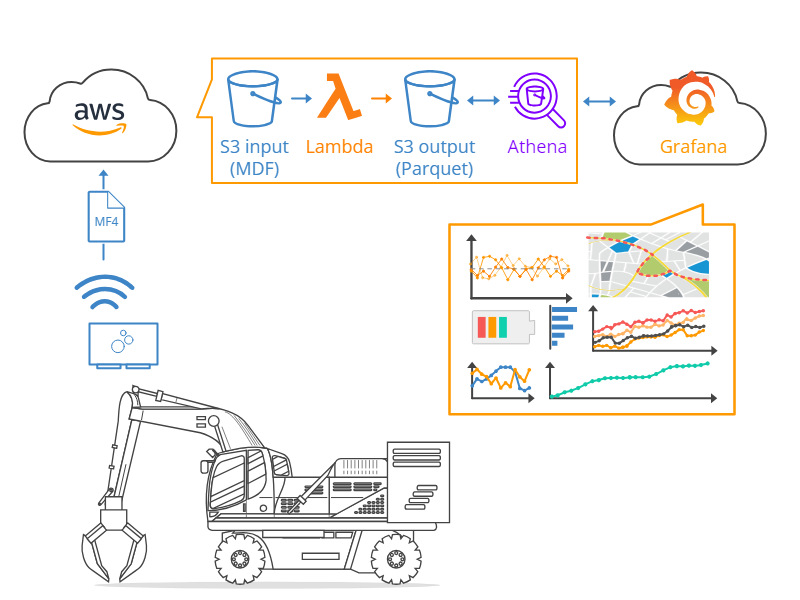
The following reflects the typical Grafana-Athena setup for our users:
- A CANedge device uploads raw CAN/LIN data to an Amazon S3 input bucket
- When a log file is uploaded, it triggers an AWS Lambda function
- The Lambda function DBC decodes the data to Parquet files
- The Parquet files are written to an AWS S3 output bucket
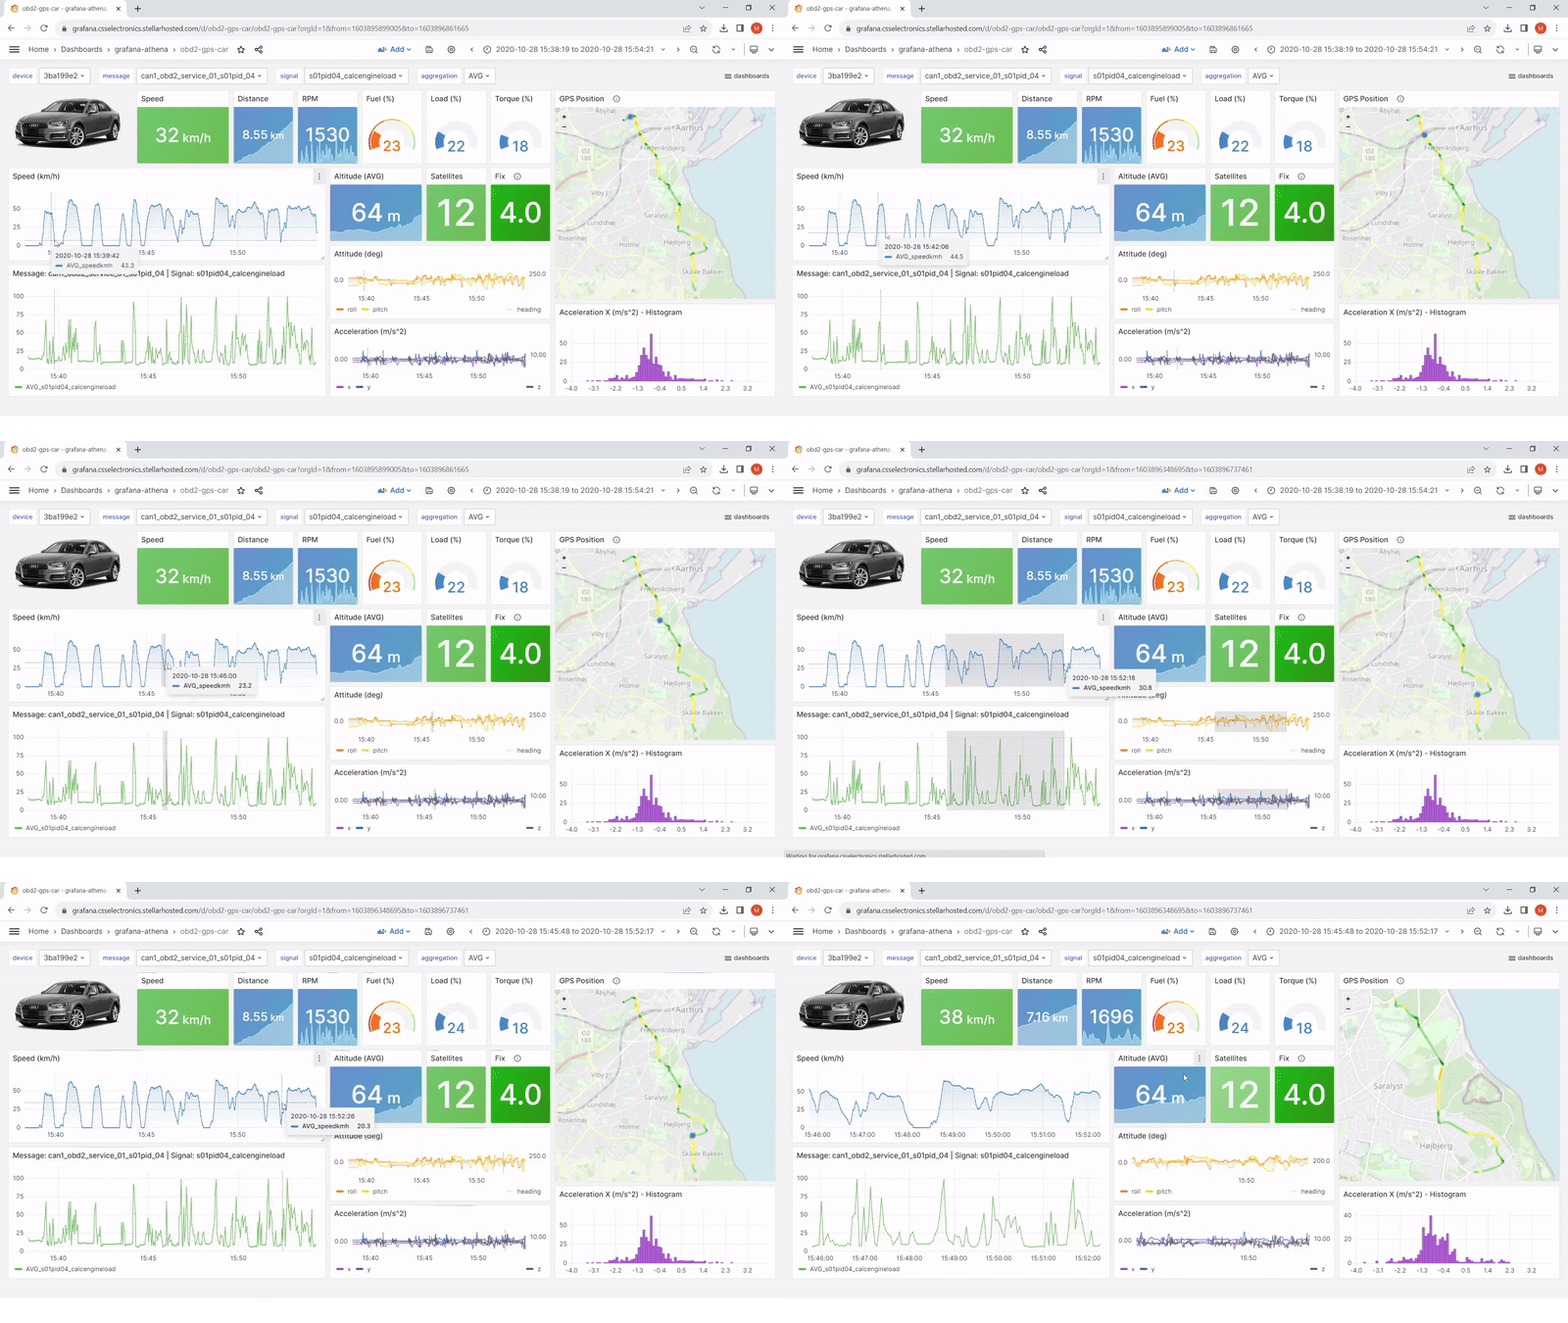
- Grafana visualizes this data lake via the Amazon Athena data source plugin
This setup can be auto-deployed in less than 15 minutes — zero coding required.

This Grafana-Athena deployment is fully self-deployed by our end users, including users that have never worked with Grafana or AWS. To enable this, we provide plug-and-play AWS CloudFormation stacks that end users can deploy via our simple step-by-step guides.
For further details, see our Grafana-Athena page.
Four key benefits of the Grafana-Athena solution
Our users have seen a number of significant benefits from using the Athena data source for Grafana to visualize and monitor their CAN bus data, including:
1. High query performance at extremely low cost
Using Grafana and Athena, the cost for a single CANedge device with 100 GB of queryable data is approximately ~3 USD/device/month, which is very cost-effective. Part of this is because Athena is a serverless solution that is paid-per-query (5$/TB), making the combination excellent for visualizing large data volumes in a setup where the data is infrequently queried.
2. Easy deployment
By preparing agnostic Lambda functions and AWS CloudFormation templates, the Grafana-Athena integration enables every individual user to deploy everything in minutes — without writing a single line of code. Further, Grafana’s open source nature enables our team to prepare dashboard templates for common use cases. Most users simply load one of our plug-and-play JSON dashboard templates, which lets them get started in seconds. We use this to enable dynamic dashboards through variables, where users can browse between different devices and parameters via auto-populated drop downs.
3. Seamlessly analyze data across years (or milliseconds)
The upload log files are automatically decoded and written to an Amazon S3 Parquet data lake. The data lake is structured so that every CAN message is contained in a separate folder, which enables users to retain the original timestamps of every message. In Grafana, users can then leverage standard SQL queries to define each dashboard panel — and seamlessly resample data on-the-fly. In practice, this means end users can effectively visualize data across years and GBs of data, and then seconds later zoom in to visualize intra-second observations matching the original timestamps at which the data was recorded on the CAN bus.
4. Multi-purpose data lake with SQL interface
Our workflow involving the Athena data source for Grafana quickly opens up other use cases. For example, the S3-based Parquet data lake can be directly queried in Python/MATLAB, while the Athena integration can be used in, for example, ODBC-based Excel reports/dashboards. In other words, the Parquet data lake becomes a one-stop shop for all data analysis requirements.
Learn more
Overall, our workflow with the Athena data source for Grafana offers a cost-effective and fast way for our users to visualize and analyze their CAN bus data. It also serves as a blueprint for other companies that wish to enable Grafana dashboard visualization at low cost across large volumes of data.
You can learn more about how our users leverage Athena and Grafana in our intro article, where you can also find our step-by-step guide and sample data for testing it out yourself. You can also check out our public Grafana-Athena dashboard playground.


