The Catchpoint Enterprise data source for Grafana: key features and how to get started
Earlier this year, we were thrilled to announce that Catchpoint is now available as an Enterprise data source for Grafana!
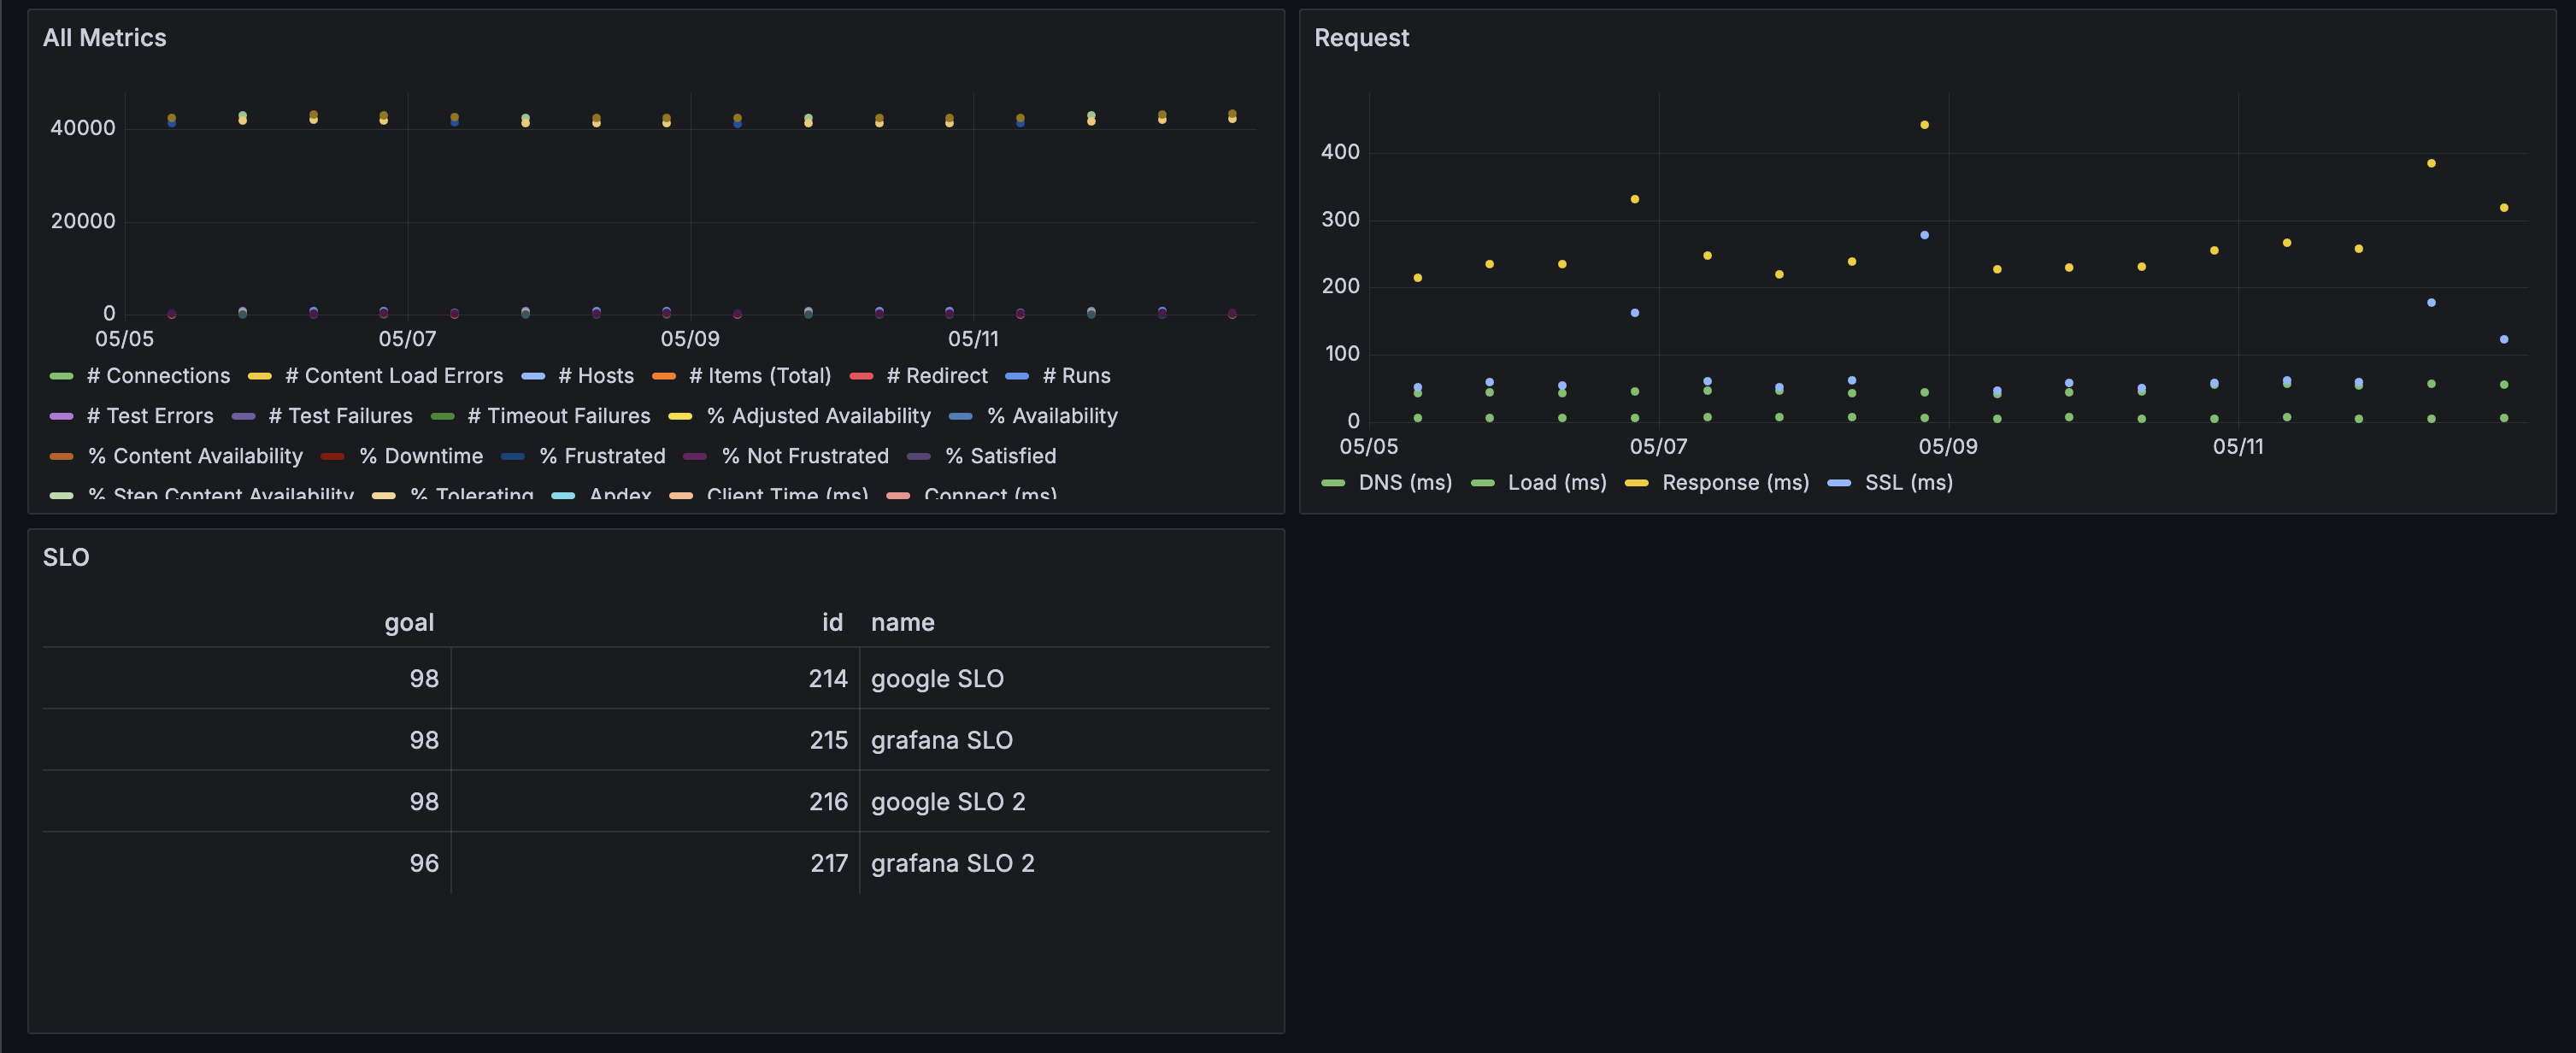
With the public preview release of the Catchpoint Enterprise data source, you can seamlessly bring Catchpoint’s extensive Digital Experience Monitoring (DEM) and Internet Performance Monitoring (IPM) capabilities into your Grafana dashboards, enhancing your ability to visualize and analyze performance metrics in real-time.
Read on to learn more about visualizing Catchpoint data in Grafana, key features of the data source, and how to get started with installation. You can also check out a demo of the data source in the video below.
What is Catchpoint?
Catchpoint is a leading IPM platform that provides comprehensive insights into your infrastructure, applications, and user experiences. With Catchpoint, you can monitor your entire digital ecosystem, identify performance bottlenecks, and ensure optimal performance and availability.
Why integrate Catchpoint with Grafana?
Integrating Catchpoint with Grafana brings a new dimension to your monitoring and visualization toolkit. Here are some key benefits:
Unified monitoring
With the Catchpoint Enterprise data source for Grafana, you can centralize your performance data in one place. Combine Catchpoint’s detailed metrics with other data sources in Grafana to get a holistic view of your digital experience.
Enhanced visualization
Leverage Grafana’s powerful visualization capabilities to create dynamic and interactive dashboards. Visualize Catchpoint data using a variety of panels, customize your views, and gain deeper insights into your performance metrics.

Real-time analysis
The Catchpoint data source allows you to monitor the performance and availability of your internet stack, including web applications and their underlying resources, in real time, enabling you to quickly identify and address potential problems before they impact your users.
Key features
The Catchpoint Enterprise data source plugin for Grafana offers a range of features to enhance your monitoring experience, including:
- Custom queries: Create custom queries, using the
SLO,RUM, andTestquery types, to fetch the exact service-level objective, real user monitoring, and performance testing data you need from Catchpoint. - Comprehensive metrics: Access a wide array of performance metrics, including availability, response time, and more.
- Alerting: Set up alerts in Grafana based on Catchpoint data to stay informed about critical issues.
Getting started
The Catchpoint data source is available in Grafana Enterprise and Grafana Cloud, including in our generous free-forever tier. To get started, follow our technical documentation, which offers detailed instructions on how to install the plugin, configure your data source, and create your first dashboards.
Join the community
We are excited to see how you use the Catchpoint data source to enhance your monitoring capabilities. Join the conversation on our community forums and share your experiences, insights, and feedback. We look forward to hearing from you — and stay tuned for more updates and enhancements in the future!
The easiest way to get started with our Enterprise data source plugins is in Grafana Cloud. We have a generous forever-free tier that includes access to Enterprise data sources for 3 active users. If you haven’t already, sign up for free today!


