Visualize Catchpoint, PagerDuty, and Amazon DynamoDB data: what's new in Grafana Enterprise data source plugins
As part of our big tent philosophy here at Grafana Labs, we believe you should be able to access and derive meaningful insights from your data, regardless of where that data lives.
One of the ways we stay true to that philosophy is through our Grafana Enterprise data sources. Available in Grafana Enterprise and Grafana Cloud, including in our generous free-forever tier, Enterprise data source plugins allow you to connect to external systems from within Grafana, so you can visualize data from a wide range of sources using the Grafana dashboards you already know and love.
Grafana Enterprise data sources are also maintained and supported by Grafana Labs — which means they eliminate the overhead of building and maintaining your own plugins in-house.
“One of the benefits of the Enterprise plugins was that we could deprecate [our existing plugins], just take advantage of the Grafana Cloud offering, and have less code that we need to own and maintain,” said Dylan Morley, Lead Principal Engineer at online fashion and beauty retailer ASOS.
We currently offer more than 30 Enterprise data sources, and continue to expand our line-up so you can connect to and visualize all your go-to data sources.
In this blog, we’ll highlight three Enterprise data sources we’ve recently rolled out — Catchpoint, PagerDuty, and Amazon DynamoDB — and also share details about our new public roadmap for data sources.
Enterprise data sources spotlight: Catchpoint, PagerDuty, and Amazon DynamoDB
Catchpoint
Catchpoint is a digital experience monitoring platform that provides real-time insights into the performance and availability of your internet stack, so you can proactively identify and resolve issues. And with the Catchpoint Enterprise data source, you can query and visualize data from that platform within Grafana.
Currently in public preview, the data source specifically allows you to perform the following three query types on Catchpoint:
Test= Track key metrics related to endpoint performance testing, such as response time and downtime.RUM= Visualize metrics related to real-user monitoring and the end-user experience of your websites and applications.SLO= Monitor metrics related to your organization’s key service-level objectives.
We plan to make more enhancements to the Catchpoint Enterprise data source down the line, including support for additional queries and adding more parameters to queries, so stay tuned. In the meantime, you can check out our technical documentation to learn more.
PagerDuty
With the PagerDuty Enterprise data source, now generally available, you can easily query and visualize data from the PagerDuty incident response and management platform.
The plugin supports two specific actions for operators:
- List incidents: allows you to see a list of all existing incidents within a maximum six-month time span
- Get an incident: allows you to view detailed data related to a single incident
When listing all incidents, the query uses ${__from:date} and ${__to:date} for Since and Until parameters by default, which would fetch incidents created in the dashboard’s selected time frame. You can provide additional parameters, such as incident urgencies or statuses, service IDs, and team IDs. Using Grafana transformations, it’s also possible to combine incidents data to view important stats, such as average resolution time and priority levels (P1, P2, etc.).
When querying data for a single incident, you simply fill in the incident ID.
The plugin also lets you visualize incidents using annotations, so you can correlate incidents with other monitoring data on your Grafana dashboards to help identify root causes, assess incident impact, and perform deeper analysis of historical data.
To learn more about the PagerDuty Enterprise data source, refer to our technical docs.
Amazon DynamoDB
You can now quickly query and visualize data from Amazon DynamoDB — the serverless, NoSQL database service in the AWS cloud — within Grafana dashboards using the Grafana Enterprise data source for Amazon DynamoDB.
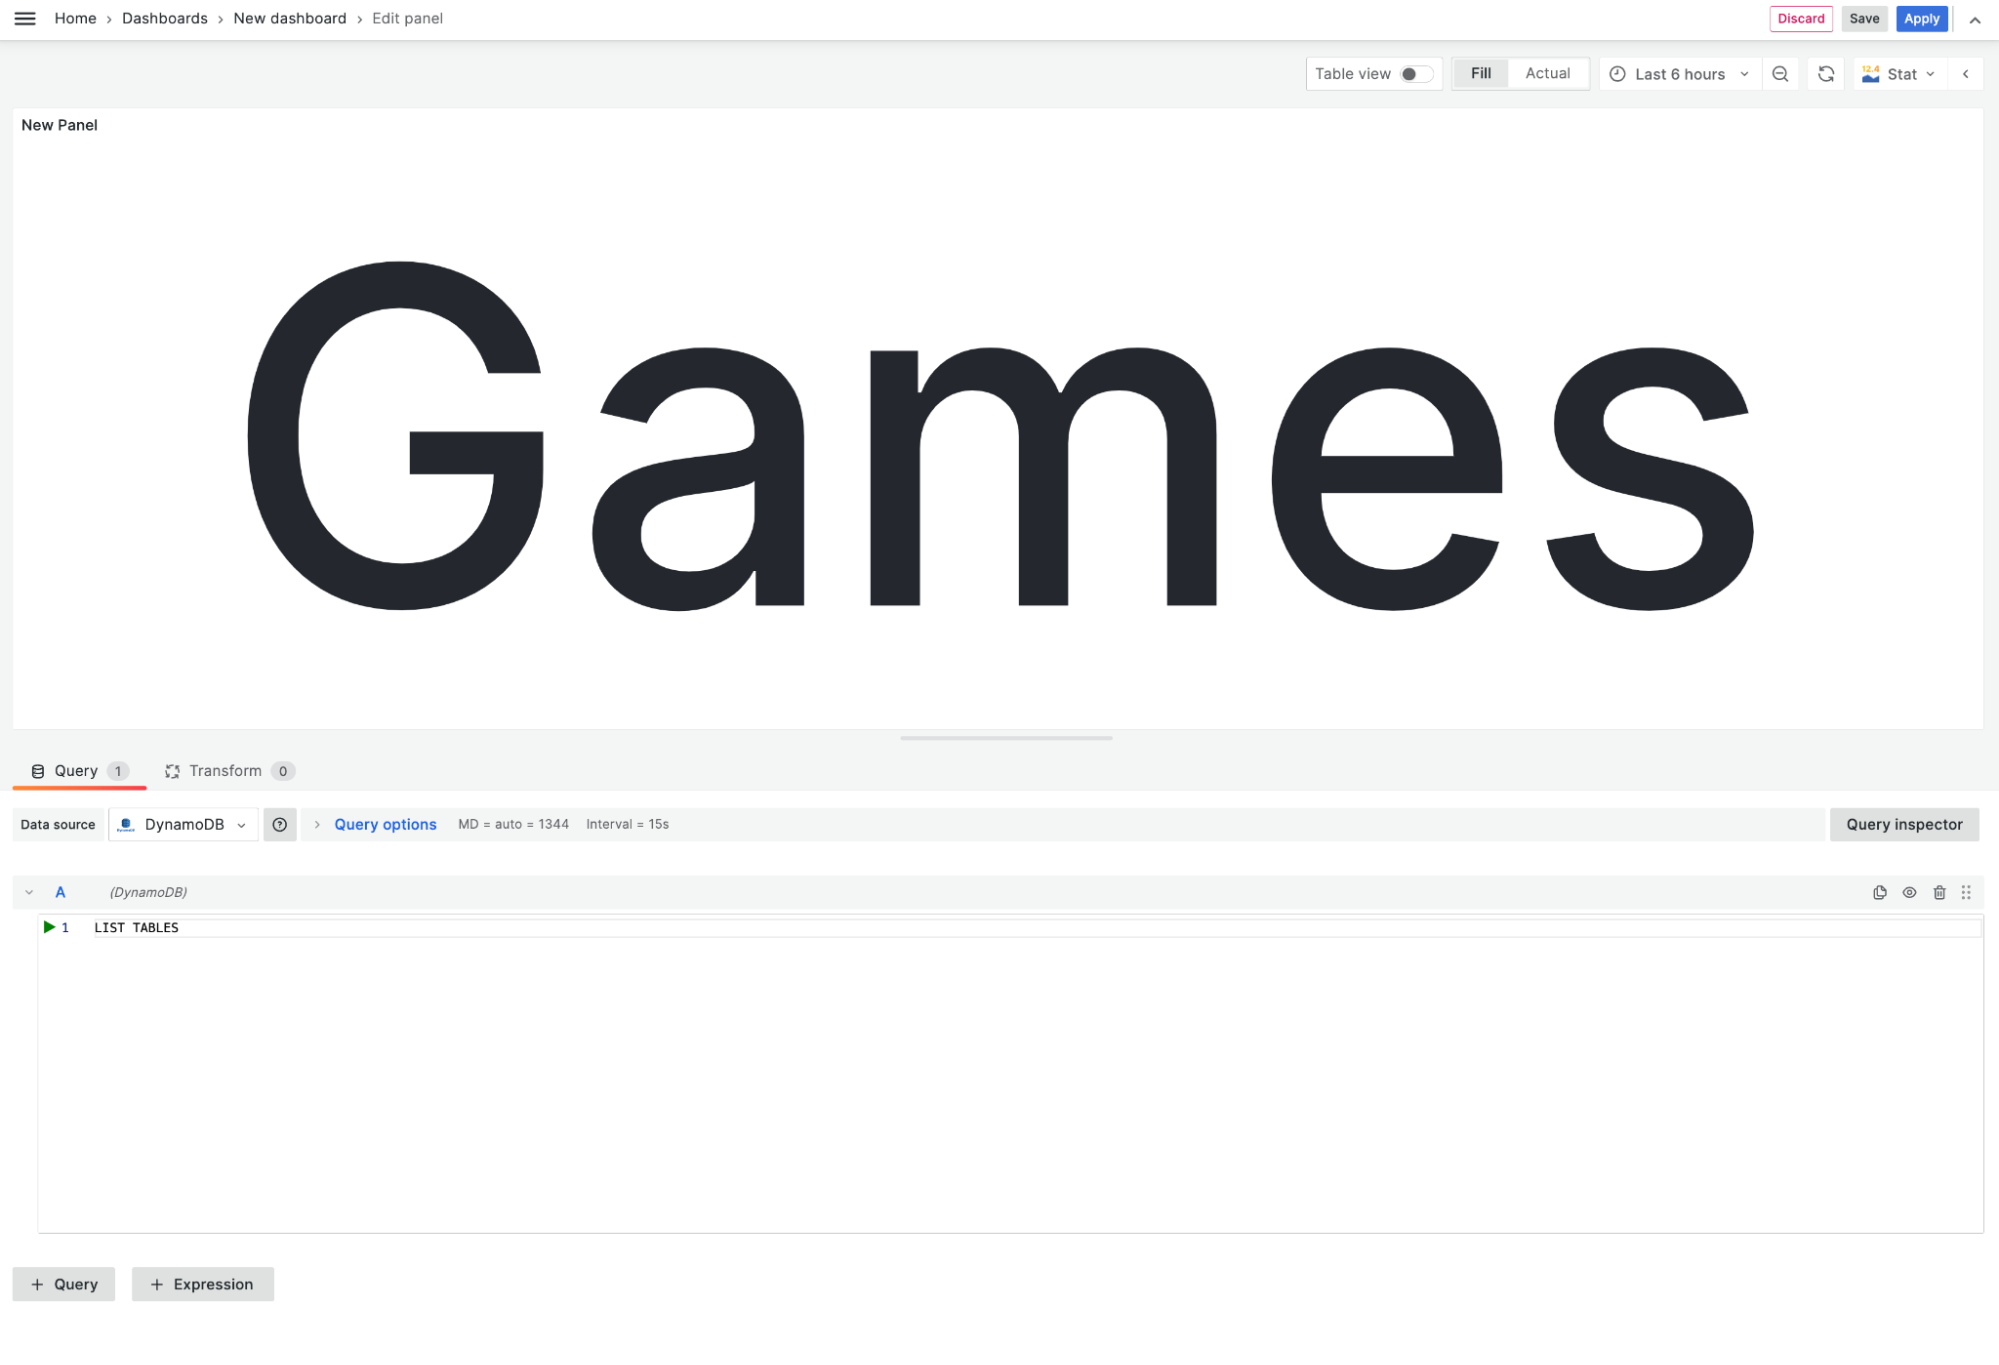
Now generally available, the data source supports PartiQL, an expressive, SQL-compatible query language that’s used to select, insert, update, and delete data in Amazon DynamoDB. It also provides an editor to format and color code your PartiQL statements.
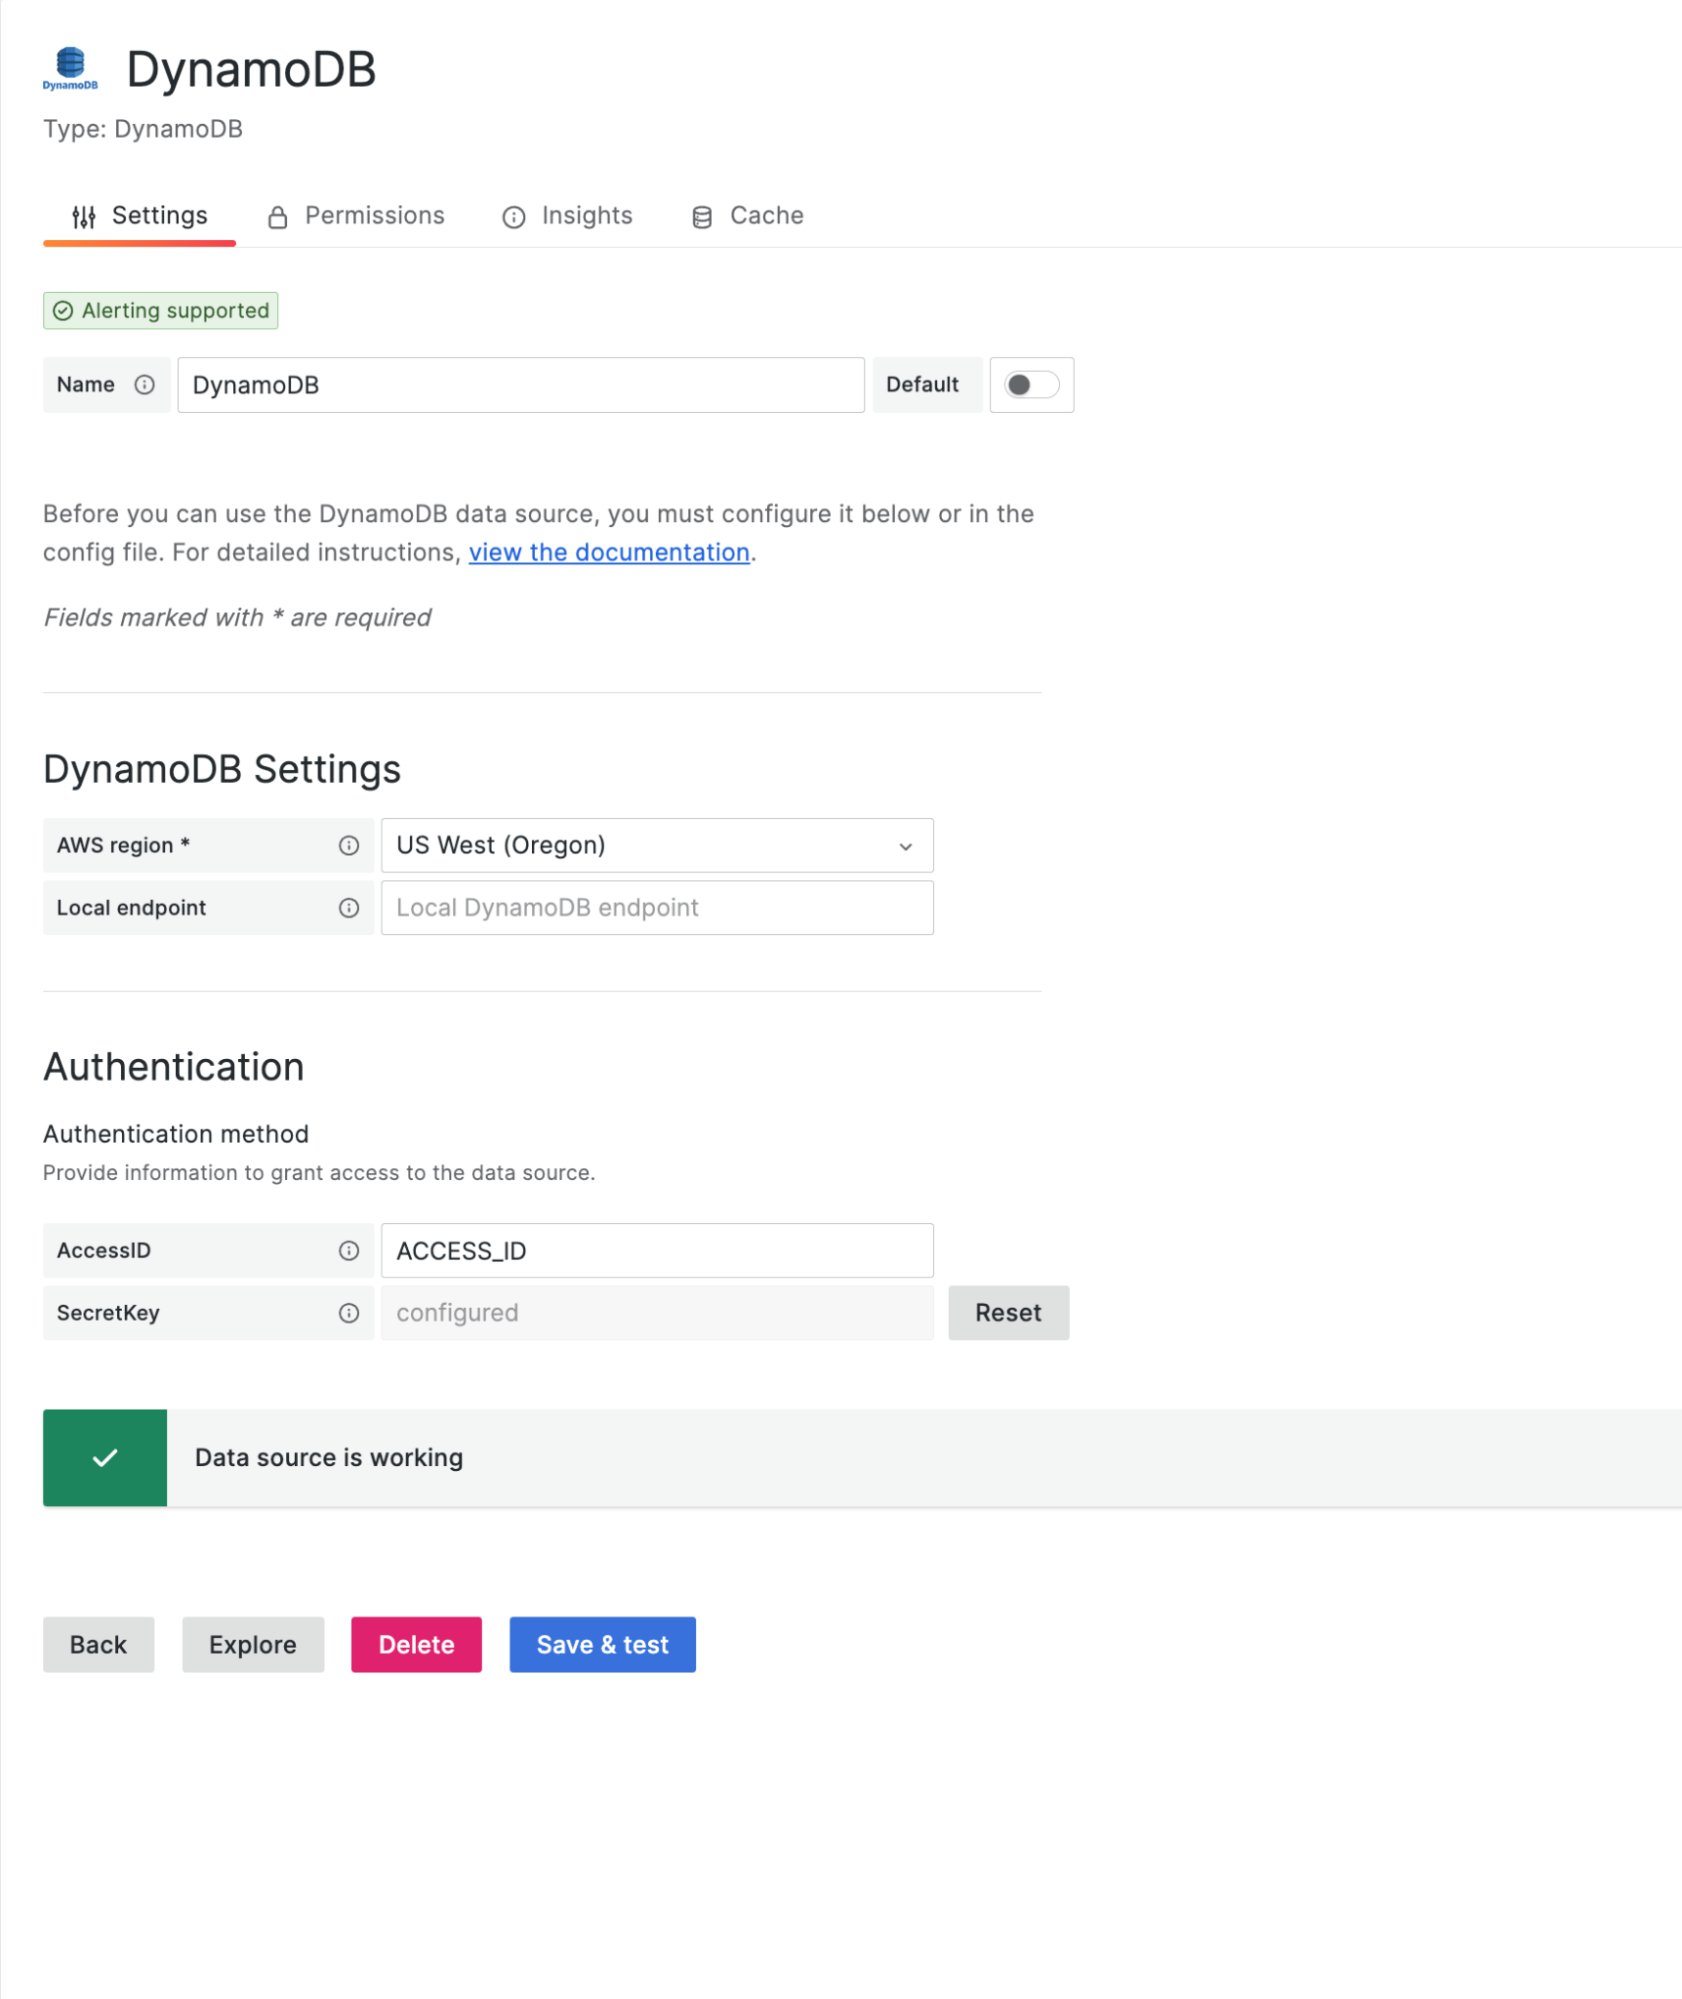
The easiest way to get started with the DynamoDB data source is to try AWS’s “Tic-Tac-Toe” example application. Start by setting your database credentials in the config page.

Once it’s working, run the application as described in the AWS documentation. Then, test if you have access, and start running queries against your DynamoDB instance.

To enable the time series visualization option with this plugin, add a datetime field type to your query, which will be used as a timestamp.
To learn more, check out our technical documentation.
Our new public roadmap for data sources
Our continued investment in creating new data sources underpins our big tent philosophy, providing our users with complete flexibility as to which tools they use and where their data lives. We believe building together, in the open, is the best way to make useful tools, and that our global community can improve and extend Grafana in ways beyond our imagination.
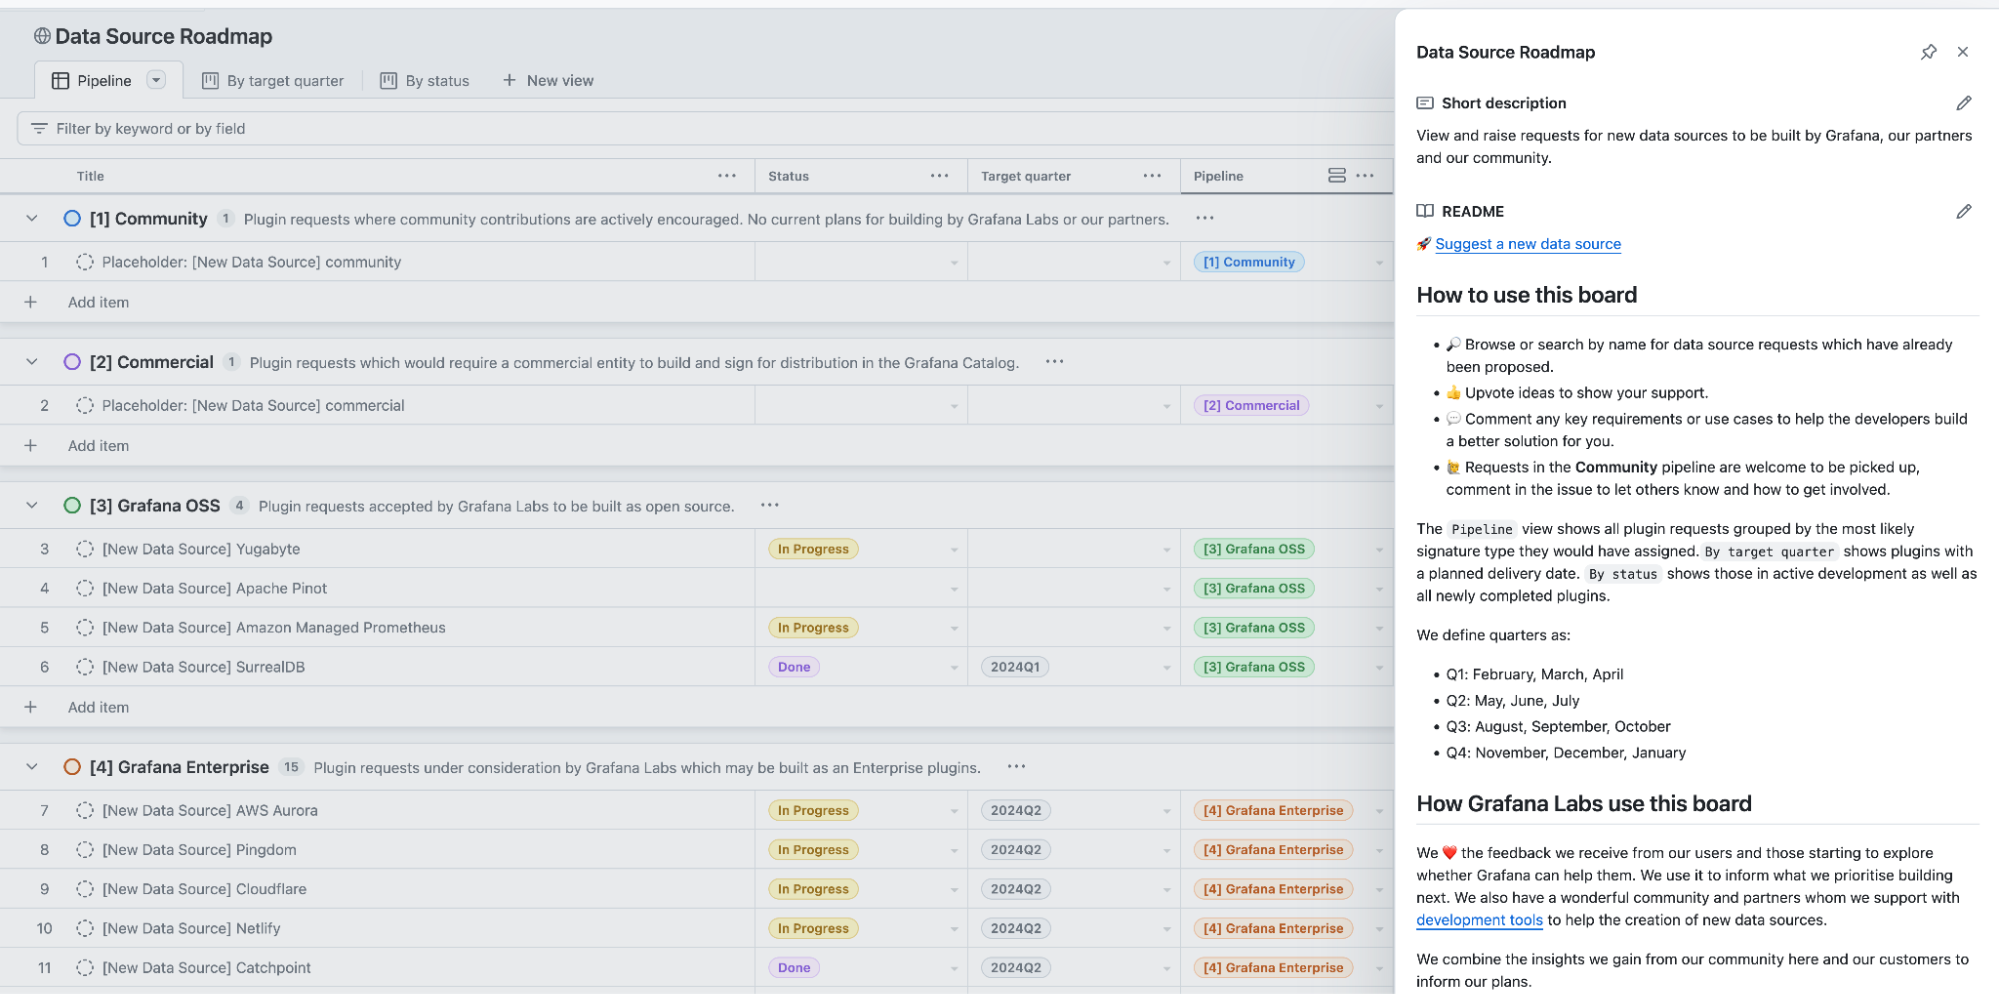
To that end, we’ve created a new public roadmap for data source plugins being built by Grafana, our partners, and our community. All Grafana users can now see our current plans for plugin development, as well as request new plugins, upvote existing requests, or comment with ideas and requirements.

Through this public roadmap, we hope to provide a clear channel for feedback, helping us prioritize which projects and services we support. For our valued community of prolific plugin developers, we hope this public roadmap achieves three specific goals:
- Acts as a space to gather collaborators for a project
- Facilitates earlier and more transparent feedback from Grafana Labs regarding acceptance to our plugin catalog
- Helps promote the upcoming availability of your plugin
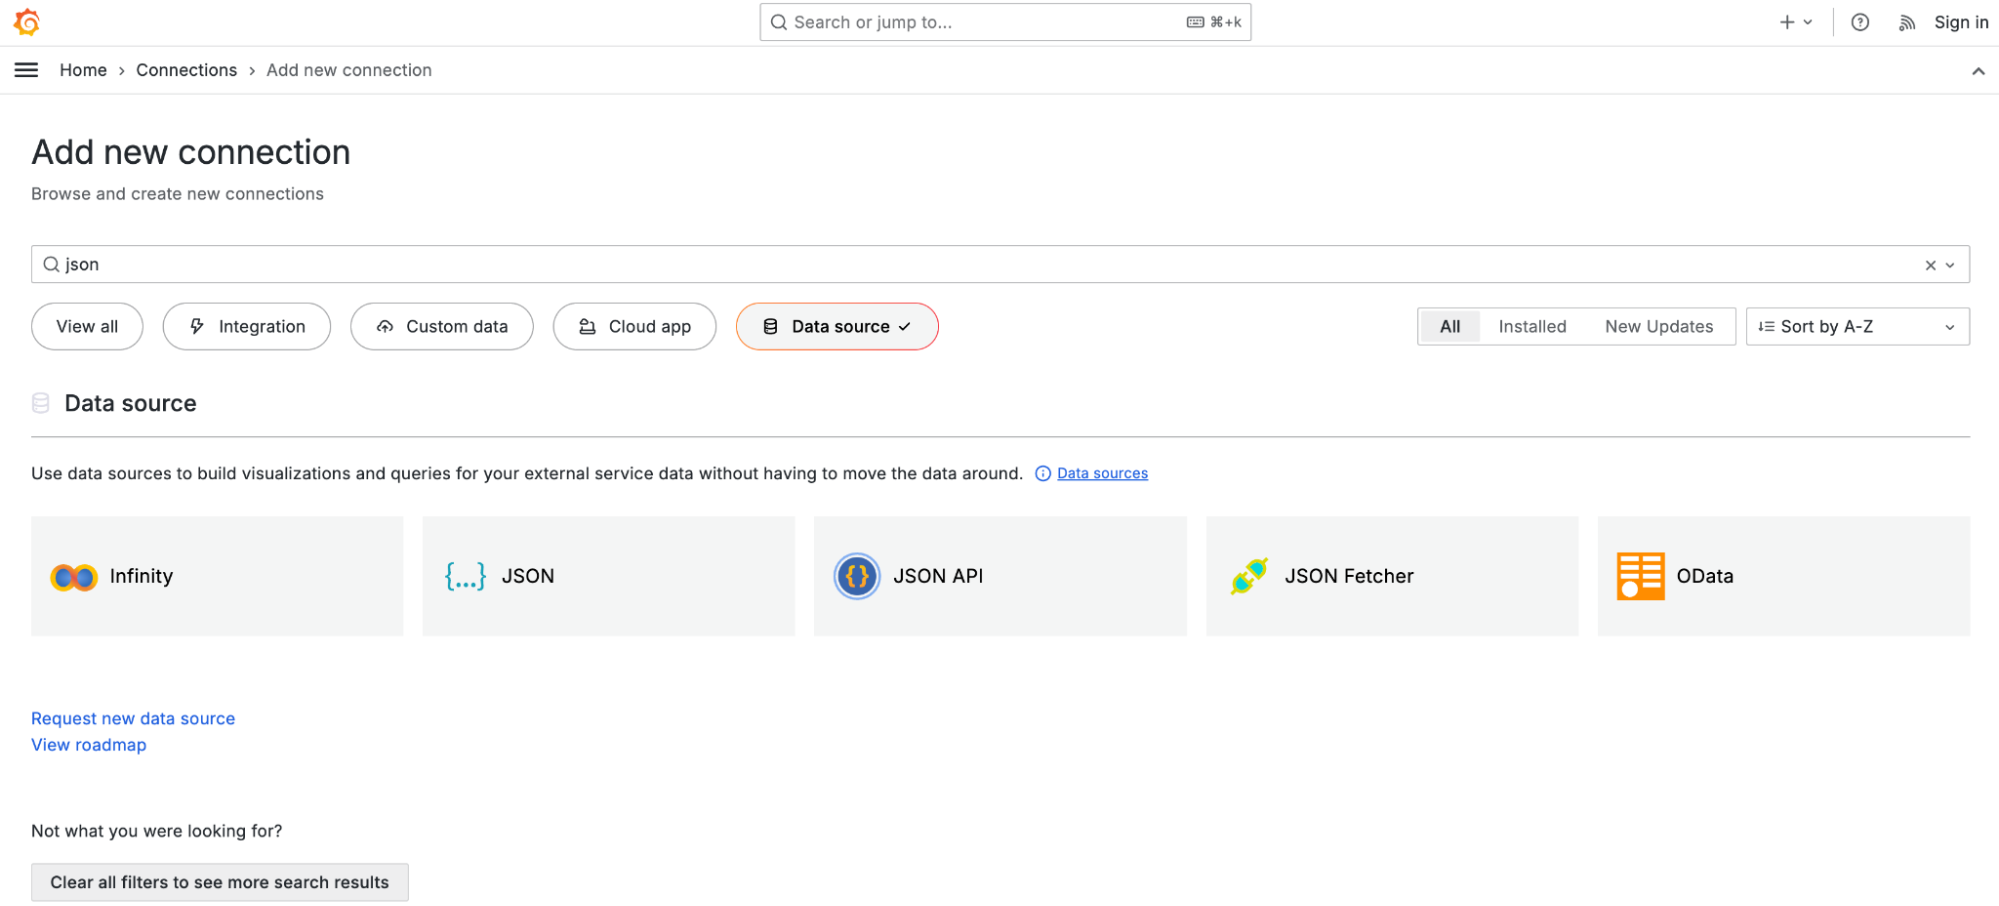
Links to the roadmap, and to request a new data source, have been added to the Connections view in Grafana Cloud, and are available in OSS and Grafana Enterprise, as of the Grafana 11.2 release. We will continue to update and evolve the roadmap over the coming months, including exploring ways for community members to engage from outside of GitHub and for requests and voting to happen directly within Grafana.

The pipeline view allows you to view plugins based on the signature level they will most likely be delivered under — for example, whether they would require an Enterprise plugins license. The by target quarter and by status views show which plugins are coming soon and which are being actively worked on.
We hope you find this roadmap useful, and we look forward to hearing your feedback!
The easiest way to get started with our Enterprise data source plugins is in Grafana Cloud. We have a generous forever-free tier that includes access to Enterprise data sources for 3 active users. If you haven’t already, sign up for free today!


